. 2023 Feb 8;15(682):eabn5649.
doi: 10.1126/scitranslmed.abn5649. Epub 2023 Feb 8.

Immunotoxin-αCD40 therapy activates innate and adaptive immunity and generates a durable antitumor response in glioblastoma models

Affiliations

Immunotoxin-αCD40 therapy activates innate and adaptive immunity and generates a durable antitumor response in glioblastoma models

Scott Parker et al. Sci Transl Med. .

Abstract

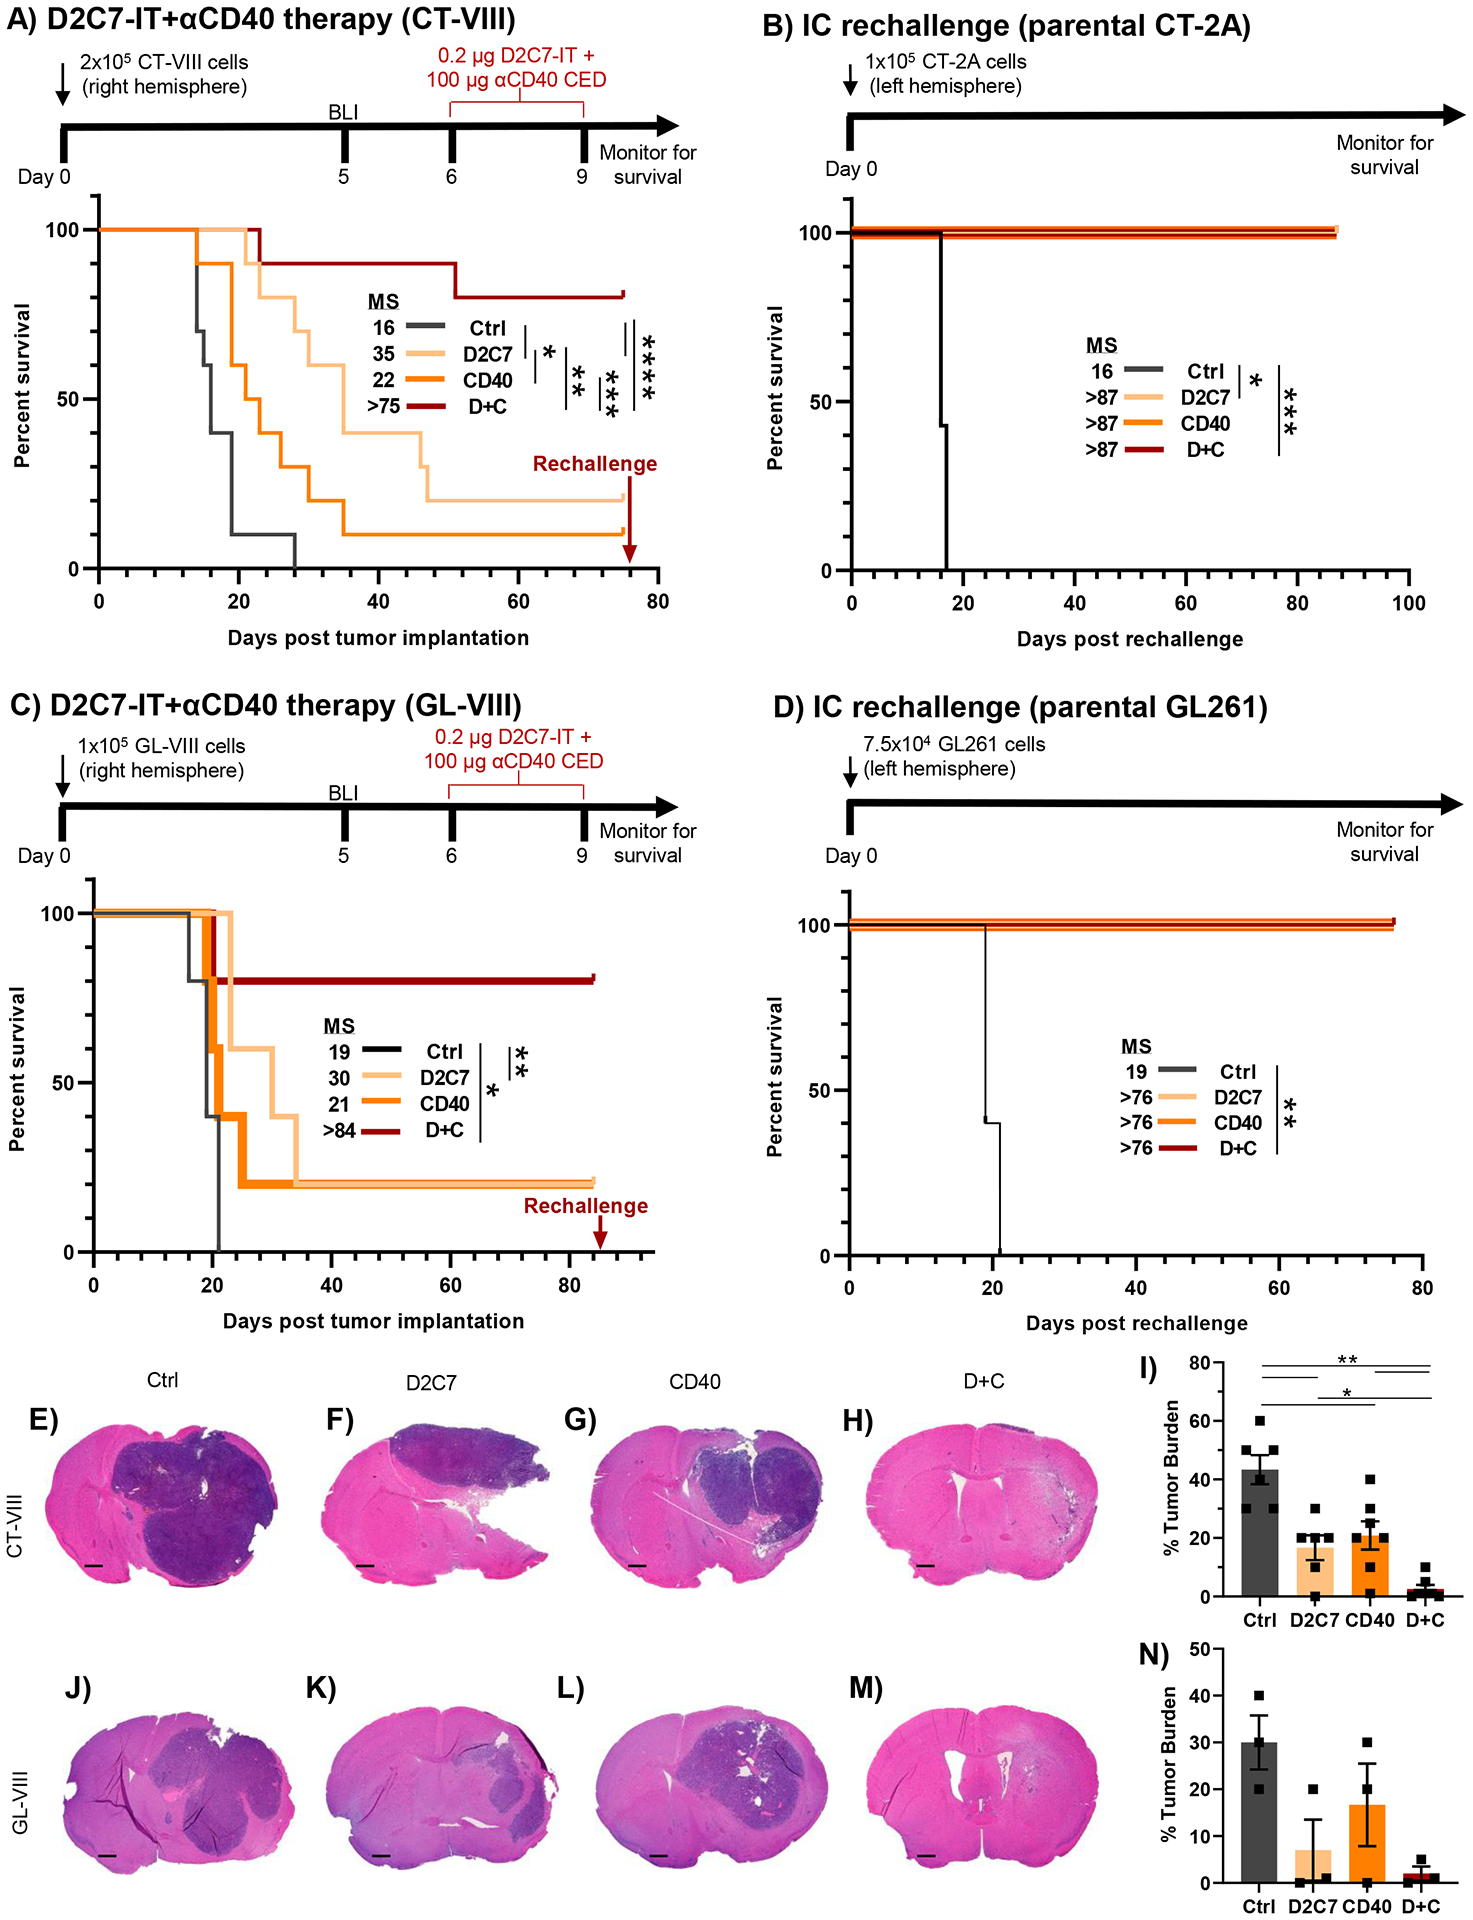
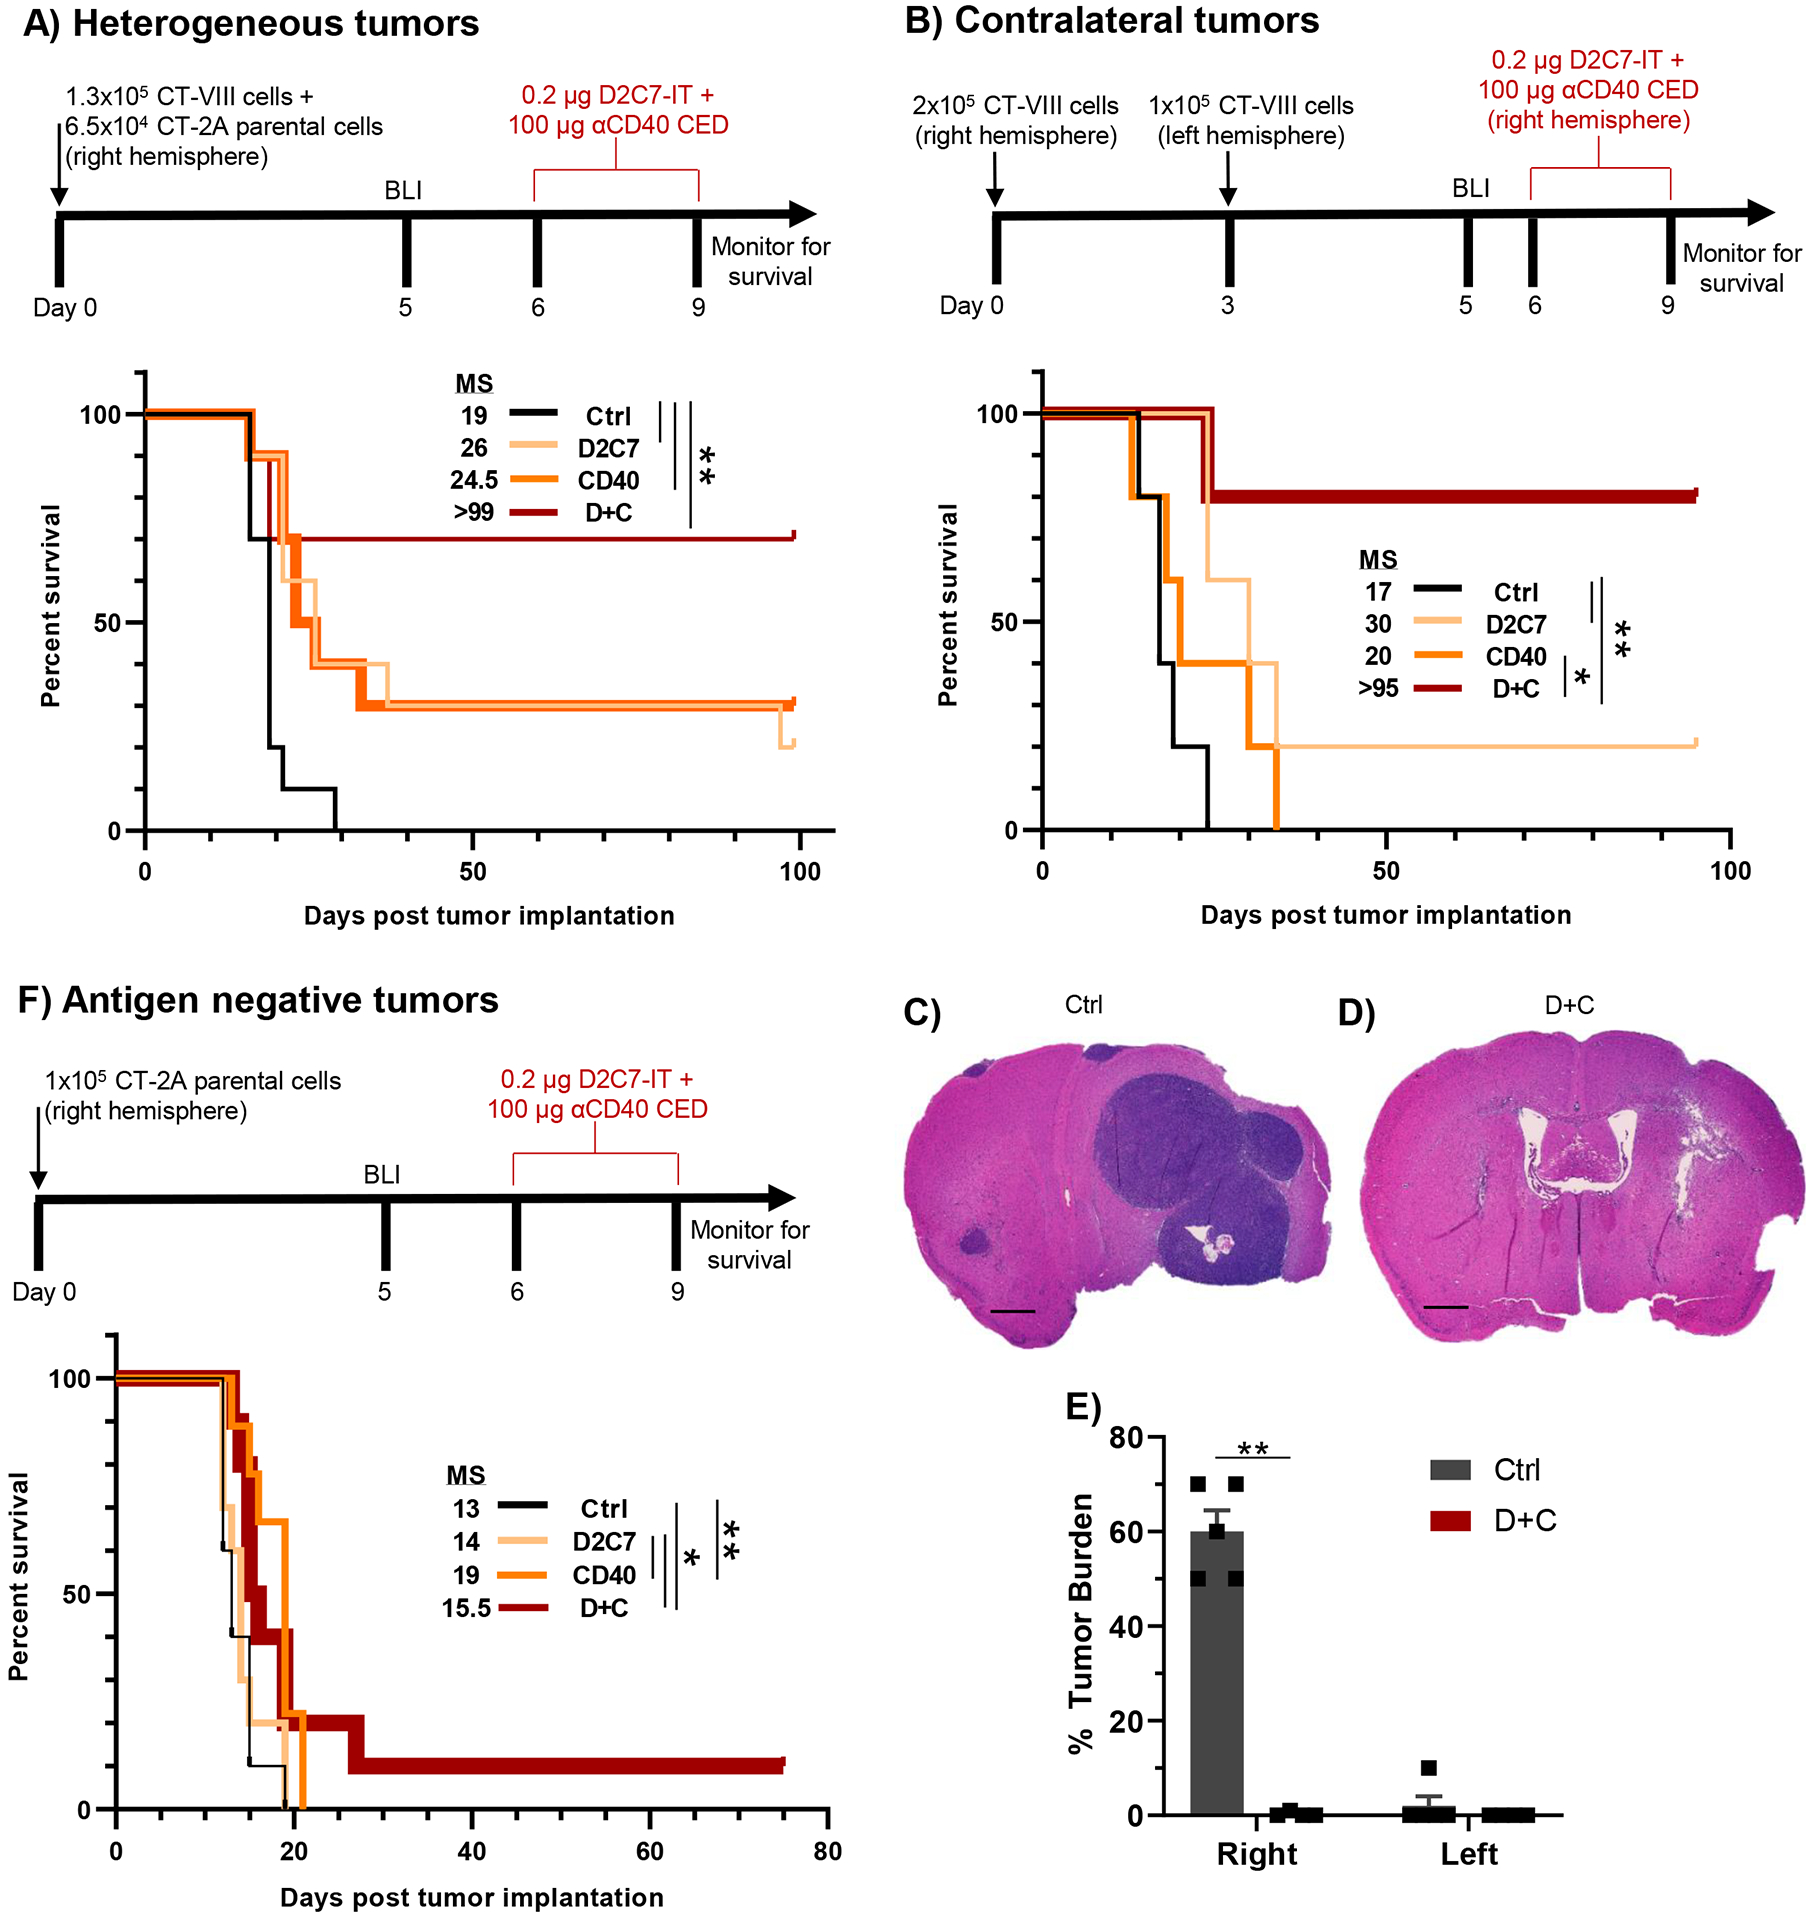
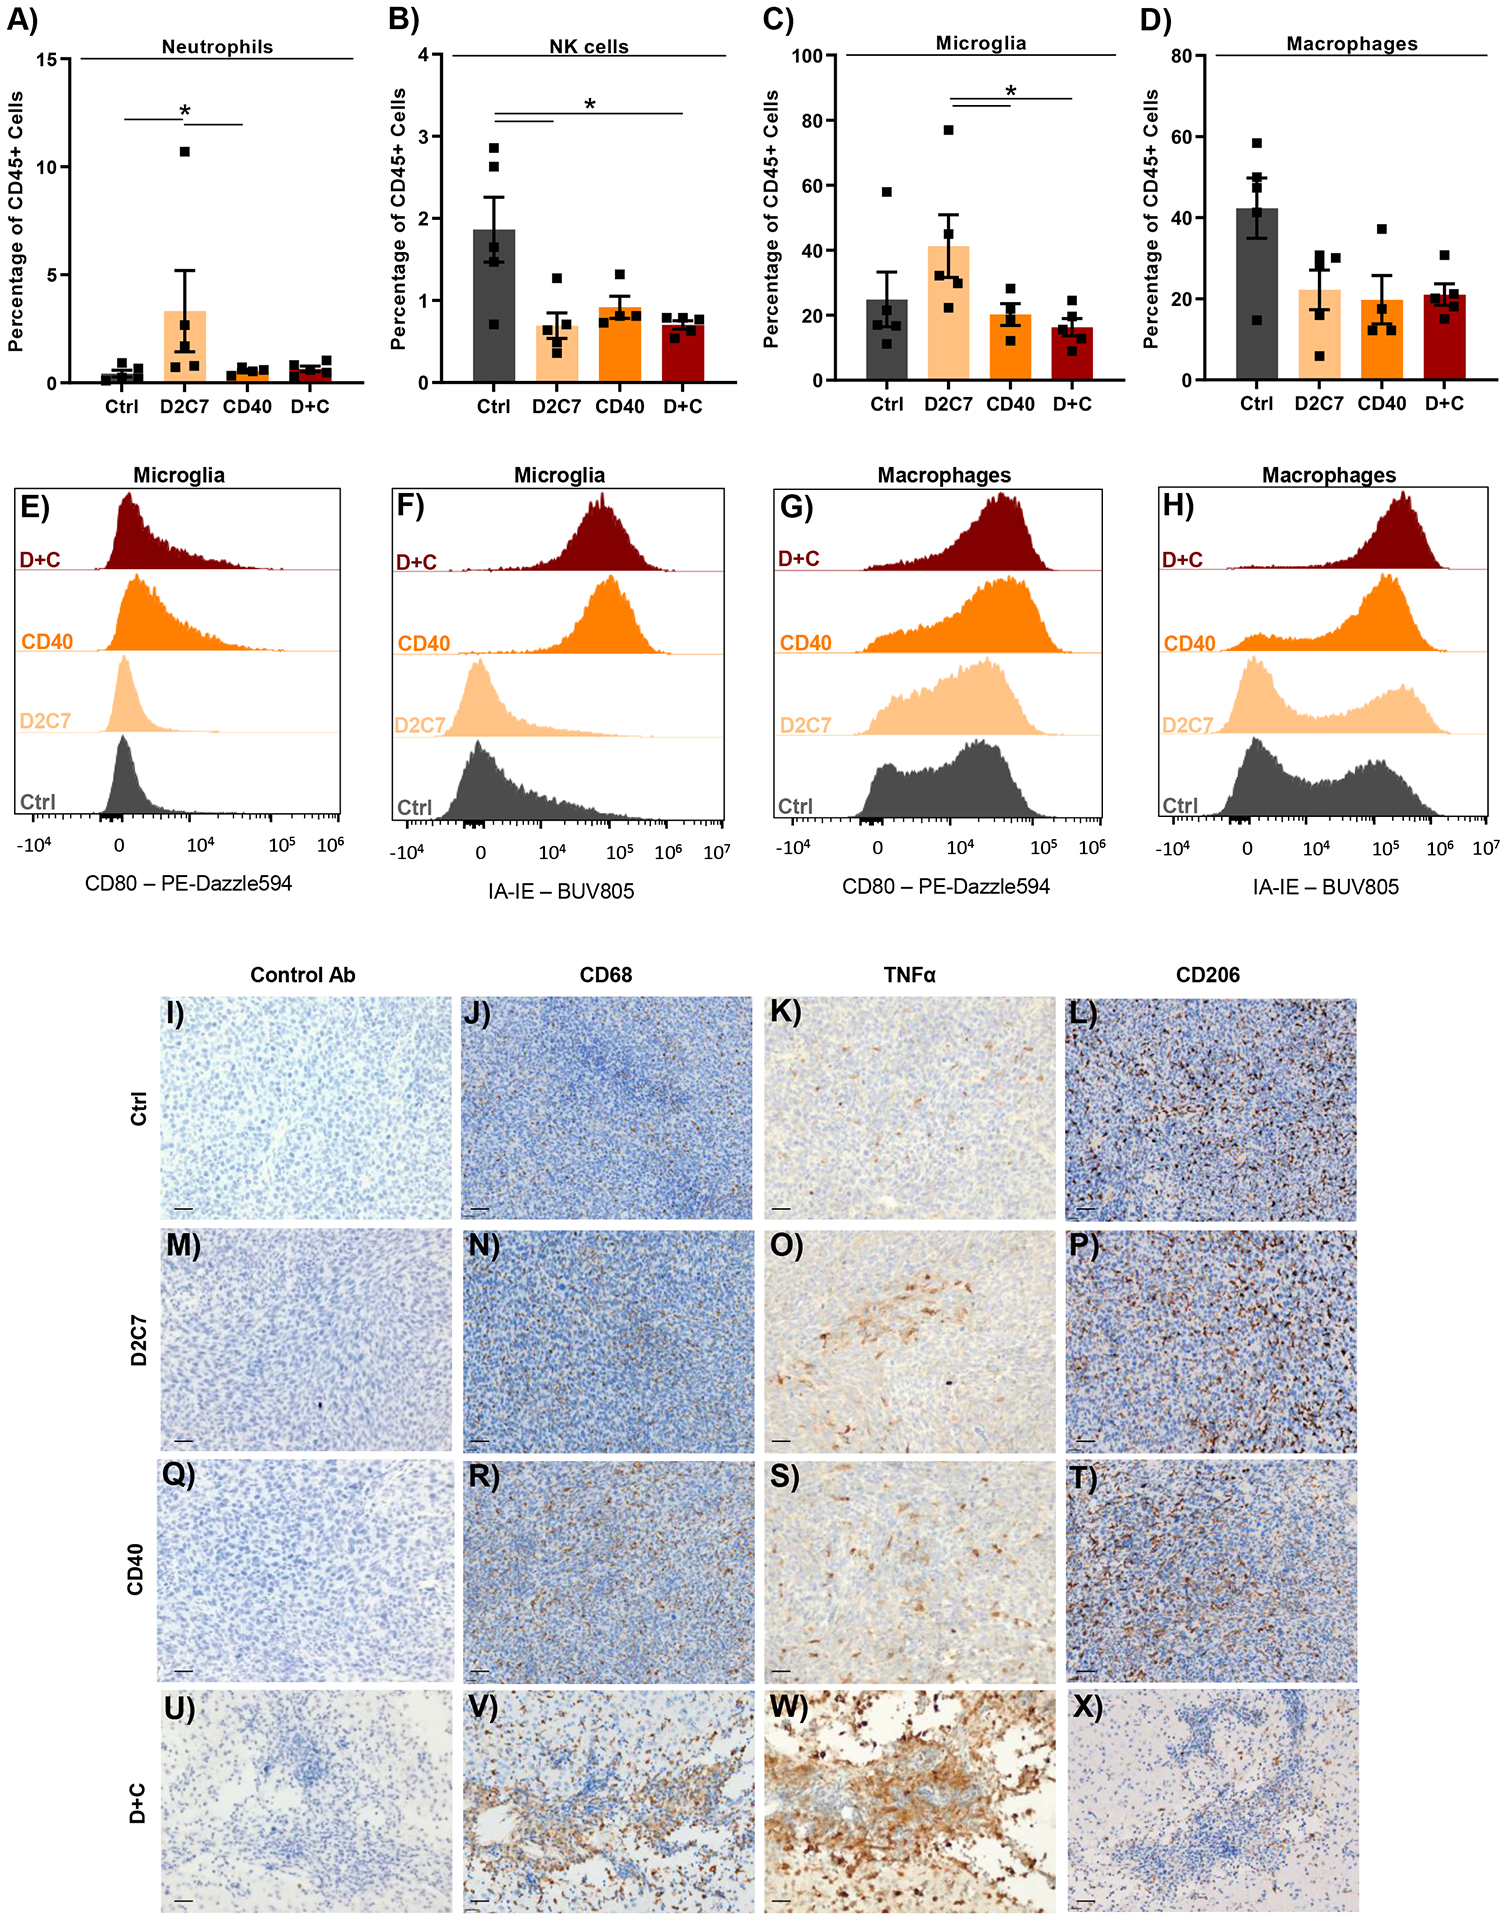
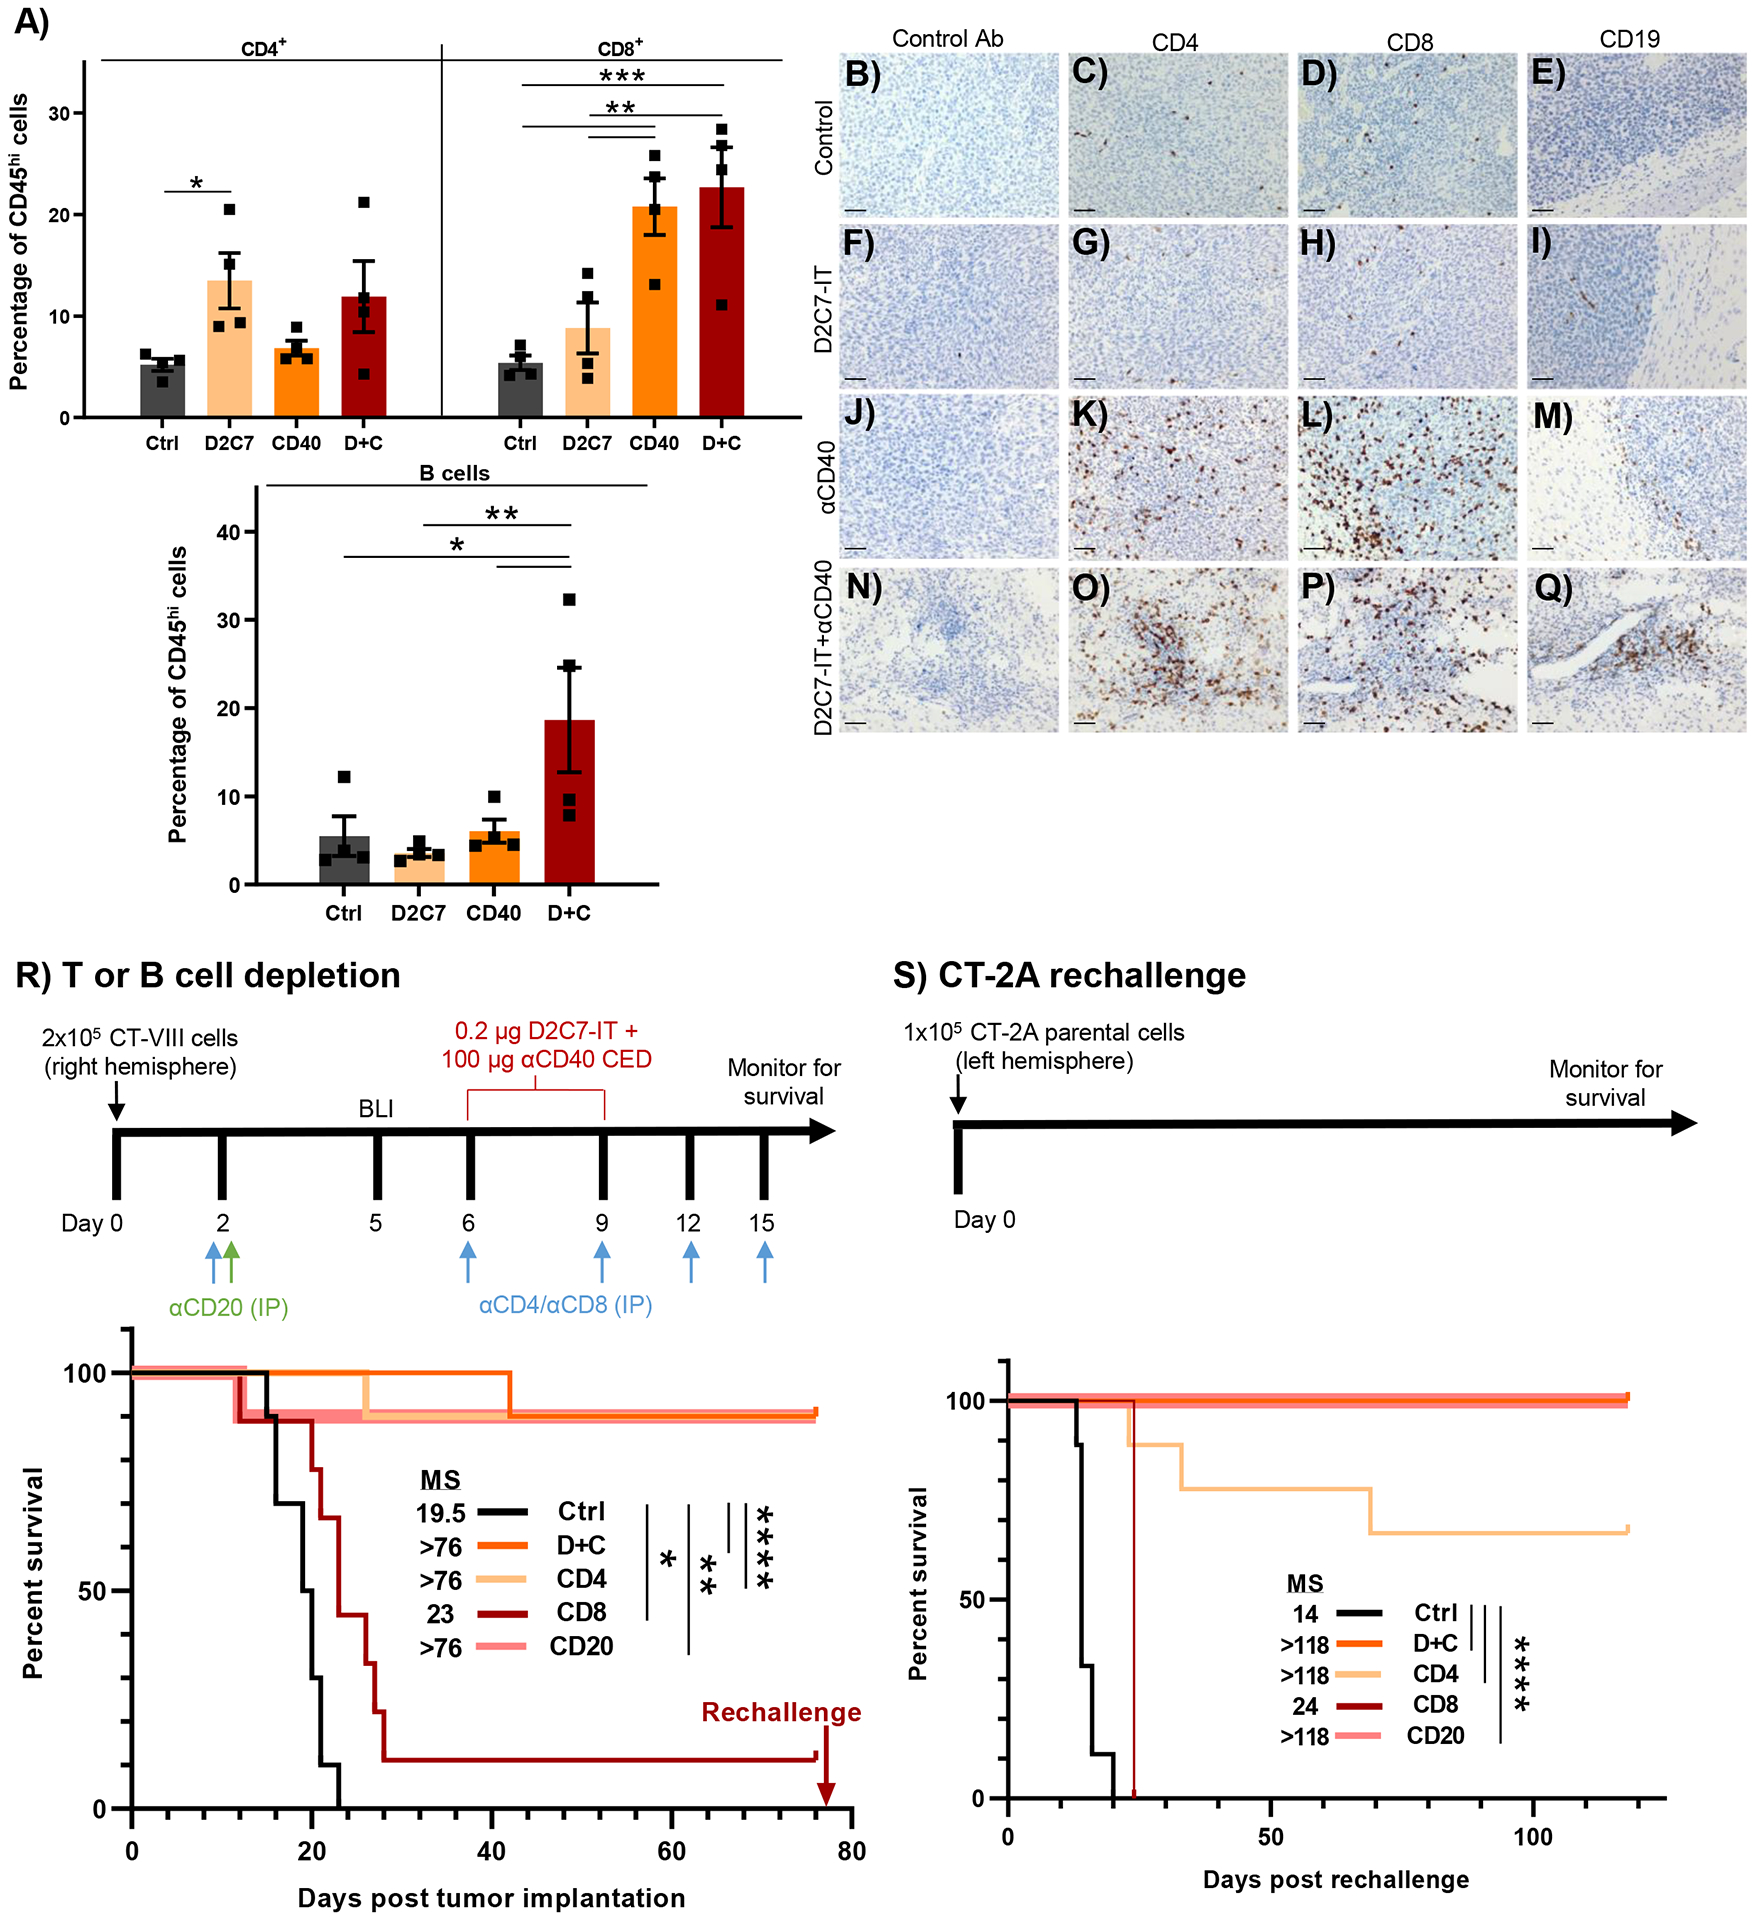
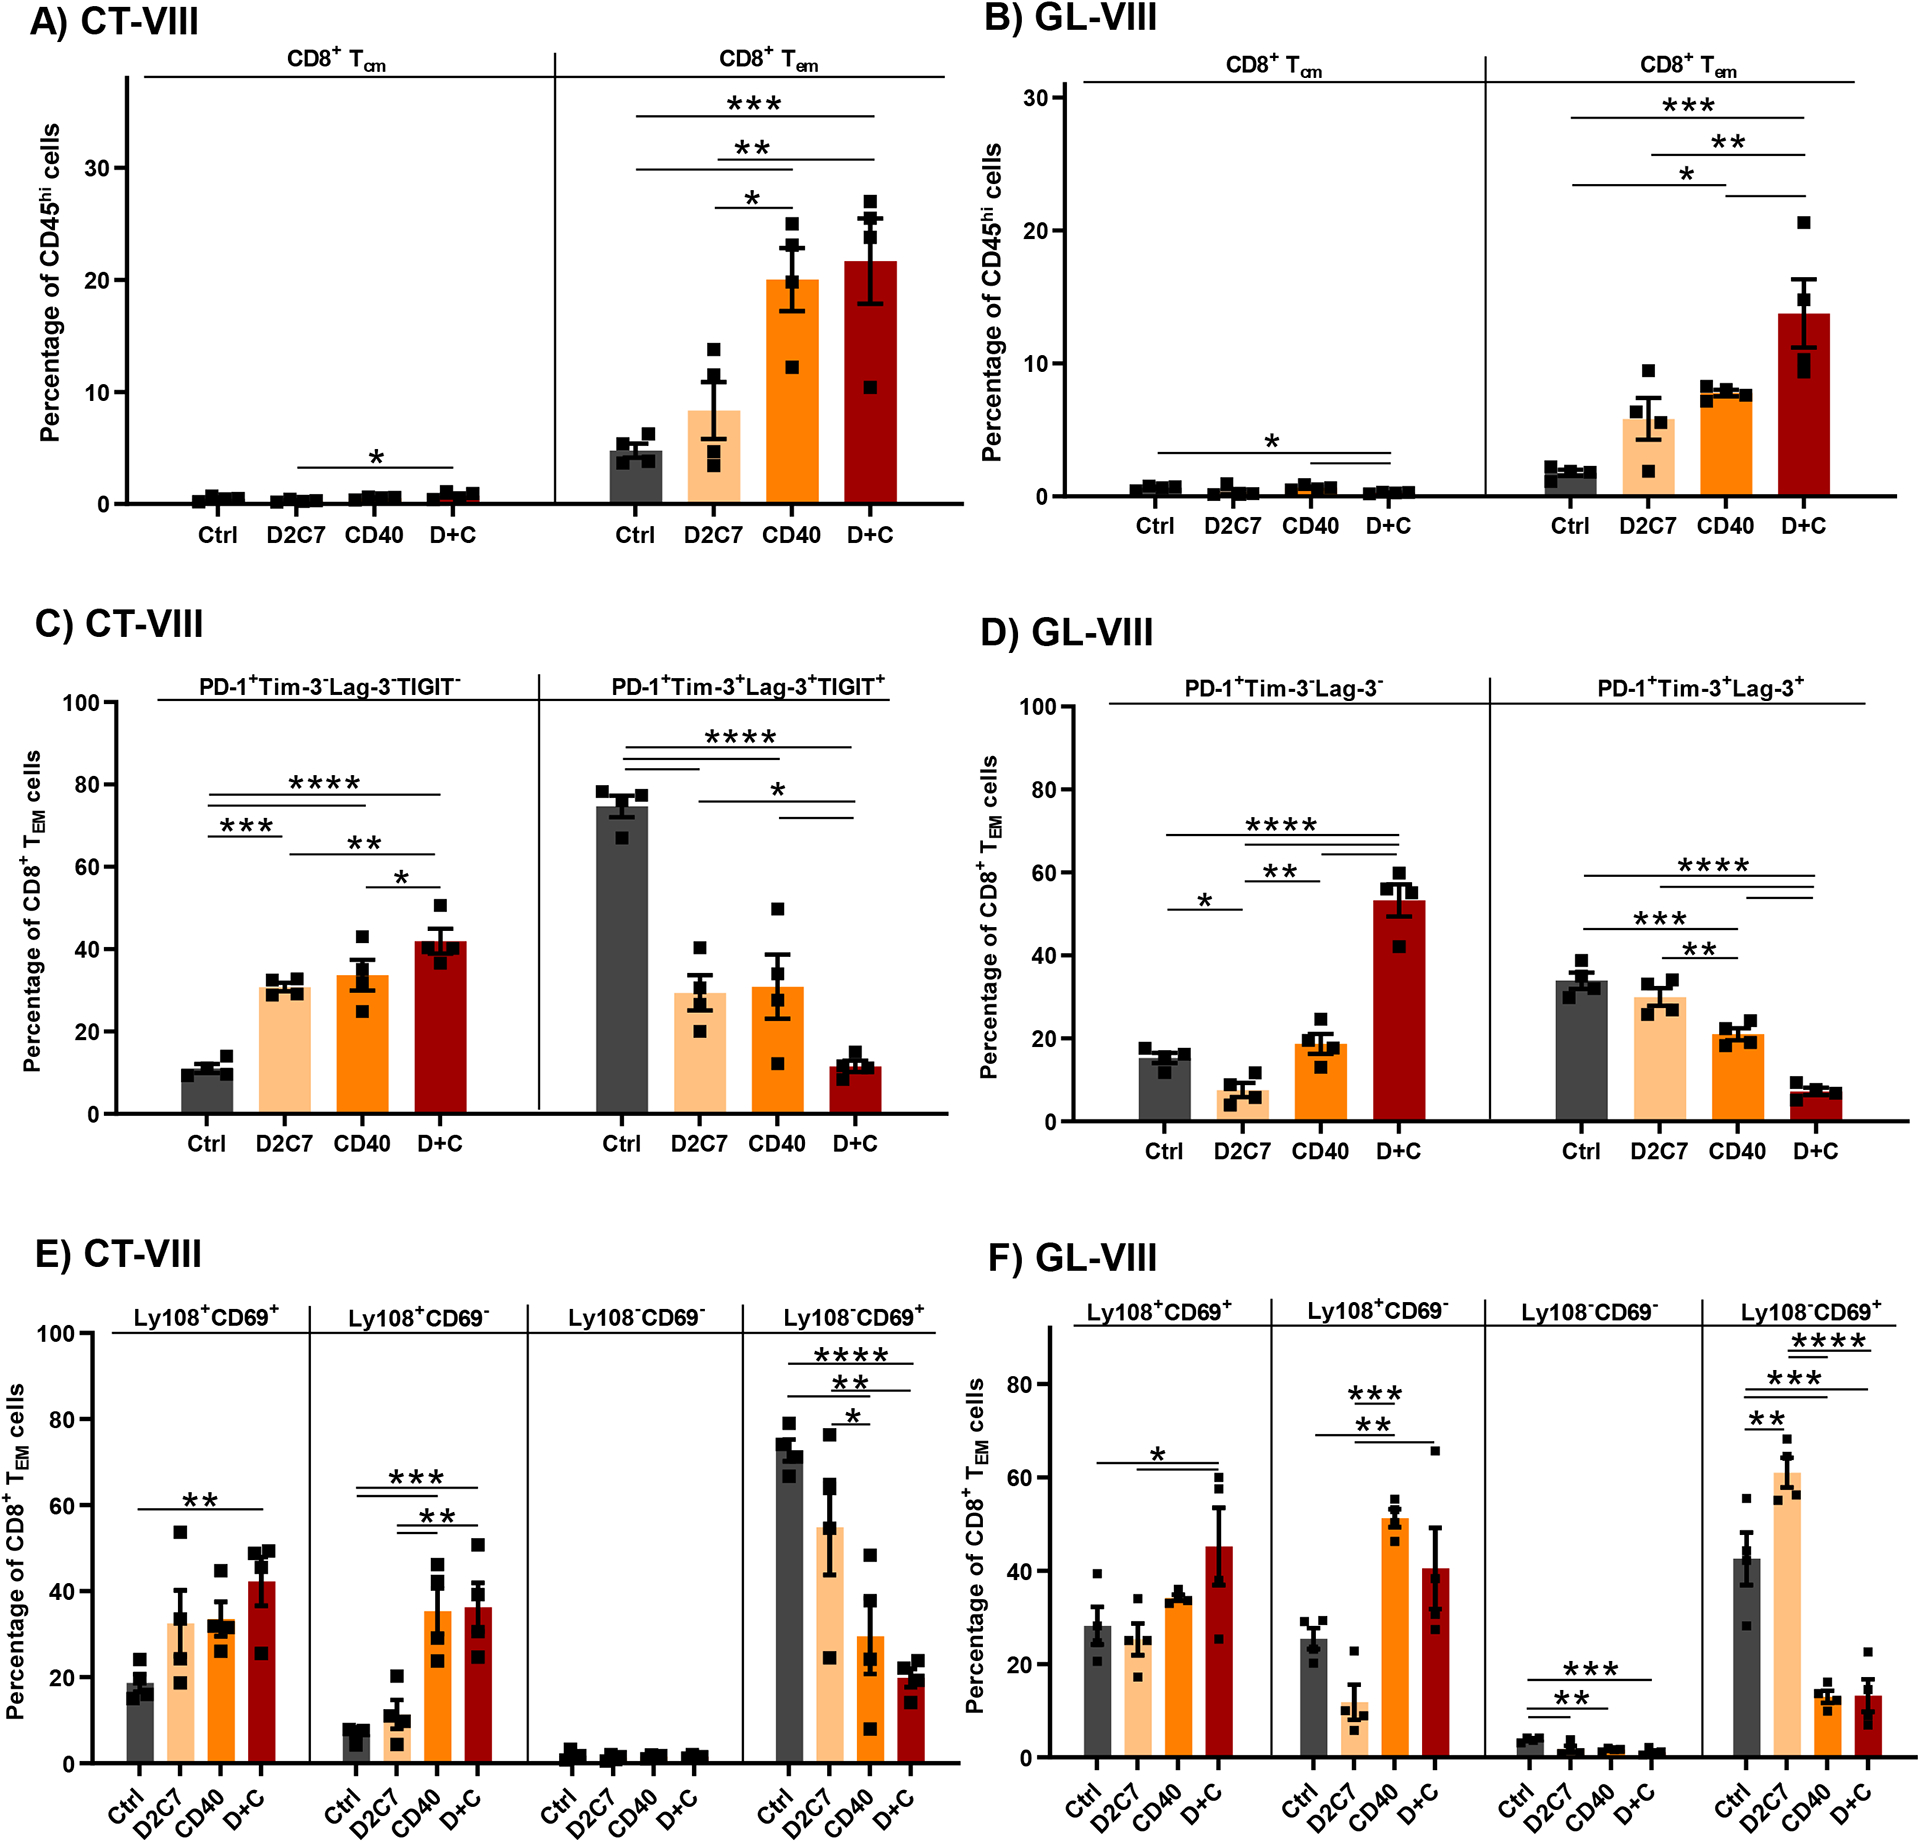
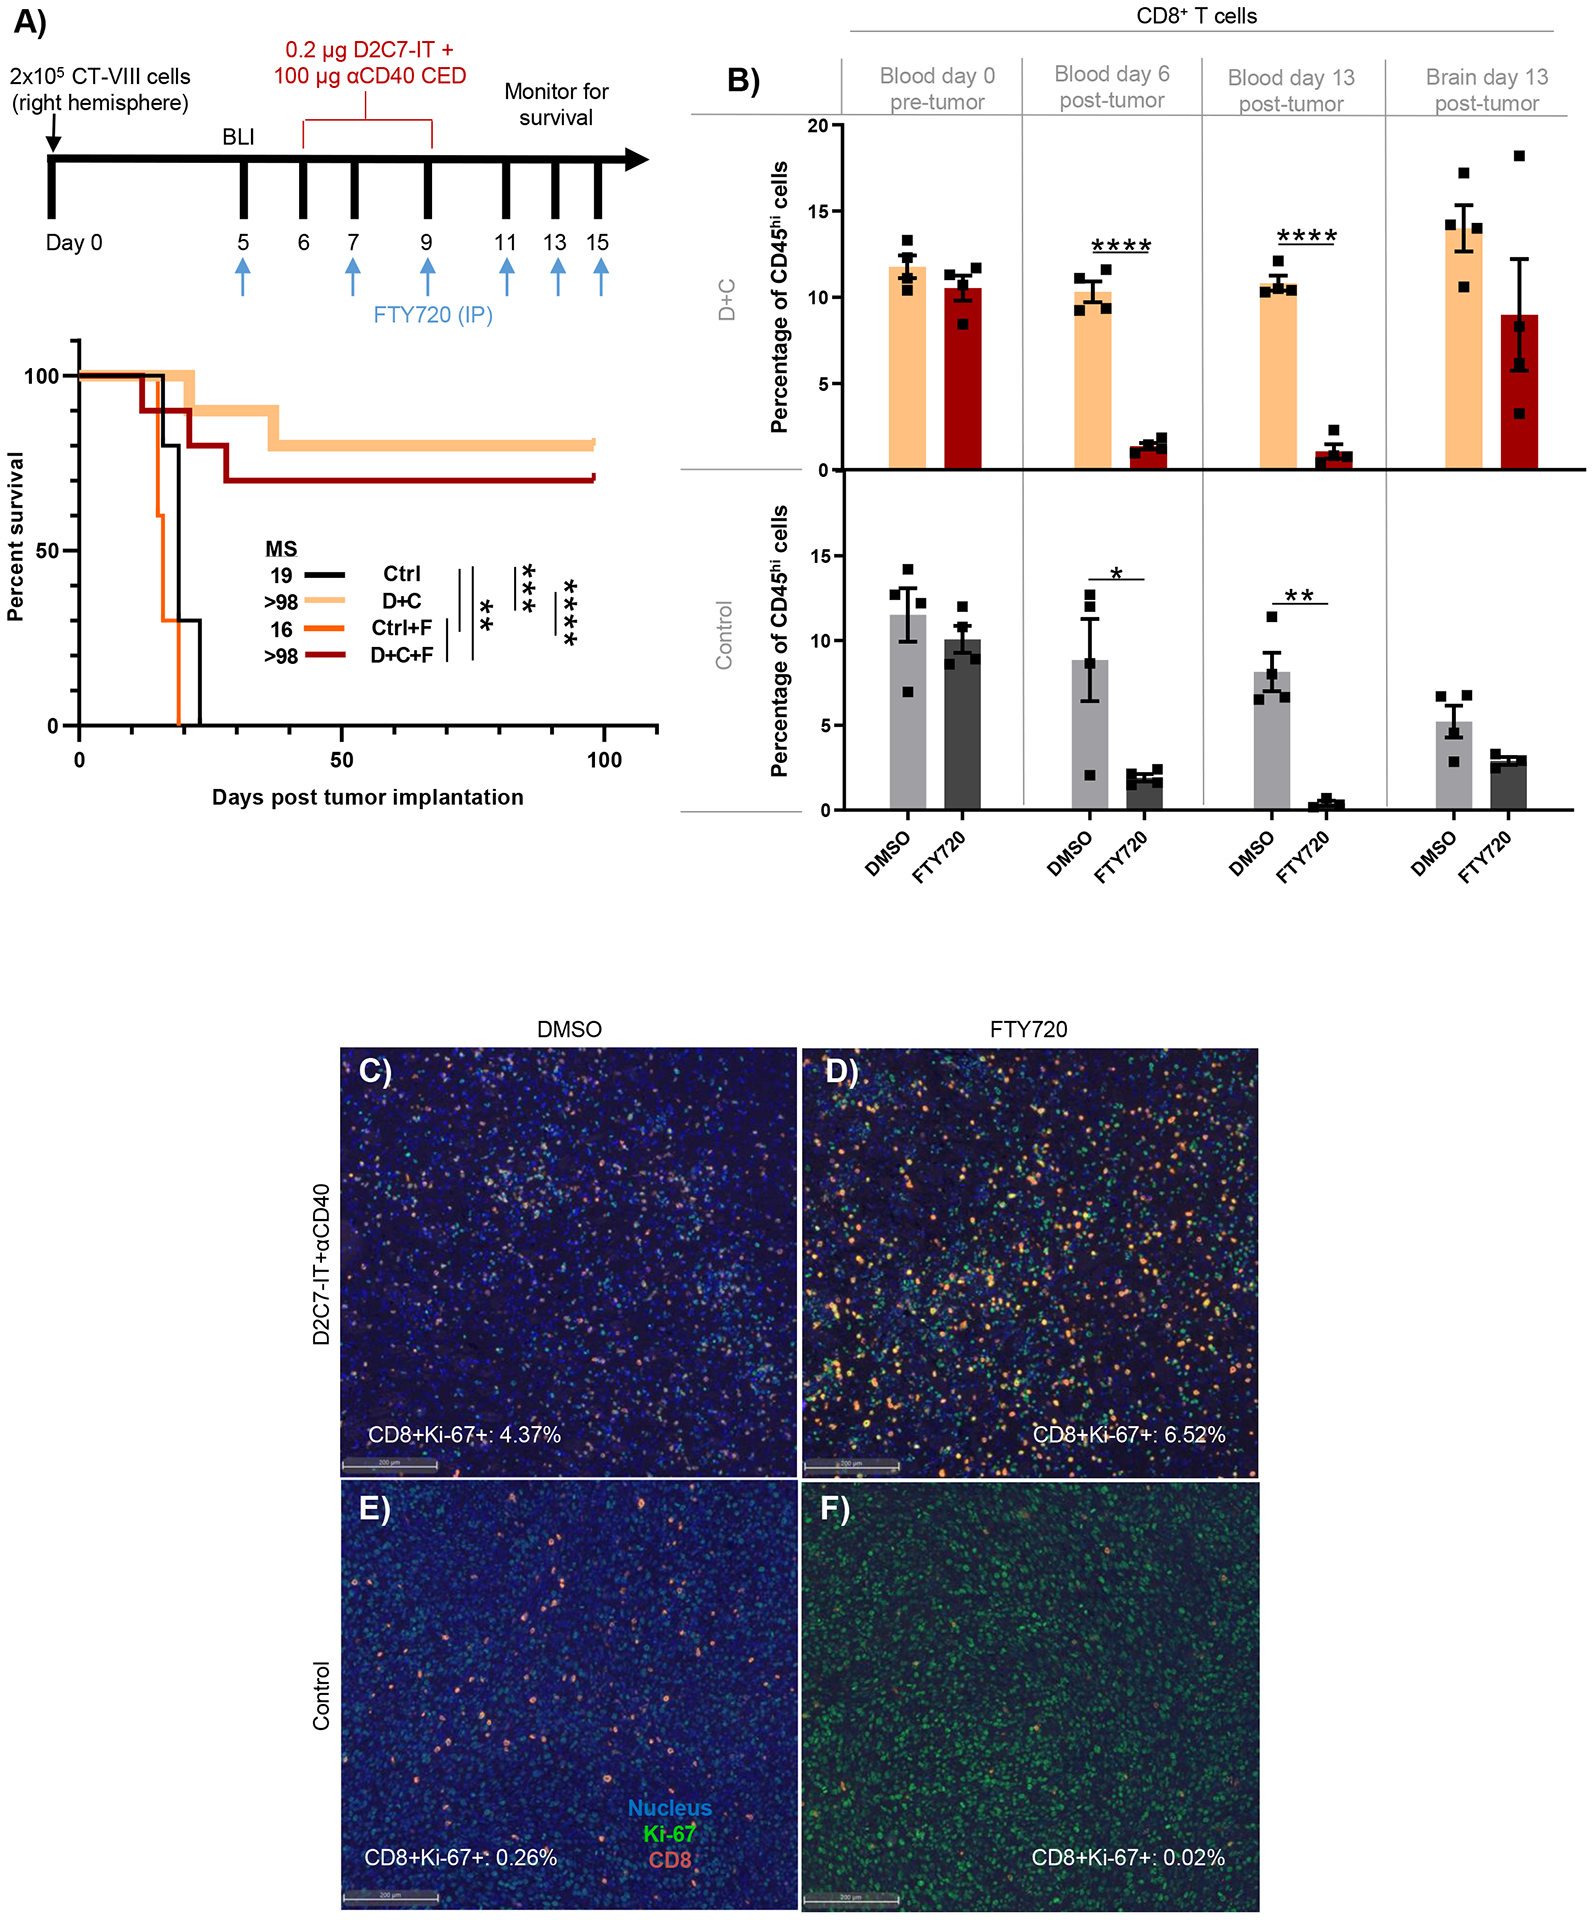
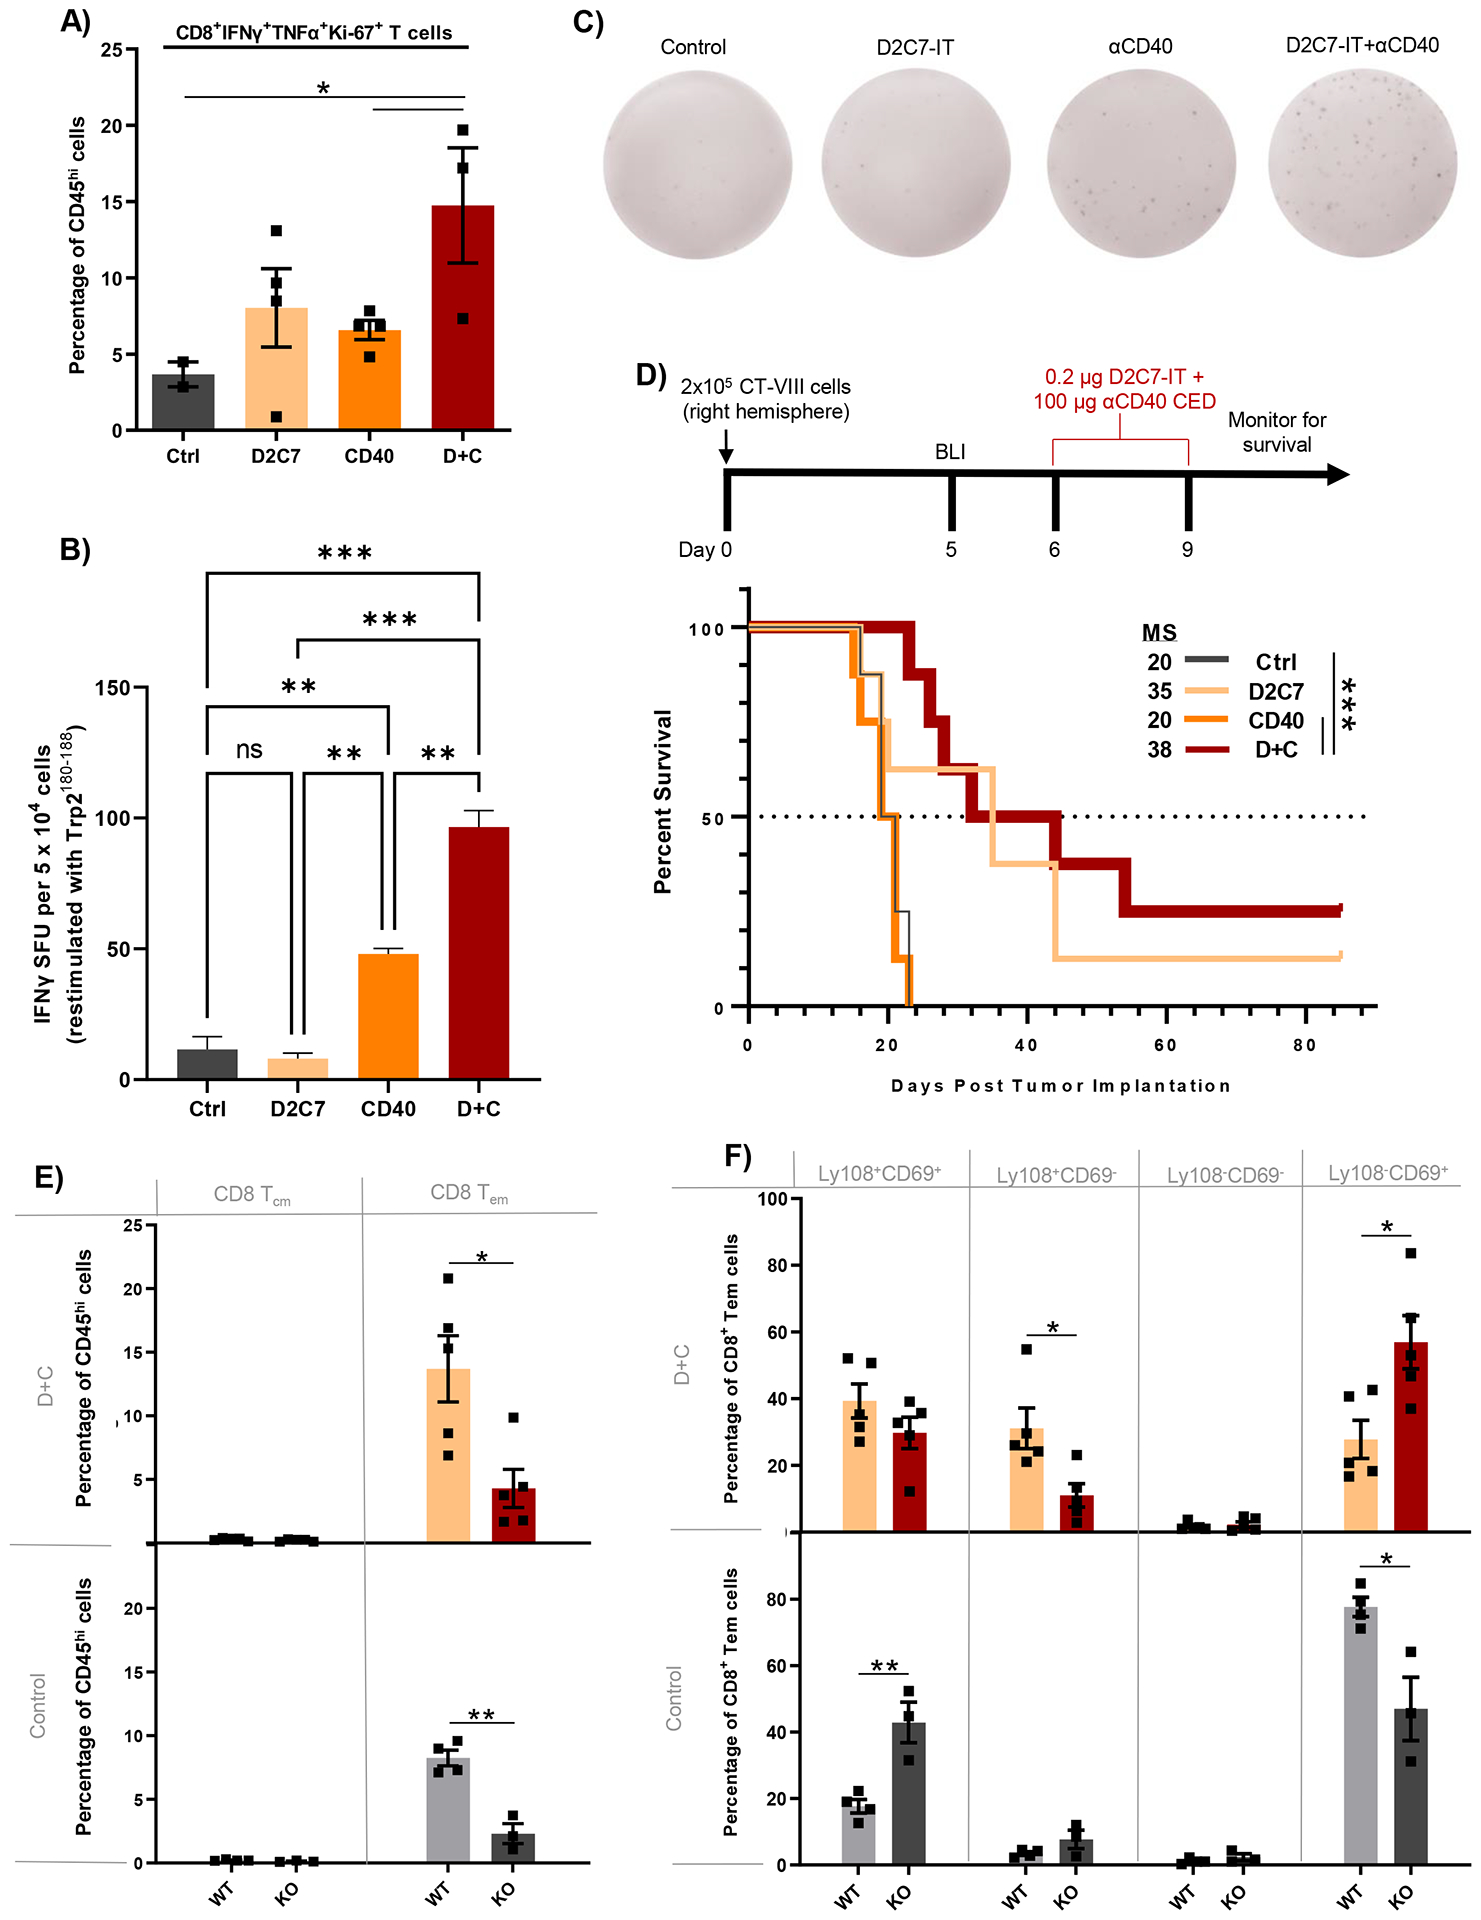
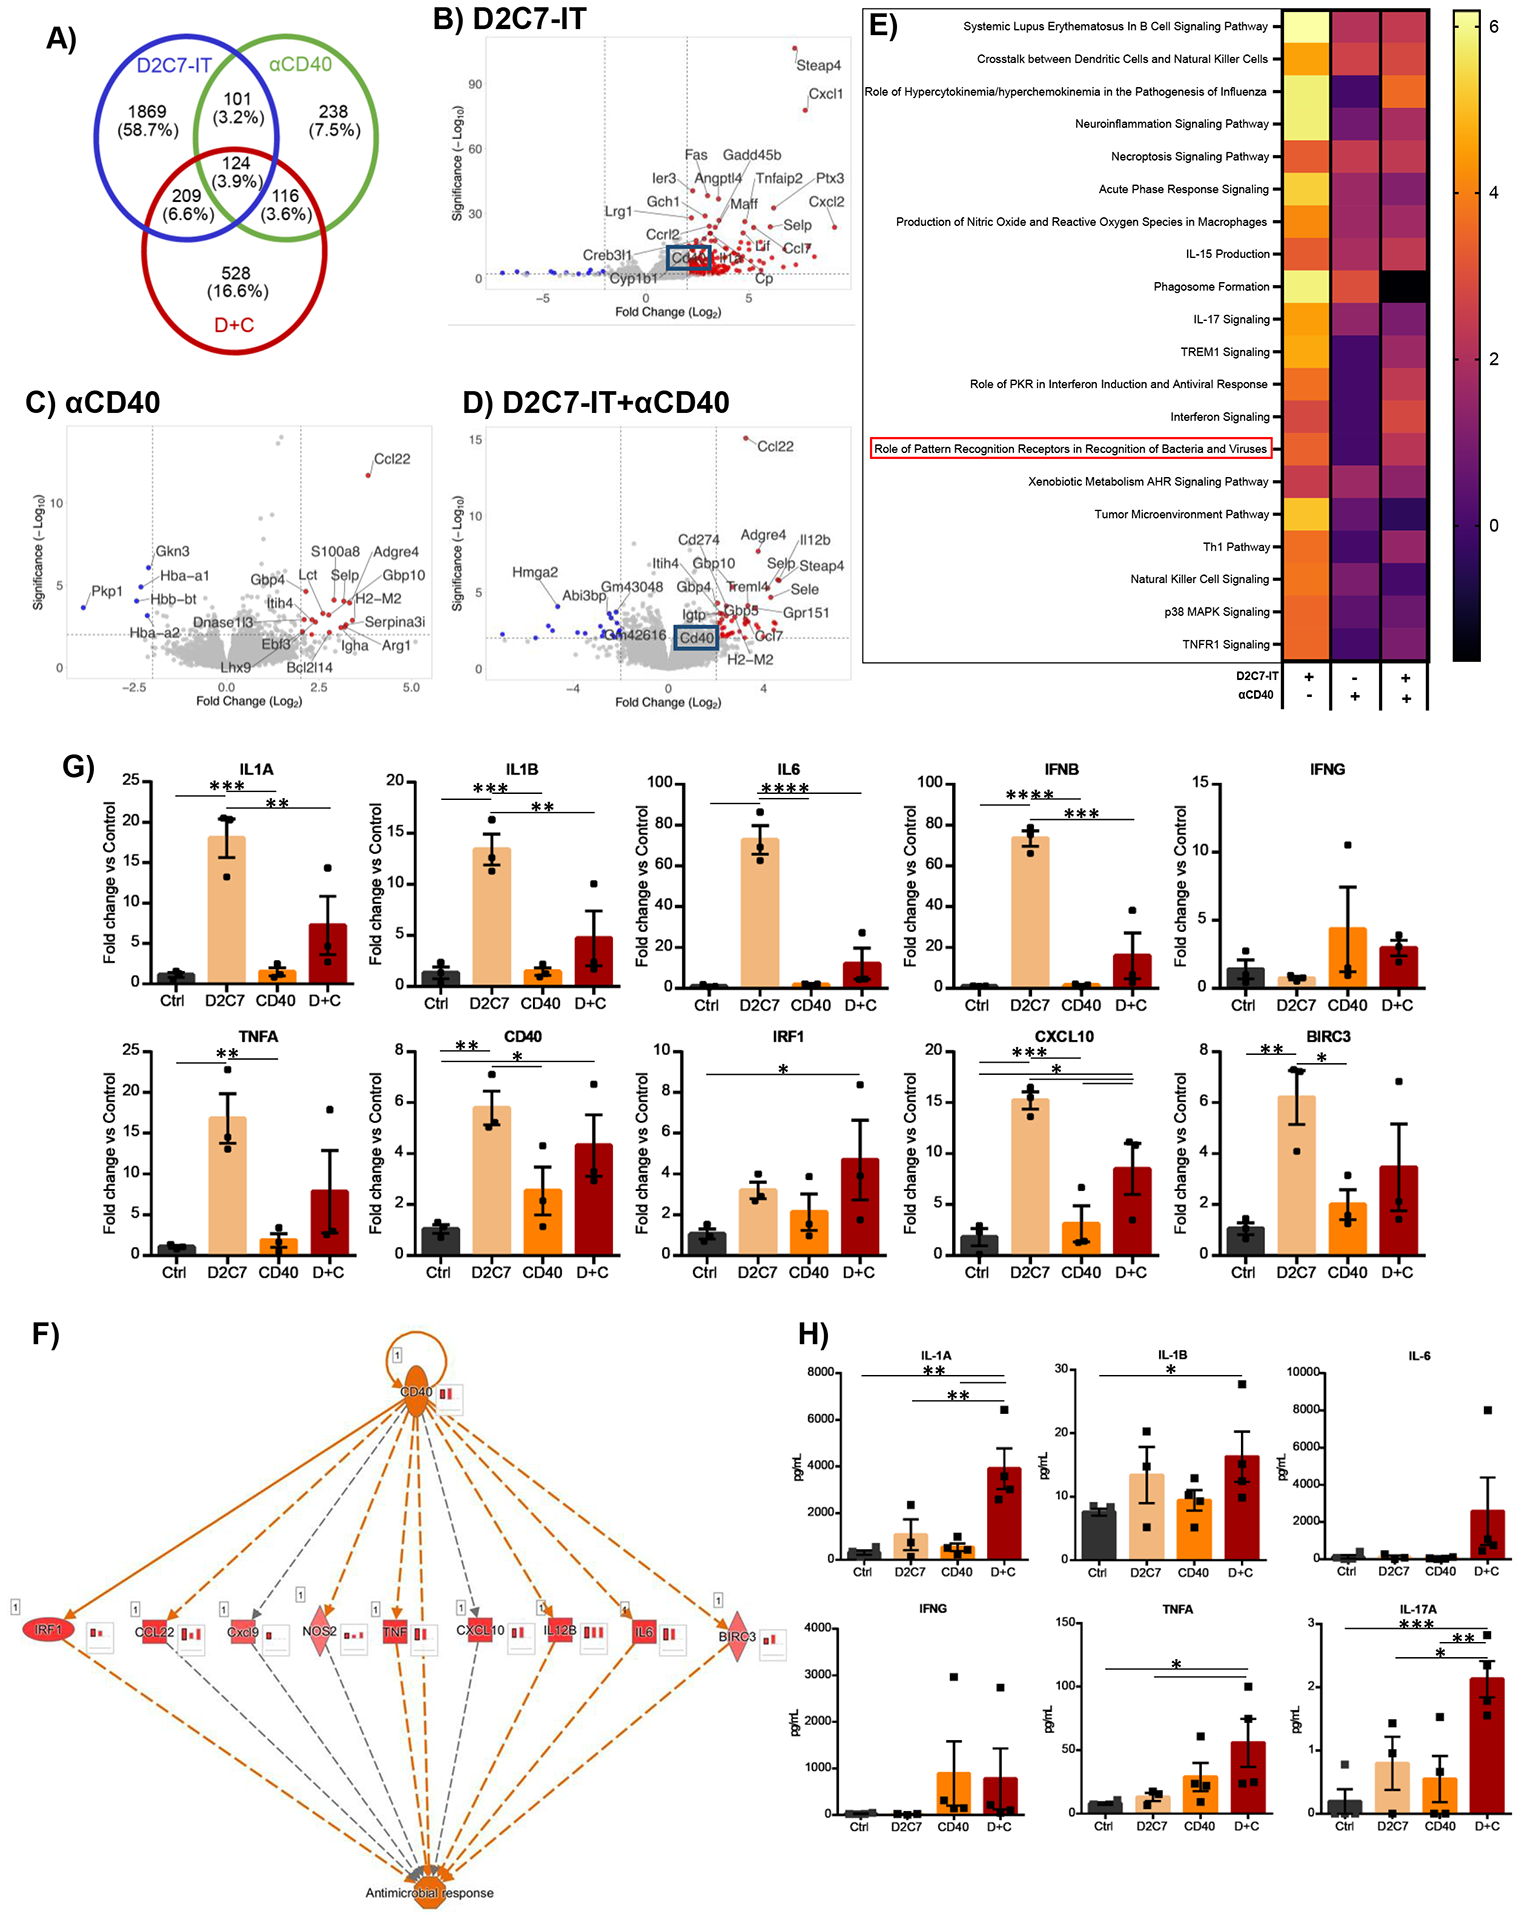
D2C7-immunotoxin (IT), a dual-specific IT targeting wild-type epidermal growth factor receptor (EGFR) and mutant EGFR variant III (EGFRvIII) proteins, demonstrates encouraging survival outcomes in a subset of patients with glioblastoma. We hypothesized that immunosuppression in glioblastoma limits D2C7-IT efficacy. To improve the response rate and reverse immunosuppression, we combined D2C7-IT tumor cell killing with αCD40 costimulation of antigen-presenting cells. In murine glioma models, a single intratumoral injection of D2C7-IT+αCD40 treatment activated a proinflammatory phenotype in microglia and macrophages, promoted long-term tumor-specific CD8+ T cell immunity, and generated cures. D2C7-IT+αCD40 treatment increased intratumoral Slamf6+CD8+ T cells with a progenitor phenotype and decreased terminally exhausted CD8+ T cells. D2C7-IT+αCD40 treatment stimulated intratumoral CD8+ T cell proliferation and generated cures in glioma-bearing mice despite FTY720-induced peripheral T cell sequestration. Tumor transcriptome profiling established CD40 up-regulation, pattern recognition receptor, cell senescence, and immune response pathway activation as the drivers of D2C7-IT+αCD40 antitumor responses. To determine potential translation, immunohistochemistry staining confirmed CD40 expression in human GBM tissue sections. These promising preclinical data allowed us to initiate a phase 1 study with D2C7-IT+αhCD40 in patients with malignant glioma (NCT04547777) to further evaluate this treatment in humans.


Conflict of interest statement

P.D. is an employee of Cytek Biosciences, Inc. V.C., D.D.B., and I.H.P. are inventors on patent application (DU6879US; Immunotherapy with combination therapy comprising an Immunotoxin) licensed to Vimana. D.D.B. serves as a consultant for Istari Oncology and Vimana. L.S.P. is currently an employee of Tune Therapeutics, Inc. A.B. is presently an employee of Xilis. A.M.S. is currently an employee of Immorna. T.F.T. is the founder of Cellective Biotherapy, Inc. and Antigenomycs, Inc., not related to the present work. A.D. serves as an advisory board member for Orbus Therapeutics and Midatech Pharma, served on the advisory board of Istari Oncology within the last two years, receives clinical research support (to the institution) from Orbus Therapeutics and Midatech Pharma, and has stock options with Istari Oncology. D.M.A. serves as an advisory board member for Immunogenesis, MAIA Biotechnology, and Diverse Biotech and a consultant for Jackson Laboratories. M.D.G. serves as an advisory board member for Myeloid Therapeutics. D.A.K. serves as an expert consultant for Shoreline Biosciences, not related to the present work. S.K.N. is a member of the Pfizer mRNA advisory panel, an inventor on patents licensed to Istari Oncology and Vimana, and a co-founder of NanoVenari Technologies, LLC. The other authors declare that they have no competing interests.

Figures

Fig. 1.
Fig. 1.. Intratumoral D2C7 and αCD40 combination elicit robust antitumor immunity in orthotopic glioma models.
(A) Survival of C57BL/6J mice implanted with CT-VIII (N=10/group) cells and treated with Ctrl, D2C7, αCD40, or D+C as indicated. (B) Treated mice from A that experienced complete tumor regression for >75-d, were rechallenged with the CT-2A tumor cells. Tumor naïve mice (n=7) served as controls. (C) Survival of mice implanted with GL-VIII (n=5/group) cells and treated with Ctrl, D2C7, αCD40, or D+C as indicated. (D) Treated mice from C that experienced complete tumor regression for >83-d, were rechallenged with the GL261 tumor cells. Tumor naïve mice (n=5) served as controls. (E-H and J-M) Representative images of H&E stained tumor sections from CT-VIII (E-H) brains (n=6–7/group, harvested 6–7-d post-therapy) and GL-VIII (J-M) brains (n=3/group, harvested 6-d post-therapy), treated with control (E, J), D2C7 (F, K), αCD40 (G, L), or D+C (H, M). Scale bar: 600 μm. (I and N) Percentage compositions of tumor cells of entire CT-VIII (I) and GL-VIII (N) tumor section cohorts from E-H and J-M are presented. Data are mean ± SEM. *P<0.05, **P<0.01, ***P<0.001, ****P<0.0001. BLI, Bioluminescence imaging.
Fig. 2.
Fig. 2.. D2C7+αCD40 therapy is antigen-dependent and demonstrates local and systemic antitumor immunity.
(A) Survival of CT-VIII+CT-2A tumor-bearing mice (n=10/group) treated with Ctrl, D2C7, αCD40, or D+C as indicated. (B) Survival of CT-VIII tumor-bearing mice (n=5/group) treated with Ctrl, D2C7, αCD40, or D+C as indicated in a model of metastatic cancer. (C-D) Representative H&E images of tumor sections from CT-VIII contralateral tumors (N=4–5/group), treated with control (C) or D+C (D) harvested 7-d post-therapy. Scale bar: 600 μm. (E) Percentage composition of tumor cells of entire tumor section cohort from C and D. Data are mean ± SEM. (F) Survival of parental CT-2A tumor-bearing mice (n=9–10/group) treated with Ctrl, D2C7, αCD40, or D+C as indicated. *P<0.05, **P<0.01.
Fig. 3.
Fig. 3.. D+C therapy promotes antitumor phenotype in intratumoral microglia and macrophages.
CT-VIII tumors were treated from days 6–9 after implantation by CED with Ctrl, D2C7, αCD40, and D+C therapies (n=4–5/group). 6-d post treatment, tumor hemispheres were harvested and analyzed by flow cytometry (A-H) or whole brains were collected for IHC staining (I-X). (A-D) Relative frequencies of neutrophils (A), natural killer cells (B), microglia (C), and macrophages (D) are presented. Data are mean ± SEM. (E-H) Expression of CD80 and MHCII (IA-IE) on microglia (E and F) and macrophages (G and H) are presented. (I-X) Representative IHC images of Control (I-L), D2C7 (M-P), αCD40 (Q-T), and D+C (U-X) stained with control, CD68, TNFα, or CD206 Abs. Scale bar: 30 μm. *P<0.05
Fig. 4.
Fig. 4.. CD8+ T cells mediate D+C antitumor response in gliomas.
(A) FC analysis of CD4+, CD8+ T cells and B cells in CT-VIII tumor-bearing mice, 6-days post Ctrl, D2C7, αCD40, and D+C therapies (n=4/group). Data are mean ± SEM. (B-Q) Representative IHC images from CT-VIII tumors 7-d post-therapy, Control (B-E), D2C7 (F-I), αCD40 (J-M), and D+C (N-Q), stained with control, CD4, CD8, or CD19 Abs. Scale bar: 50 μm. (R) Survival of CT-VIII tumor-bearing mice (n=9–10/group) treated with Ctrl or D+C therapy with or without CD4, CD8, or B cell depletion beginning at day 2 post implantation. (S) Treated mice from (R) that experienced complete tumor regression for >75-d, were rechallenged with the CT-2A tumor cells. Tumor naïve mice (n=9) served as controls. The single CD8-depleted mouse was excluded from comparative analysis. *P<0.05, **P<0.01, ***P<0.001, ****P<0.0001.
Fig. 5.
Fig. 5.. D2C7+αCD40 therapy prevents CD8+ T cell exhaustion in gliomas.
CT-VIII (A, C, E) or GL-VIII (B, D, F) tumors were treated from days 6–9 after implantation by CED with Ctrl, D2C7, αCD40, and D+C therapies (n=4/group). Tumor hemispheres harvested 6-d post treatment were analyzed by flow cytometry. Data are mean ± SEM. (A-B) Frequencies of CD8+ T cells with central memory (Tcm: CD3+CD8+CD62L+CD44+) or effector memory (Tem: CD3+CD8+CD62LCD44+) phenotype are presented. (C-D) Frequencies of CD8+ Tem cells expressing PD-1 only or multiple exhaustion markers (PD-1/TIGIT/Tim-3/Lag-3) are presented. (E-F) Frequencies of CD8+ Tem cells classified into specific exhaustion subsets based on Ly108+ and CD69+ expression are presented. *P<0.05, **P<0.01, ***P<0.001, ****P<0.0001.
Fig. 6.
Fig. 6.. Pre-existing intratumoral T cells facilitate D+C antitumor response against gliomas.
(A) Survival of CT-VIII tumor mice (n=10/group) treated with control or D+C therapy with or without FTY as indicated. (B) FC analysis of CD8+ T cells in day 0 blood (pre-tumor), day 6 blood (post-tumor), day 13 blood and brain (post-tumor) from CT-VIII tumor-bearing mice (n=4/group) treated as in 5A. Data are mean ± SEM. (C-F) Representative IF images of tumor sections from CT-VIII tumors (n=4/group), treated as in 5A and harvested 7-d post-therapy, stained for DAPI (nucleus, blue), CD8+ T cells (red), and Ki-67 (green) proliferation marker. The CD8+Ki-67+ cell frequency by QMIF analysis post indicated treatment is presented. Scale bar: 200 μm. *P<0.05, **P<0.01, ***P<0.001, ****P<0.0001.
Fig. 7.
Fig. 7.. D2C7+αCD40 therapy increases functional and tumor antigen-specific CD8+ TILs in WT mice and loses antitumor efficacy in cDC1-lacking Batf3−/− mice bearing gliomas.
(A) FC analysis of CD8+IFNγ+TNFα+Ki-67+ T cells in CT-VIII tumor-bearing C57BL/6J WT mice, 6-days post Ctrl, D2C7, αCD40, and D+C therapies (n=2–4/group). (B) IFNγ ELISpot analysis performed on TILs harvested from CT-VIII-Trp2 tumors from C57BL/6J WT mice 6-days post-Ctrl, D2C7, CD40, and D+C therapies (n=3–6/group) stimulated with Trp2180–188 peptide. Background response from irrelevant peptide stimulation (< ~4 IFNγ spot forming units [SFUs]) subtracted from all plotted results. (C) Representative images of wells containing leukocytes isolated from Ctrl, D2C7, CD40, and D+C treated brains from C57BL/6J WT mice, and the IFNγ SFU observed following stimulation with Trp2180–188. (D) Survival of Batf3−/− (KO) mice implanted with CT-VIII (n=10/group) cells and treated with Ctrl, D2C7, αCD40, or D+C as indicated. (E-F) Frequencies of CD8+ T cells with central memory (Tcm) or effector memory (Tem) phenotype (E) and CD8+ Tem cells classified into specific exhaustion subset based on Ly108+ and CD69+ expression (F) in CT-VIII tumor hemispheres harvested 6-days post control or D+C therapy in WT and KO mice by FC analysis. *P<0.05, **P<0.01, ***P<0.001, ****P<0.0001. Data are mean ± SEM.
Fig. 8.
Fig. 8.. D2C7 and D+C therapies instigate proinflammatory transcriptional and cytokine changes in the tumor microenvironment in the CT-VIII glioma model.
(A) Venn diagram of differentially expressed genes (up- and down-regulated compared to control group) in D2C7, αCD40, and D+C groups by RNA-Seq analysis of CT-VIII gliomas post 72 hr CED (n=3/group). (B-D) Volcano plots depicting the log2(fold change) in gene expression in D2C7 (B), αCD40 (C), and D+C (D) treated versus control tumors post 72 hr CED. Top 25 differentially expressed with P<0.05 are shown in red (upregulated) and blue (down-regulated). (E-F) Heatmap of z-scores of Top 20 IPA Canonical Pathway (E) and IPA CD40 regulatory network (F) gene transcripts in D2C7, αCD40, and D+C treated versus control tumors post 72 hr CED. The red bar charts in insets next to each gene represent the amount of activation in D+C (left), D2C7(middle), and αCD40 (right) treated versus control tumors post 72 hr CED. (G) The qPCR gene expression analysis of D2C7, αCD40, and D+C treated versus Ctrl tumors post 72 hr CED (n=3/group) in CT-VIII model. Data indicate the mean fold change over control after normalization to the average of ACTB housekeeping gene. (H) Cytokine concentrations in tumor lysates of D2C7, αCD40, and D+C treated versus Ctrl tumors post 72 hr CED (n=3–4/group) in CT-VIII model. *P<0.05, **P<0.01, ***P<0.001, ****P<0.0001. Data are mean ± SEM.

References

    1. Ostrom QT, Patil N, Cioffi G, Waite K, Kruchko C, Barnholtz-Sloan JS, CBTRUS Statistical Report: Primary Brain and Other Central Nervous System Tumors Diagnosed in the United States in 2013–2017. Neuro Oncol 22, iv1–iv96 (2020). - PMC - PubMed
    1. Stupp R, Mason WP, van den Bent MJ, Weller M, Fisher B, Taphoorn MJ, Belanger K, Brandes AA, Marosi C, Bogdahn U, Curschmann J, Janzer RC, Ludwin SK, Gorlia T, Allgeier A, Lacombe D, Cairncross JG, Eisenhauer E, Mirimanoff RO, European Organisation for R, Treatment T of Cancer Brain, G. Radiotherapy, G. National Cancer Institute of Canada Clinical Trials, Radiotherapy plus concomitant and adjuvant temozolomide for glioblastoma. N Engl J Med 352, 987–996 (2005). - PubMed
    1. Fernandes C, Costa A, Osorio L, Lago RC, Linhares P, Carvalho B, Caeiro C, in Glioblastoma, De Vleeschouwer S, Ed. (Codon Publications, 2017). - PubMed
    1. Cloughesy TF, Mochizuki AY, Orpilla JR, Hugo W, Lee AH, Davidson TB, Wang AC, Ellingson BM, Rytlewski JA, Sanders CM, Kawaguchi ES, Du L, Li G, Yong WH, Gaffey SC, Cohen AL, Mellinghoff IK, Lee EQ, Reardon DA, O’Brien BJ, Butowski NA, Nghiemphu PL, Clarke JL, Arrillaga-Romany IC, Colman H, Kaley TJ, de Groot JF, Liau LM, Wen PY, Prins RM, Neoadjuvant anti-PD-1 immunotherapy promotes a survival benefit with intratumoral and systemic immune responses in recurrent glioblastoma. Nat Med 25, 477–486 (2019). - PMC - PubMed
    1. Desjardins A, Gromeier M, Herndon JE 2nd, Beaubier N, Bolognesi DP, Friedman AH, Friedman HS, McSherry F, Muscat AM, Nair S, Peters KB, Randazzo D, Sampson JH, Vlahovic G, Harrison WT, McLendon RE, Ashley D, Bigner DD, Recurrent Glioblastoma Treated with Recombinant Poliovirus. N Engl J Med 379, 150–161 (2018). - PMC - PubMed

Publication types

Associated data