. 2023 Apr 20;35(5):1496-1512.
doi: 10.1093/plcell/koad033.

Cortical microtubules contribute to division plane positioning during telophase in maize

Affiliations

Cortical microtubules contribute to division plane positioning during telophase in maize

Marschal A Bellinger et al. Plant Cell. .

Abstract

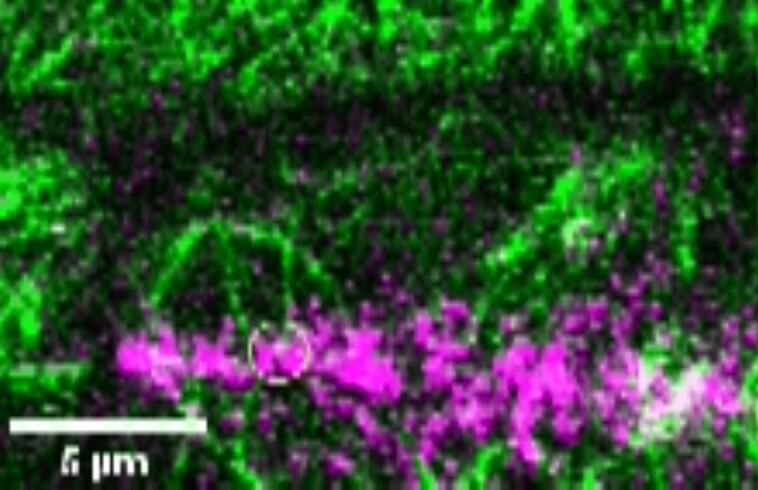
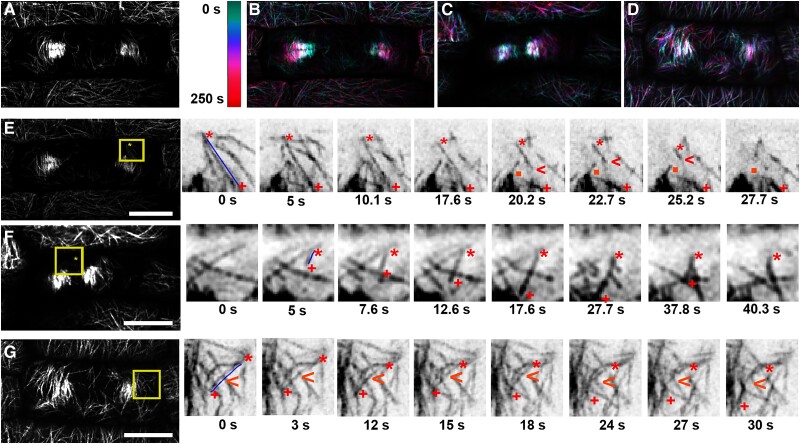
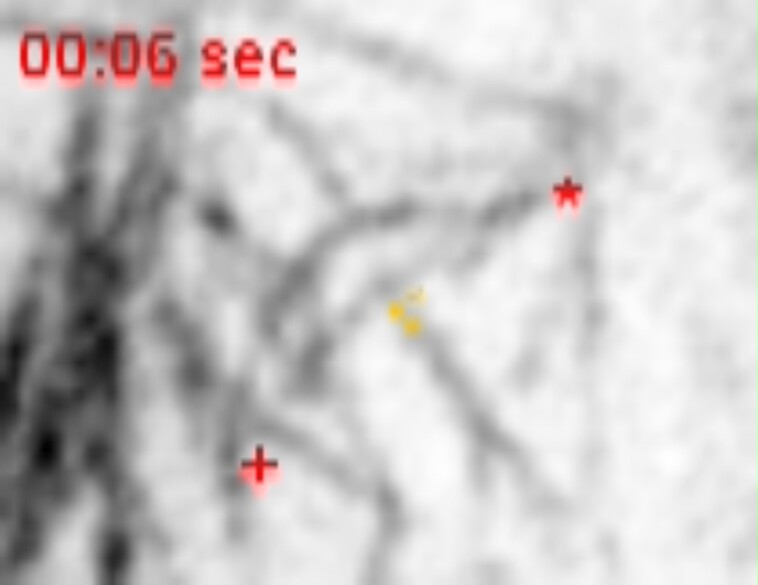
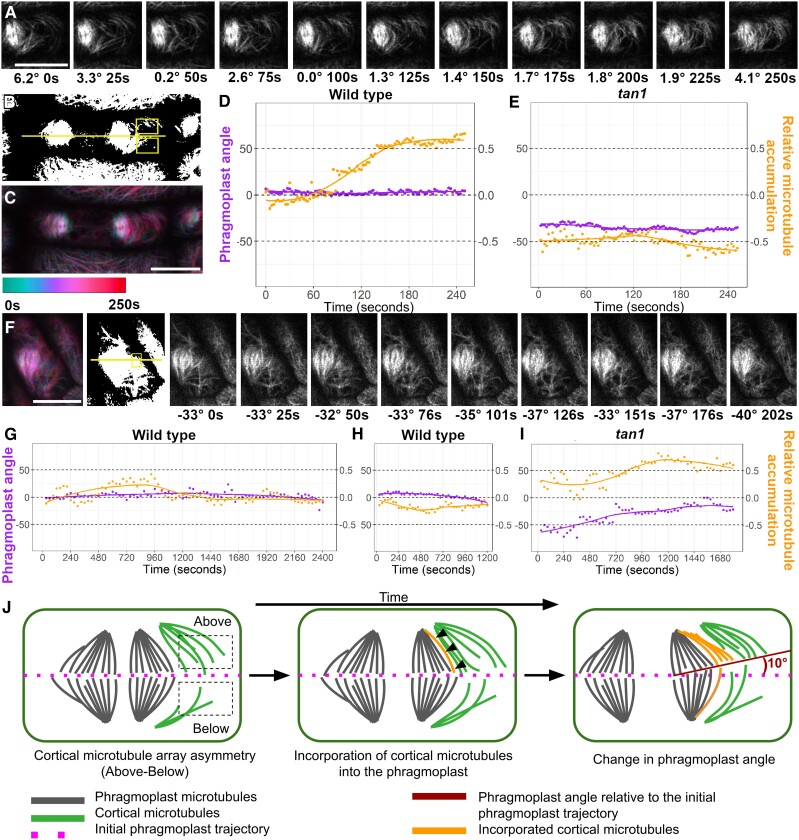
Cell divisions are accurately positioned to generate cells of the correct size and shape. In plant cells, the new cell wall is built in the middle of the cell by vesicles trafficked along an antiparallel microtubule and a microfilament array called the phragmoplast. The phragmoplast expands toward a specific location at the cell cortex called the division site, but how it accurately reaches the division site is unclear. We observed microtubule arrays that accumulate at the cell cortex during the telophase transition in maize (Zea mays) leaf epidermal cells. Before the phragmoplast reaches the cell cortex, these cortical-telophase microtubules transiently interact with the division site. Increased microtubule plus end capture and pausing occur when microtubules contact the division site-localized protein TANGLED1 or other closely associated proteins. Microtubule capture and pausing align the cortical microtubules perpendicular to the division site during telophase. Once the phragmoplast reaches the cell cortex, cortical-telophase microtubules are incorporated into the phragmoplast primarily by parallel bundling. The addition of microtubules into the phragmoplast promotes fine-tuning of the positioning at the division site. Our hypothesis is that division site-localized proteins such as TANGLED1 organize cortical microtubules during telophase to mediate phragmoplast positioning at the final division plane.


Conflict of interest statement

Conflict of interest statement. None declared.

Figures

Figure 1.
Figure 1.
Cortical-telophase microtubules accumulate at the cortex before the phragmoplast contacts the cortex in wild-type maize epidermal cells. Times are indicated in hours:minutes:seconds at the bottom left corner. A) Time-lapse imaging of a cell expressing YFP-TUBULIN from metaphase to telophase. Microtubules at the cortex (top panel), microtubules at the midplane (middle panel), and merged images (cortex: green and midplane: magenta; bottom panel) are shown. Cortical-telophase microtubules faintly accumulate at 14:11, with more accumulating by 29:16; additional intermediary timepoints are shown in Supplemental Fig. S1. B) Time-lapse imaging of microtubules from anaphase to telophase. Merged images (cortex: green, and cell plate and plasma membrane dyed with FM-4-64: magenta). X–Z projections show that the cortical-telophase arrays accumulate before the phragmoplast reaches the cell cortex. Bar is 10 µm for X–Y images and ∼10 µm for the X–Z projection (estimated due to sample drift). Images were acquired using a Zeiss LSM 880 equipped with Airyscan at 100× (NA = 1.46).
Figure 2.
Figure 2.
Cortical-telophase microtubules are typically abundant and arranged toward the division site in wild-type cells but are more variable in abundance and organization in tan1 mutant cells. A) A wild-type maize epidermal cell with abundant cortical-telophase microtubules (far left), tan1 mutant cells with abundant (left), asymmetric (middle), or sparse cortical-telophase microtubules (right). Merged images show a midplane view (magenta) and cortex view (green). X–Z shows the X–Z projection, with orange arrowheads indicating cortical microtubules at the top of the cell. B) Cortical-telophase microtubule array anisotropy, n = 38 wild-type arrays (19 cells from 5 plants) and 50 tan1 arrays (25 cells from 9 plants) with median and quartiles indicated by black bars (2-tailed Mann–Whitney U test P-value = 0.005). Schematic diagrams of cells with high and low anisotropy (right). C) Histogram of the average microtubule orientation of the cortical-telophase microtubule array (n = 38 arrays for wild-type and 50 for tan1 mutant cells, 2-tailed Mann–Whitney U test comparing angle values, P value <0.001). Schematic diagram showing angle measurements compared to the division site, D) Relative cortical-telophase coverage, represented as a fraction, was significantly higher in wild-type (38 arrays) than tan1 (54 arrays) cells, 2-tailed Mann–Whitney U test, median and quartiles are indicated with black bars (P value <0.0001). Schematic diagrams with examples of high and low microtubule coverage. Micrographs were taken under a Zeiss LSM 880 (Airyscan,100×, NA = 1.46). Bars are 10 µm.
Figure 3.
Figure 3.
Cortical-telophase microtubules pause at the division site near TAN1 puncta. A) and B) Time-lapse images of cortical-telophase microtubules (YFP-TUBULIN, green) pausing at the division site (top panels) or passing (bottom panels) through the division site ahead of the phragmoplast in wild-type (WT) A) and tangled1 (tan1) B) cells. Red arrowheads indicate the microtubule plus end. Dotted lines in time-lapse insets mark the division site, as predicted through the extension of FM4-64 cell plate staining (magenta). The scale bar is 10 µm and 5 µm in insets. C) Dot plot of microtubule pause times (s) at division site and other cortex locations in wild type and tan1. Bars represent median with interquartile range. D) Time-lapse images of a wild-type cell cortex with cortical-telophase microtubules and cortical TAN1 localization. Cortical-telophase microtubules ahead of the phragmoplast pause at the division site with no TAN1 puncta (i, top panel) and at the division site with TAN1-puncta (ii, bottom panel). Microtubules are labeled with CFP-TUBULIN (green) and TAN1 by TAN1-YFP (magenta). Arrowheads indicate the respective microtubule plus end. The scale bar is 10 microns and 1 micron in insets. E) Dot plot comparing microtubule pause times(s) at division site locations with or without TAN1 puncta in wild-type cells expressing TAN1-YFP. Each dot represents one microtubule pause time. Error bars are median with interquartile range. P-values ns not significant, * < 0.05, ** < 0.01, *** < 0.001 by Kruskal–Wallis and Dunn's test. Images were acquired using a Zeiss LSM 880 equipped with Airyscan with a 100× (NA = 1.46) lens.
Movie 1.
Movie 1.
Time-lapse imaging of cortical-telophase microtubules interacting with the future division site.
Movie 2.
Movie 2.
Time-lapse imaging of a cortical-telophase microtubule interacting with TAN1-YFP puncta.
Figure 4.
Figure 4.
Time-lapse images of cortical-telophase microtubules interacting with the phragmoplast using YFP-TUBULIN to label microtubules. A) A single early snapshot of a maize dividing cell during telophase with surrounding interphase cells. B) Color-coded time projection showing the movement of the phragmoplast and cortical-telophase microtubules of the cell in A). C) Time projection of cell in F), D) time projection of cell in G). E) The cell shown in A) at a later time point. Representative example of severing leading to the incorporation of a cortical-telophase microtubule into the phragmoplast. Microtubules of interest are indicated with an adjacent blue line; red asterisks indicate the cortical-telophase microtubule minus ends and red pluses indicate the microtubule plus end. Red arrowheads show severing followed by depolymerization. The orange square marks the new microtubule minus end after severing. F) Representative example of depolymerization of a cortical-telophase microtubule following contact with the phragmoplast. G) Representative bundling of a cortical-telophase microtubule into the phragmoplast. Orange arrowheads show a cortical-telophase microtubule incorporated into the phragmoplast by parallel bundling. Bars are 5 µm, Time (s) rounded to a 10th of a second. Images were acquired using a Zeiss LSM 880 equipped with Airyscan with a 100× (NA = 1.46) lens.
Movie 3.
Movie 3.
Time-lapse imaging of a YFP-TUBULIN labeled cortical-telophase microtubule bundling into the phragmoplast.
Movie 4.
Movie 4.
Time-lapse imaging of a YFP-TUBULIN labeled cortical-telophase microtubule bundling into the phragmoplast.
Movie 5.
Movie 5.
Time-laspse imaging of a YFP-TUBULIN labeled cortical-telophase microtubule incorporation into the phragmoplast and severing.
Movie 6.
Movie 6.
Time-lapse imaging of a YFP-TUBULIN labeled cortical-telophase microtubule contacting the phragmoplast, then depolymerizing.
Figure 5.
Figure 5.
Long-term uneven accumulation of cortical-telophase microtubules is correlated with changes in phragmoplast direction. A) to D) A wild-type phragmoplast: A) Time-lapse imaging with phragmoplast angle relative to the division site and time (s) indicated below. Time-lapse images were acquired using a Zeiss LSM 880 with Airyscan (100×, NA = 1.46) or a Yokogawa spinning disk with a Nikon stand (100×, NA 1.45). B) Thresholded image with ROI (yellow rectangles) selected to measure relative cortical-telophase microtubule accumulation above and below the phragmoplast. The phragmoplast trajectory is indicated by a yellow line. C) Time projection with time-color legend. D) Graph comparing changes in phragmoplast angle over time (purple) and relative cortical-telophase microtubule accumulation (orange) above or below the phragmoplast. E) and F) A tan1 phragmoplast E) Graph of changes in phragmoplast angle and cortical-telophase microtubule accumulation in tan1 over time. F) Time-lapse imaging of tan1; phragmoplast angle and time are shown below. G-I) Longer time lapses: G) A wild-type cell with little overall phragmoplast movement. H) Wild-type cell with consistent cortical-telophase microtubule accumulation below the phragmoplast and downward phragmoplast angle movement. I) tan1 cell with consistent cortical-telophase microtubule accumulation above the phragmoplast with phragmoplast angle movement towards the top. Bars = 10 µm. J) Model of the cell cortex of maize epidermal cells showing cortical-telophase microtubule accumulation, incorporation into the phragmoplast, and changes in the trajectory of the phragmoplast over time.

Comment in

References

    1. Abu-Abied M, Belausov E, Hagay S, Peremyslov V, Dolja V, Sadot E. Myosin XI-K is involved in root organogenesis, polar auxin transport, and cell division. J Exp Bot. 2018:69(12):2869–2881. 10.1093/jxb/ery112 - DOI - PMC - PubMed
    1. Boruc J, Weimer AK, Stoppin-Mellet V, Mylle E, Kosetsu K, Cedeño C, Jaquinod M, Njo M, De Milde L, Tompa P, et al. . Phosphorylation of MAP65-1 by Arabidopsis Aurora kinases is required for efficient cell cycle progression. Plant Physiol. 2017:173(1):582–599. 10.1104/pp.16.01602 - DOI - PMC - PubMed
    1. Boudaoud A, Burian A, Borowska-Wykręt D, Uyttewaal M, Wrzalik R, Kwiatkowska D, Hamant O. Fibriltool, an ImageJ plug-in to quantify fibrillar structures in raw microscopy images. Nat Protoc. 2014:9(2):457–463. 10.1038/nprot.2014.024 - DOI - PubMed
    1. Buschmann H, Chan J, Sanchez-Pulido L, Andrade-Navarro MA, Doonan JH, Lloyd CW. Microtubule-associated AIR9 recognizes the cortical division site at preprophase and cell-plate insertion. Curr Biol. 2006:16(19):1938–1943. 10.1016/j.cub.2006.08.028 - DOI - PubMed
    1. Buschmann H, Dols J, Kopischke S, Peña EJ, Andrade-Navarro MA, Heinlein M, Szymanski DB, Zachgo S, Doonan JH, Lloyd CW. Arabidopsis KCBP interacts with AIR9 but stays in the cortical division zone throughout mitosis via its MyTH4-FERM domain. J Cell Sci. 2015:128(11):2033–2046. 10.1242/jcs.156570 - DOI - PubMed

Publication types