. 2023 Sep 12;7(17):4705-4720.
doi: 10.1182/bloodadvances.2022009114.

Splenectomy improves erythrocyte functionality in spherocytosis based on septin abundance, but not maturation defects

Affiliations

Splenectomy improves erythrocyte functionality in spherocytosis based on septin abundance, but not maturation defects

Anne-Sophie Cloos et al. Blood Adv. .

Abstract

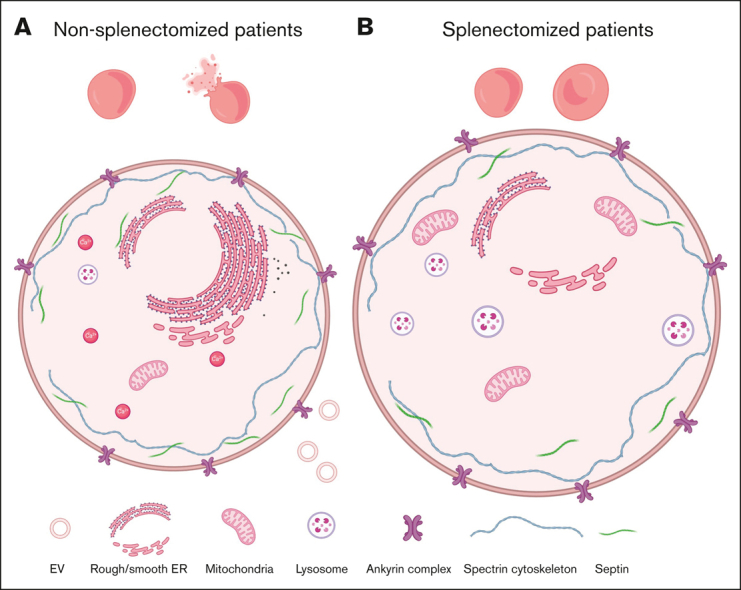
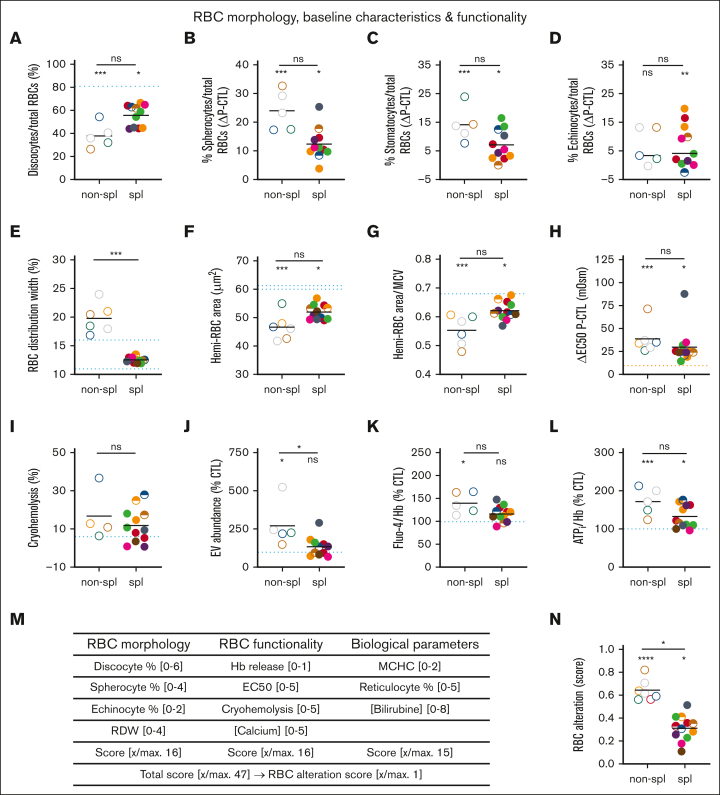
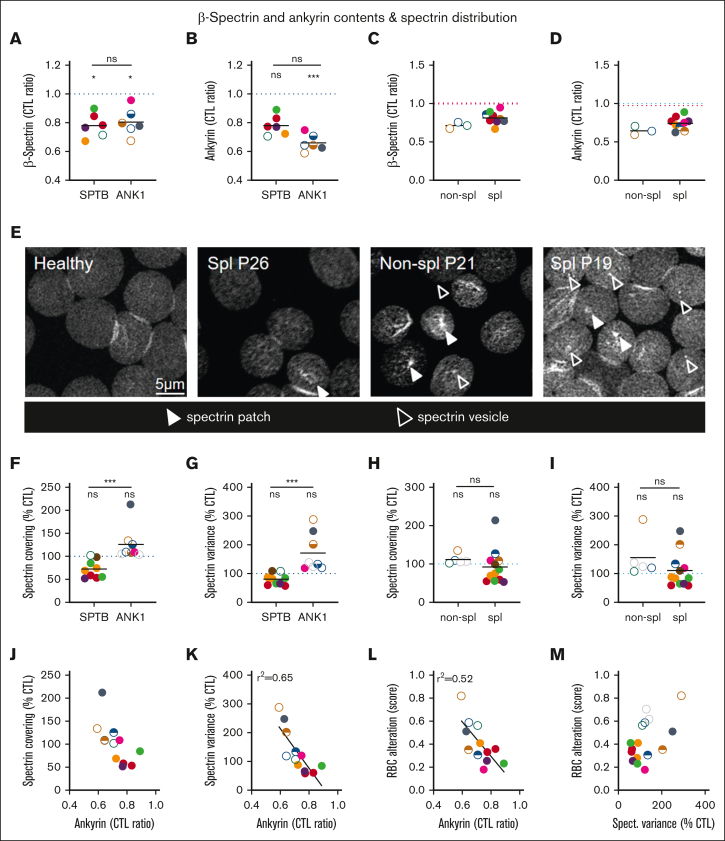
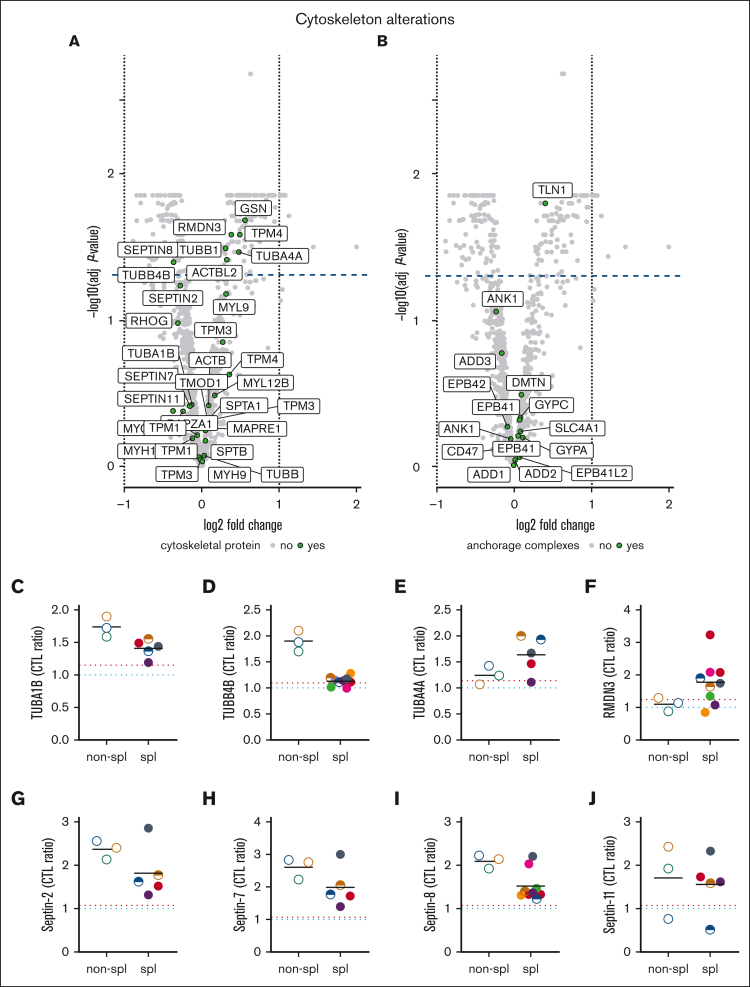
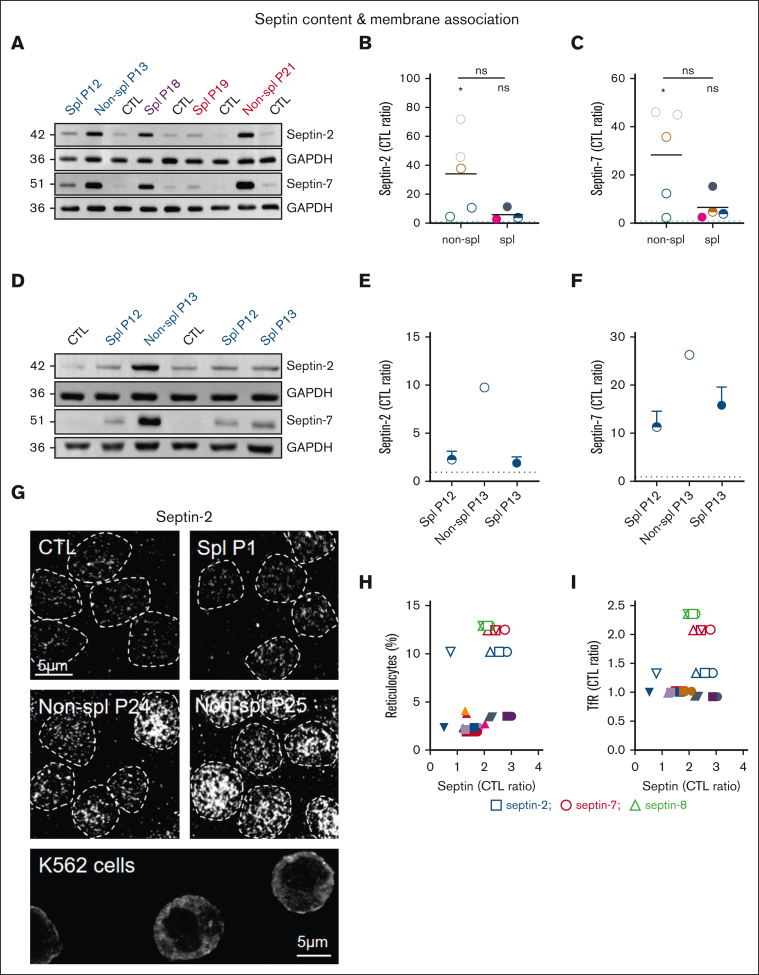
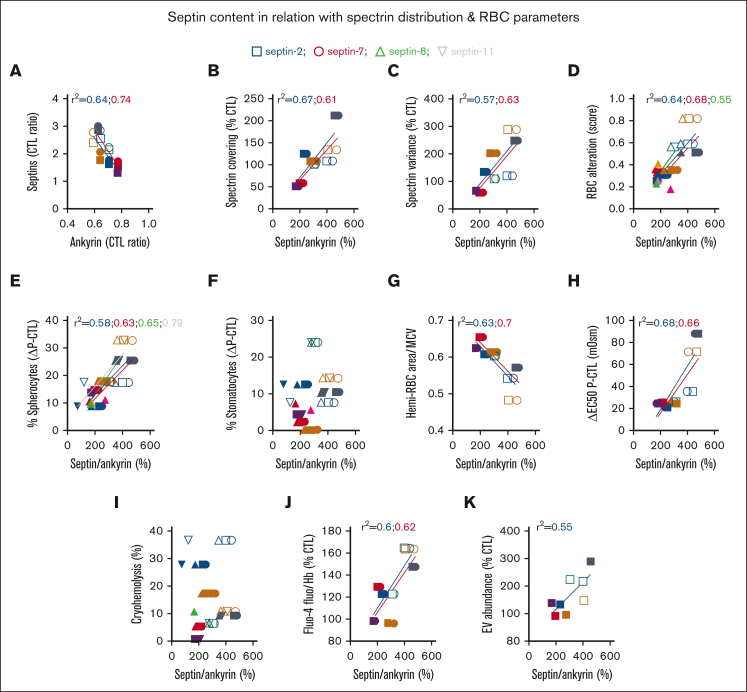
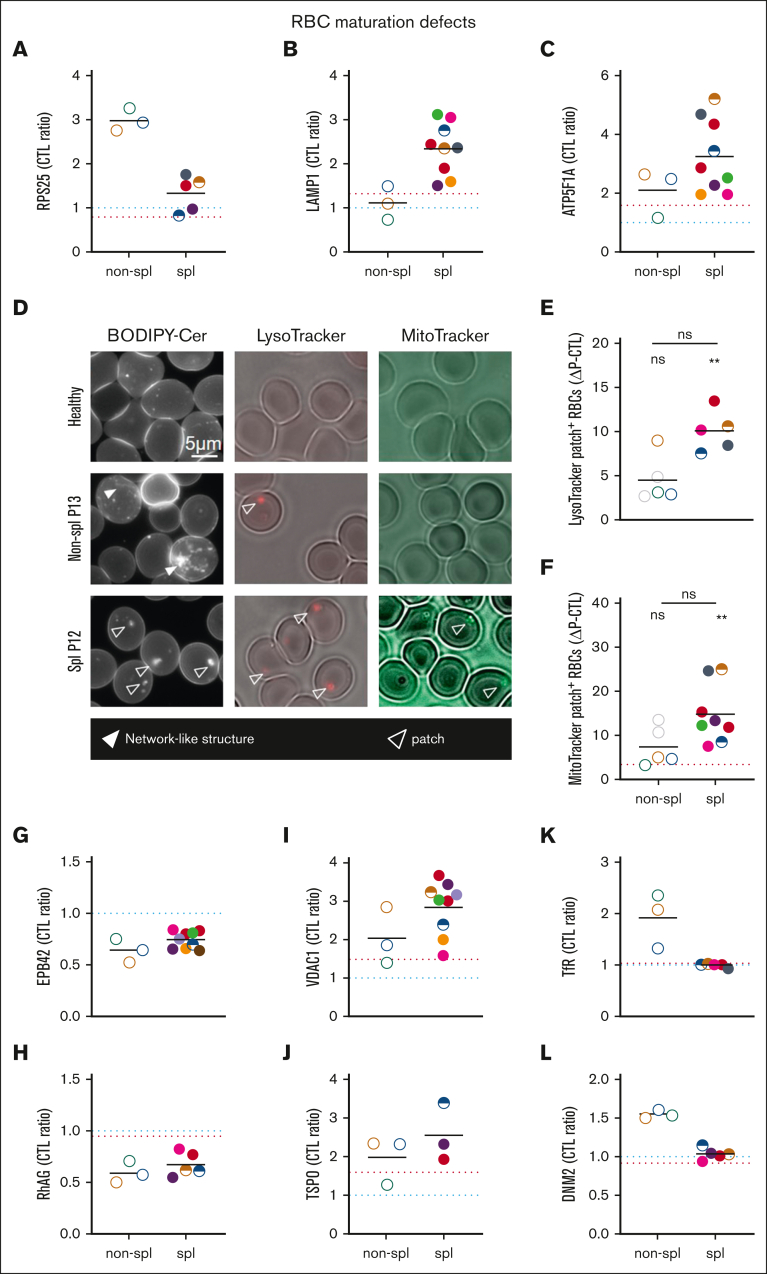
Splenectomy improves the clinical parameters of patients with hereditary spherocytosis, but its potential benefit to red blood cell (RBC) functionality and the mechanism behind this benefit remain largely overlooked. Here, we compared 7 nonsplenectomized and 13 splenectomized patients with mutations in the β-spectrin or the ankyrin gene. We showed that hematological parameters, spherocyte abundance, osmotic fragility, intracellular calcium, and extracellular vesicle release were largely but not completely restored by splenectomy, whereas cryohemolysis was not. Affected RBCs exhibited decreases in β-spectrin and/or ankyrin contents and slight alterations in spectrin membrane distribution, depending on the mutation. These modifications were found in both splenectomized and nonsplenectomized patients and poorly correlated with RBC functionality alteration, suggesting additional impairments. Accordingly, we found an increased abundance of septins, small guanosine triphosphate-binding cytoskeletal proteins. Septins-2, -7, and -8 but not -11 were less abundant upon splenectomy and correlated with the disease severity. Septin-2 membrane association was confirmed by immunolabeling. Except for cryohemolysis, all parameters of RBC morphology and functionality correlated with septin abundance. The increased septin content might result from RBC maturation defects, as evidenced by (1) the decreased protein 4.2 and Rh-associated glycoprotein content in all patient RBCs, (2) increased endoplasmic reticulum remnants and endocytosis proteins in nonsplenectomized patients, and (3) increased lysosomal and mitochondrial remnants in splenectomized patients. Our study paves the way for a better understanding of the involvement of septins in RBC membrane biophysical properties. In addition, the lack of restoration of septin-independent cryohemolysis by splenectomy may call into question its recommendation in specific cases.


Conflict of interest statement

Conflict-of-interest disclosure: The authors declare no competing financial interests.

Figures

None
Graphical abstract
Figure 1.
Figure 1.
Splenectomy partially reestablishes RBC baseline characteristics as well as RBC morphology and functionality–related parameters. (A-L) RBCs from patients (P; 1 color, 1 family), either splenectomized (spl; filled circles or semifilled circles for intrafamily comparison) or not (nonspl; open circles), and RBCs from healthy controls (CTLs; light and dark blue dotted lines for child and adult donor ranges, respectively; or subtraction from P values [ΔP–CTL]) were compared for morphology (A-D), baseline characteristics (E-G), and functionality (H-L). (M-N) Based on these different parameters, a RBC alteration score was calculated. Statistics are indicated above the patient cohorts for the comparison with CTL values and above a horizontal line for comparison between the 2 patient cohorts, respectively. (A-D) RBC morphology determined by electron or light microscopy on RBCs in suspension. The relative abundance of discocytes (A), spherocytes (B), stomatocytes (C), and echinocytes (D) was evaluated and expressed as percentage of the global RBC population (mean of 1-5 independent experiments per patient; Kruskal-Wallis tests followed by Dunn post hoc for the comparison of the 3 cohorts). (E) RBC distribution width (mean of 1-7 independent measurements per patient; Mann-Whitney tests to compare the 2 patient cohorts). (F-G) Hemi-RBC membrane area and area-to–mean corpuscular volume (MCV) ratio. (F) Hemi-area of RBCs spread on poly-L-Lysine (PLL)–coated coverslips. (G) Ratio of values provided in panel F to the MCV provided in supplemental Figure 1G (mean of 4-23 independent measurements per patient for panel F; Kruskal-Wallis tests followed by Dunn post hoc for the comparison of the 3 cohorts). (H) RBC osmotic fragility determined in increasingly hypotonic media. The osmolarity required to lyse 50% of RBCs (Half maximal effective concentration [EC50]) was calculated using hemolysis curves (mean of 1-5 independent experiments per patient; Kruskal-Wallis test followed by Dunn post hoc). (I) RBC cryohemolysis (mean of 1-6 independent experiments per patient; Mann-Whitney test). (J) EV abundance in plasma samples determined by Nanoparticle tracking analysis (mean of 1-3 independent experiments per patient; Kruskal-Wallis test followed by Dunn post hoc). (K) Intracellular calcium content. RBCs were labeled with the nonfluorescent Fluo4-AM, which is transformed in RBCs into the fluorescent Fluo4 after de-esterification and interaction with calcium ions. Labeled RBCs were analyzed by fluorimetry, and data were normalized to the Hb content (mean of 1-11 independent experiments per patient; Kruskal-Wallis test followed by Dunn post hoc). (L) Intracellular ATP content determined with a kit based on the activity of the firefly luciferase in the presence of ATP and emitted light in the presence of luciferin. ATP levels were normalized to Hb (mean of 1-8 independent experiments/patient; Kruskal-Wallis test followed by Dunn post hoc. (M) RBC morphology, functionality and biological parameters considered to establish the RBC functionality alteration score. These parameters were associated with a scale ranging from 0 to 1 when the parameter was nearly unaffected for most patients or from 0 up to maximum 8 when different degrees of affection for a parameter were observed in patient cohorts. The different scores corresponding to the different parameters were then added and the sum divided by the maximal score that could have been obtained to determine the RBC global functionality alteration score for each patient. The closer the score to 1, the more affected the RBCs by the disease. (N) RBC alteration score (Kruskal-Wallis tests followed by Dunn post hoc). MCHC, mean corpuscular Hb concentration; ns, not significant; RDW, red cell distribution width.
Figure 2.
Figure 2.
The ANK1 content and the SPT membrane distribution are differentially affected by the mutation but not by splenectomy and inversely and slightly correlate together and with the RBC alteration score. RBCs from patients, either spl (filled circles or semifilled circles for intrafamily comparison) or nonspl (open circles), and RBCs from CTLs (dark blue dotted line, CTL ratio or % CTL) or a healthy spl adult donor (red dotted line) were compared for SPTB and ANK1 content (A-D) and membrane SPTB coverage and heterogeneity (E-I). Statistics are indicated above the patient cohorts for the comparison with CTL values and above a horizontal line for comparison between the 2 patient cohorts. (A-D) SPTB and ANK1 membrane association evaluated by mass spectrometry on ghosts (2 independent experiments; see Figure 3 for volcano plots). Data are presented based on either mutation (A-B) or splenectomy (C-D). (E-I) SPT occupancy and heterogeneity. RBCs were spread onto PLL-coated coverslips and SPT was immunolabeled and observed via confocal microscopy. (E) Representative images (filled arrowhead, SPT-enriched patch; open arrowhead, SPT-enriched vesicle). Scale bar, 5 μm. In panels F-I, SPT occupancy was normalized to RBC membrane area (means of 2-7 independent experiments per patient; Kruskal-Wallis tests followed by Dunn post hoc). Data are presented based on either mutation (F-G) or splenectomy (H-I). (J-K) Relations between the ANK1 levels and the SPT coverage and variance. (L-M) Relations between the RBC alteration score from Figure 1N and the ANK1 levels or the SPT variance.
Figure 3.
Figure 3.
Among cytoskeletal and anchorage proteins, tubulins and septins are modified in content upon splenectomy. RBCs from patients, either spl (filled circles or semifilled circles for intrafamily comparison) or nonspl (open circles), and RBCs from CTLs (dark blue dotted line, CTL ratio) or a healthy splenectomized adult donor (red dotted line) were assessed by differential quantitative mass spectrometry for cytoskeleton and anchorage complex protein membrane association. (A,B) Volcano plots of ghost membranes for cytoskeletal and anchorage complex proteins (extension of Figure 2A-B). Volcano plots show the log2 of the fold changes (logFC) and the adjusted P values associated with the splenectomy effect. Proteins showing a negative or a positive logFC have a lower or higher expression level in splenectomized patients, respectively. Proteins above the dotted line show a significant difference (P < .05) in the splenectomized patient cohort as compared with the nonsplenectomized one. (C-F) Tubulin α 1b (TUBA1B), TUBB4B, TUBA4A, and regulator of microtubule dynamics protein 3 (RMDN3) membrane association. (G-J) Septins-2, -7, -8, -11 ghost membrane association.
Figure 4.
Figure 4.
The increased septin content in spherocytosis is largely restored upon splenectomy and septin-2 associates with the RBC surface. RBCs from patients, either spl (filled circles or semifilled circles for intrafamily comparison) or nonspl (open circles), and RBCs from CTLs were compared for septin content (A-F) and membrane distribution (G). Statistics are indicated above the patient cohorts for the comparison with CTL values and above a horizontal line for comparison between the 2 patient cohorts, respectively. (A-F) Septin-2 and -7 ghost membrane association determined by western blotting. Representative western blots comparing different patients with healthy donors (A) and P13 before and after splenectomy (D). (B-C,E-F) Quantification: data were first expressed as ratio to glyceraldehyde-3-phosphate dehydrogenase (GAPDH) (loading control), then as ratio of P to CTL (Kruskal-Wallis test in panels B-C; means ± standard deviation of 1 experiment in panels E-F). (G) Septin-2 immunolabeling. Scale bar, 5 μm. RBCs were spread onto PLL-coated coverslips, fixed/permeabilized in ice-cold methanol and Triton X-100, and immunolabeled for septin-2. K562 cells were used as positive controls. Representative images of 2 independent experiments. (H-I) Correlation between septins and reticulocyte count presented in supplemental Figure 1E or Transferrin receptor (TfR) content presented at Figure 6K. Linear regressions were indicated only if r2 > 0.5.
Figure 5.
Figure 5.
The septin/ANK1 ratio correlates with SPT covering/distribution and RBC alteration score, and different septins differentially correlate with RBC morphology and functionality parameters. (A) Correlation between septins and ANK1 content presented in Figure 3G-J and Figure 2B. (B-D) Correlation between septin/ANK1 ratios calculated from Figure 3G-J and cytoskeletal parameters presented in Figure 2F-G or the RBC alteration score from Figure 1N. (E-K) Relation of the septin/ANK1 ratio with RBC morphology (E-F), surface-to-volume ratio (G), osmotic fragility (H), cryohemolysis (I), intracellular calcium content (J), and EV release (K). Data are respectively from Figure 1B-C,G, H-K. Correlations with septin-2, squares and blue linear regressions; with septin-7, circles and red linear regressions; with septin-8, triangles and green linear regressions; and with septin-11, inverted triangles and gray linear regressions. Linear regressions were plotted only for r2 > 0.5; when 1 parameter correlates with 1 septin but not with the others, only the one correlating is indicated for the sake of clarity.
Figure 6.
Figure 6.
The presence of ER proteins and remnants in RBCs of nonspl patients contrasts with lysosome and mitochondria proteins and remnants in RBCs of spl patients. RBCs from patients, either spl (filled circles or semifilled circles for intrafamily comparison) or nonspl (open circles), and RBCs from CTLs (dark blue dotted line or CTL ratio or ΔP–CTL) or a healthy splenectomized donor (red dotted line) were compared for membrane association of proteins of the ER-ribosomes (A), lysosomes (B), or mitochondria (C) and for the presence of organelle remnants (D-F). Scale bar represents 5 μm in panel D. Statistics are indicated above the patient cohorts for the comparison with CTL values and above a horizontal line for comparison between the 2 patient cohorts, respectively. (A-C) Membrane ghost association of ribosomal protein S25 (RPS25), lysosomal-associated membrane protein 1 (LAMP1) and ATP synthase F1 subunit alpha (ATP5F1A), respectively, enriched in ribosomes, lysosomes, and mitochondria and determined by proteomics (statistical analysis and additional examples in supplemental Figure 3). (D-F) Organelle labeling. RBCs spread on PLL-coated coverslips were labeled with BODIPY-ceramide (Cer), LysoTracker, or MitoTracker and observed by fluorescence microscopy (LysoTracker was maintained during observation). (D) Representative images. Open and filled arrowheads, patches, and network-like structures, respectively. (E-F) Quantification of RBCs presenting LysoTracker- or MitoTracker-positive patches expressed as percentage of the total RBC population and then as ΔP–CTL (mean of 1-3 and 1-7 independent experiments perpatient in panels E and F, respectively; Kruskal-Wallis tests followed by Dunn post hoc). (G-L) Membrane ghost association of band 4.2 (EPB42), Rh-associated glycoprotein (RhAG), voltage-dependent anion channel 1 (VDAC1), translocator protein (TSPO), Transferrin receptor (TfR) and DNM2 (dynamin), respectively, involved in cytoskeleton anchorage complexes (G-H), mitophagy (I-J), and endocytosis (K-L) and determined by proteomics (for volcano plots, see supplemental Figure 3).

References

    1. Huisjes R, Bogdanova A, van Solinge WW, Schiffelers RM, Kaestner L, van Wijk R. Squeezing for life - properties of red blood cell deformability. Front Physiol. 2018;9:656. - PMC - PubMed
    1. Baines AJ. The spectrin-ankyrin-4.1-adducin membrane skeleton: adapting eukaryotic cells to the demands of animal life. Protoplasma. 2010;244(1-4):99–131. - PubMed
    1. Bogdanova A, Makhro A, Wang J, Lipp P, Kaestner L. Calcium in red blood cells-a perilous balance. Int J Mol Sci. 2013;14(5):9848–9872. - PMC - PubMed
    1. Betz T, Lenz M, Joanny JF, Sykes C. ATP-dependent mechanics of red blood cells. Proc Natl Acad Sci U S A. 2009;106(36):15320–15325. - PMC - PubMed
    1. Park Y, Best CA, Auth T, et al. Metabolic remodeling of the human red blood cell membrane. Proc Natl Acad Sci U S A. 2010;107(4):1289–1294. - PMC - PubMed

Publication types