. 2023 Feb 16;186(4):786-802.e28.
doi: 10.1016/j.cell.2023.01.005. Epub 2023 Feb 7.

PIKFYVE inhibition mitigates disease in models of diverse forms of ALS

Affiliations

PIKFYVE inhibition mitigates disease in models of diverse forms of ALS

Shu-Ting Hung et al. Cell. .

Abstract

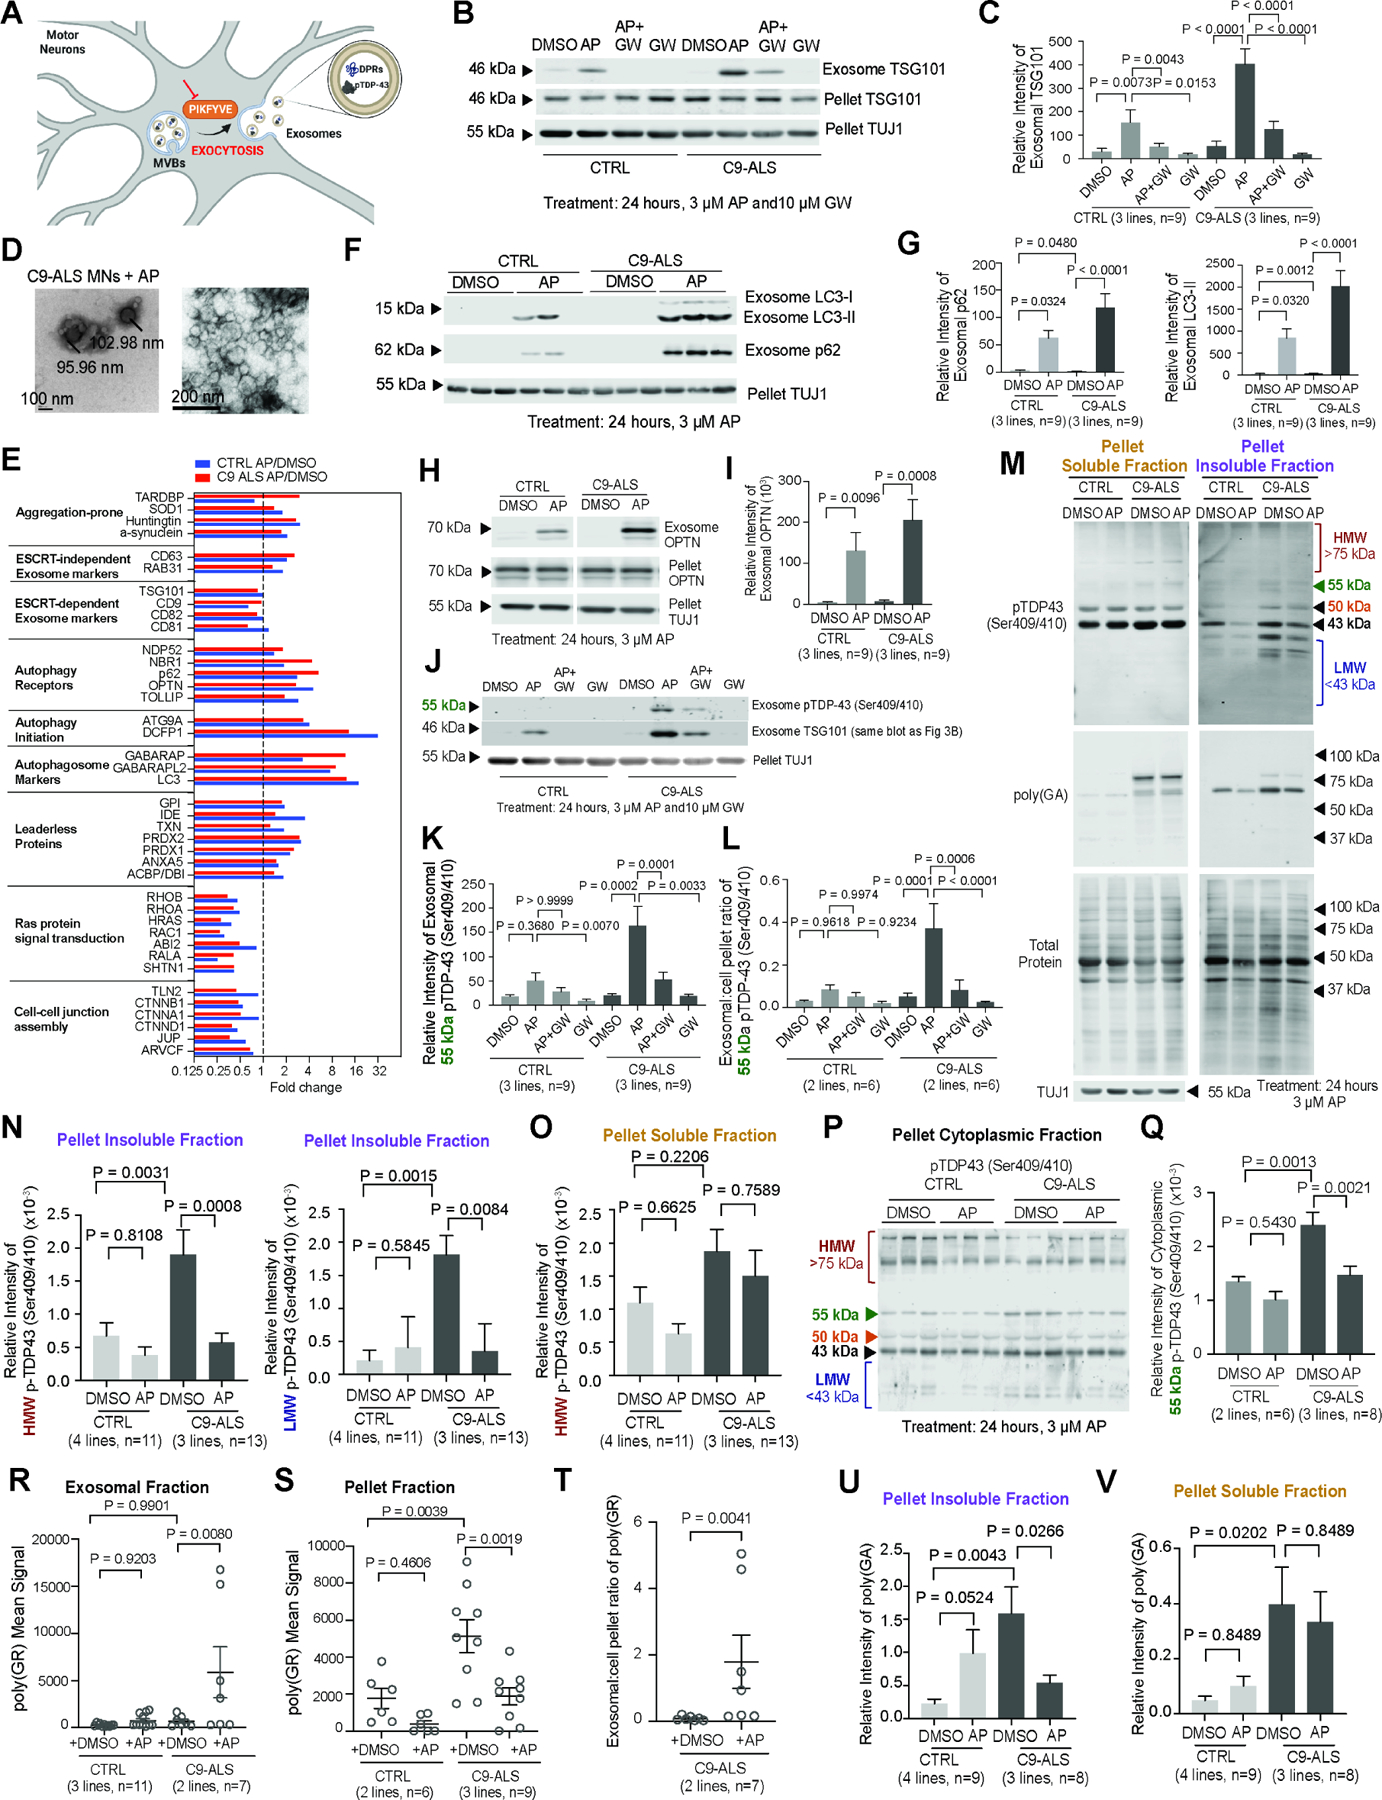
Amyotrophic lateral sclerosis (ALS) is a fatal neurodegenerative disease that results from many diverse genetic causes. Although therapeutics specifically targeting known causal mutations may rescue individual types of ALS, these approaches cannot treat most cases since they have unknown genetic etiology. Thus, there is a pressing need for therapeutic strategies that rescue multiple forms of ALS. Here, we show that pharmacological inhibition of PIKFYVE kinase activates an unconventional protein clearance mechanism involving exocytosis of aggregation-prone proteins. Reducing PIKFYVE activity ameliorates ALS pathology and extends survival of animal models and patient-derived motor neurons representing diverse forms of ALS including C9ORF72, TARDBP, FUS, and sporadic. These findings highlight a potential approach for mitigating ALS pathogenesis that does not require stimulating macroautophagy or the ubiquitin-proteosome system.

Keywords: ALS; PIKFYVE; neurodegeneration.


Conflict of interest statement

Declaration of interests J.K.I. and S.-T.A. are co-founders of AcuraStem, Inc. S.-T.A., W.-H.C., S.M., and S.H. are employees of AcuraStem, Inc. J.K.I. is a co-founder of Modulo Bio, serves on the scientific advisory boards of AcuraStem, Spinogenix, Synapticure, and Vesalius Therapeutics, and is employed at BioMarin Pharmaceutical. B.V.Z. is a co-founder of ZZ Biotech and chairman of its scientific advisory board. J.A.P. is a co-founder of Modelis. F.-B.G. receives research funding from Stealth BioTherapeutics.

Figures

Figure 1.
Figure 1.. PIKFYVE inhibition ameliorates C9ORF72 ALS/FTD neurodegeneration
(A) Production of Hb9::RFP+ iMNs and survival tracking by longitudinal microscopy. (B) iMN survival for three control (CTRL) and three C9ORF72 ALS/FTD lines. Log-rank test. (C) Hazard ratios for (B). Mean of independent iMN conversions ± SEM. One-way ANOVA. (D) Survival of C9-ALS/FTD iMNs (three lines) in DMSO/apilimod (AP). Log-rank test. (E) Hazard ratios for CTRL (three lines in aggregate) and C9-ALS/FTD iMNs treated with DMSO/apilimod. Mean of independent iMN conversions ± SEM. One-way ANOVA. (F) Hazard ratios from CTRL (two lines in aggregate) and C9-ALS/FTD iMNs treated with negative control (NC) ASO, PIKFYVE ASO1, or PIKFYVE ASO2. Mean of independent iMN conversions ± SEM. One-way ANOVA. (G) Locomotor function in Drosophila larvae overexpressing C9ORF72 GR.100 with/without apilimod treatment. N=30 larvae/group. Kruskal-Wallis test. Mean ± SEM.
Figure 2.
Figure 2.. PIKFYVE inhibition ameliorates disease pathology in C9ORF72 ALS/FTD iMNs
(A) Truncated Stathmin2 RNA levels (normalized to MAP2) relative to full-length Stathmin2 in CTRL/C9-ALS/FTD iMNs treated with DMSO/apilimod. Gray circles = independent iMN conversions. One-way ANOVA. Mean ± SEM. (B-D) Immunostaining/quantification of total TDP-43 in CTRL/C9-ALS/FTD iMNs with DMSO/apilimod treatment. Dots = (C) the mean cytoplasmic TDP-43 intensity or (D) the average nuclear:cytoplasmic TDP-43 ratio in one iMN. Kruskal-Wallis test. Median ± interquartile range. Solid/dotted lines outline the cell body/nucleus. (E-F) Immunostaining/quantification of endogenous poly(GR)+ punctae in CTRL/C9-ALS/FTD iMNs treated with DMSO/apilimod. Gray circles = the number of nuclear poly(GR)+ punctae/μm2 in one iMN. Kruskal-Wallis test. Median ± interquartile range. Solid/dotted lines outline the cell body/nucleus.
Figure 3.
Figure 3.. PIKFYVE inhibition increases exocytosis of aggregation-prone proteins from iMNs
(A) PIKFYVE’s putative role in the exocytosis of aggregation-prone proteins. (B-C) Immunoblots/quantification of TSG101 in exosomal or pellet fractions from CTRL/C9-ALS/FTD iMNs treated with DMSO, apilimod, apilimod+GW4869, or GW4869. Pellet TUJ1 controlled for cell death. One-way ANOVA. Mean ± SEM. (D) Electron microscopic images of secreted vesicles in the exosomal fraction of apilimod-treated C9-ALS/FTD iMN cultures. (E) Fold-change of selected protein levels in exosomal fractions after apilimod treatment versus DMSO from CTRL/C9-ALS/FTD iMNs. (F-G) Immunoblots/quantification of LC3 and p62 in the exosomal fraction from CTRL/C9-ALS/FTD iMN cultures treated with DMSO/apilimod. One-way ANOVA. Mean ± SEM. (H-I) Immunoblots/quantification of OPTN in exosomal and pellet fractions from C9-ALS/FTD iMNs treated with DMSO/apilimod. Unpaired t-test. Mean ± SEM. (J-L) Immunoblots/quantification of pTDP-43 in exosomal and pellet fractions from CTRL/C9-ALS/FTD iMNs treated with DMSO, apilimod, apilimod+GW4869, or GW4869. The same blot from Figure 3B was used to facilitate comparisons between markers. Exosome TSG101 is the same as Figure 3B. (K) Exosomal pTDP-43 levels. (L) pTDP-43 exosomal:pellet ratio for CTRL/C9-ALS/FTD iMNs. One-way ANOVA. Mean ± SEM. (M) pTDP43 and poly(GA) immunoblots on soluble/insoluble fractions from CTRL/C9-ALS/FTD iMNs treated with DMSO/apilimod. (N-O) Quantification of high molecular weight (HMW, >75kDa) and low molecular weight (LMW, <43 kDa) pTDP-43 in the pellet insoluble (N) or soluble (O) fraction from (M). For HMW, one-way ANOVA. Mean ± SEM. For LMW, Kruskal-Wallis test, Median ± interquartile range (N). One-way ANOVA, Mean ± SEM (O). (P-Q) Immunoblots/quantification of pTDP-43 (55 kDa) in cytoplasmic fractions from CTRL/C9-ALS/FTD iMNs treated with DMSO/apilimod. One-way ANOVA. Mean ± SEM. (R-S) Immunoassay of poly(GR) levels in exosomal (R) or cell pellet (S) fractions of CTRL/C9-ALS/FTD iMNs. Gray circles = one biological replicate. One-way ANOVA. Mean ± SEM. (T) Ratio of poly(GR) in exosomal:pellet fractions of CTRL/C9-ALS/FTD iMNs. Mann-Whitney test. Mean ± SEM. (U-V) Quantification of poly(GA) in the pellet insoluble (U) and soluble (V) fraction from (M). Values = relative intensity of insoluble poly(GA) (37–100 kDa) normalized to total protein. One-way ANOVA. Mean ± SEM.
Figure 4.
Figure 4.. PIKFYVE inhibition clears pTDP-43 through amphisome and multivesicular body exocytosis
(A) Hazard ratios of CTRL/C9-ALS/FTD iMNs treated with DMSO, apilimod, apilimod+GW4869, or GW4869. Mean of independent iMN conversions ± SEM. One-way ANOVA. (B) Hazard ratios of CTRL (2 lines in aggregate) or C9-ALS/FTD iMNs (2 lines in aggregate) treated with the ASOs indicated plus DMSO/apilimod. Mean of independent iMN conversions ± SEM. One-way ANOVA. (C-D) Immunoblots/quantification of TSG101 in exosomal or pellet fractions from CTRL/C9-ALS/FTD iMNs. Cells were treated with the ASOs indicated and DMSO/apilimod. One-way ANOVA. Mean ± SEM. (E-F) Immunoblots/quantification of exosomal pTDP-43 (50 kDa) from C9-ALS/FTD iMNs treated with the ASOs indicated and DMSO/apilimod. Exosomal TSG101 controlled for exosome secretion/collection. One-way ANOVA. Mean ± SEM. (G-H) Immunostaining/quantification of pTDP-43+/CD63+/LC3B+ punctae in C9-ALS/FTD iMNs treated with negative control or RAB27A ASO and DMSO/apilimod. (G) Confocal Z-axis scanning. Yellow arrows denote pTDP-43 colocalized with CD63 and LC3B in 3D space. White arrows denote other colocalized pTDP-43+/CD63+/LC3B+ punctae. (H) Gray circles = the average number of pTDP-43+/CD63+/LC3B+ punctae/μm2 in one C9-ALS/FTD iMN. One-way ANOVA. Mean ± SEM. (I) Correlative light and electron microscopic images of secreted CD63+ vesicles containing TDP-43 on the membrane of a C9-ALS/FTD iMN treated with apilimod. Top row: light microscopy images. Bottom row: electron microscopy images of the same cell. Arrows mark a CD63+/TDP-43+ vesicle in the process of being secreted.
Figure 5.
Figure 5.. PIKFYVE inhibition improves iMN proteostasis and survival for diverse forms of ALS
(A-D) Immunostaining/quantification of total TDP-43 in CTRL/sporadic ALS (sALS) iMNs (A-B) or in sporadic ALS iMNs treated with DMSO/apilimod (C-D). Solid/dotted lines outline the cell body/nucleus. Gray circles = the nuclear:cytoplasmic TDP-43 ratio from one iMN. Mann-Whitney test. Median ± interquartile range. (E-F) Hazard ratios of iMNs from CTRL/sporadic ALS lines (E) or CTRL, two FUS ALS (H517Q, R522R mutation), and TARDBP ALS (G298S mutation) lines (F) treated with DMSO/apilimod. Mean of independent iMN conversions ± SEM. One-way ANOVA. (G) Hazard ratios of iMNs from CTRL, two sporadic ALS, and one FUS ALS (R522R mutation) line treated with negative control or RAB27A ASO plus DMSO/apilimod. Mean of independent iMN conversions ± SEM. One-way ANOVA. (H-I) Larval turning time of TDP-43G298S Drosophila larvae with Pikfyve RNAi (H) or apilimod treatment (I). N=33 larvae/group. One-way ANOVA. Mean ± SEM.
Figure 6.
Figure 6.. Pikfyve suppression improves motor function and extends survival of TDP-43 and C9ORF72 mice
(A) Immunoblot/quantification of OPTN in CSF with negative control/Pikfyve ASO intracerebroventricular administration in neonatal mice. Unpaired t-test. Mean± SEM. Data points = one mouse. (B) Gait impairment scores of Pikfyve+/+;WT, Pikfyve+/;WT, Pikfyve+/+;TDP-43Tg/Tg and Pikfyve+/; TDP-43Tg/Tg mice. Unpaired t-test at each time point. Mean ± SEM. (C) Survival of Pikfyve+/+;TDP-43Tg/Tg and Pikfyve+/;TDP-43Tg/Tg mice. Log-rank test. (D) Gait impairment scores of WT or TDP-43Tg/Tg mice treated with vehicle and negative control/Pikfvye ASO. Unpaired t-test at each time point. Mean ± SEM. (E) Survival of TDP-43Tg/Tg mice treated with vehicle and negative control/Pikfyve ASO. Log-rank test. (F) Immunoblot/quantification of OPTN in CSF after administration of GW4869 and negative control/Pikfyve ASO. Unpaired t-test. Mean± SEM. Data points = one mouse. (G) Gait impairment scores of TDP-43Tg/Tg mice treated with vehicle/GW4869 and negative control/Pikfyve ASO. Unpaired t-test at each time point. Mean ± SEM. (H) Hindlimb clasping of AAV-eGFP-(GR)100 mice treated with negative control/Pikfyve ASO. Unpaired t-test at each timepoint. Mean ± SEM. (I) Survival of AAV-(GR)100 mice treated with negative control/Pikfyve ASO. Log-rank test.
Figure 7.
Figure 7.. Pikfyve suppression reduces TDP-43 and C9ORF72 pathology and neurodegeneration in vivo
(A-B) Images/quantification of large, NeuroTrace (Nissl)+ lateral motor column (LMC) neurons in the lumbar spinal cord in WT/TDP-43Tg/Tg mice treated with vehicle/GW4869 and negative control/Pikfyve ASO. Data points = the average number of NeuroTrace+ LMC neurons/ventral horn hemicord section for one mouse. One-way ANOVA. Mean ± SEM. Red dotted line = the LMC region. (C-F) Immunostaining/quantification of pTDP-43+ (Ser403/404) punctae in large TUJ1+ neurons in the spinal cord ventral horn from WT/TDP-43Tg/Tg mice treated with vehicle (C-D) or GW4869 (E-R) and negative control/Pikfyve ASO. Data points = the average number of pTDP-43+ punctae in TUJ1+ neurons/μm2 for one mouse. One-way ANOVA. Mean ± SEM. Solid/dotted lines outline the cell body/nucleus. Arrows mark pTDP-43+ punctae. (G-H) Immunostaining of total TDP-43 in large TUJ1+ neurons in the ventral horn of WT/TDP-43Tg/Tg mice treated with negative control/Pikfyve ASO. Data points = the average nuclear:cytoplasmic TDP-43 ratio in TUJ1+ neurons for one mouse. One-way ANOVA. Mean ± SEM. Solid/dotted lines outline the cell body/nucleus. (I-J) Immunostaining/quantification of pTDP-43+ (Ser403/404) punctae in IBA1+ microglia in the spinal cord ventral horn from WT/TDP-43Tg/Tg mice treated with negative control/Pikfyve ASO. Data points = the average number of pTDP-43+ punctae in IBA1+ microglia/μm2 for one mouse. One-way ANOVA. Mean ± SEM. Solid lines outline the cell body. Arrows mark pTDP-43+ punctae. (K-L, O-P) Representative images and quantification of large NeuroTrace+ LMC neurons in the lumbar spinal cord in 10-month-old Pikfyve+/+;WT, Pikfyve+/;WT, Pikfyve+/+;TDP-43Tg/+ and Pikfyve+/; TDP-43Tg/+ mice (K-L) or day 26 AAV-eGFP or AAV-eGFP-(GR)100 mice treated with negative control/Pikfyve ASO (O-P). Data points = the average number of large NeuroTrace+ LMC neurons/ventral horn hemicord section for one mouse. One-way ANOVA. Mean ± SEM. Red dotted line = the LMC region. (M-N) Immunostaining/quantification of pTDP-43+ (Ser409/410) punctae in large TUJ1+ neurons in spinal cord ventral horn from 10-month-old Pikfyve+/+;WT, Pikfyve+/;WT, Pikfyve+/+;TDP- 43Tg/+ and Pikfyve+/; TDP-43Tg/+ mice. Data points = the average number of pTDP-43+ punctae/μm2 in TUJ1+ neurons for one mouse. One-way ANOVA. Mean ± SEM. Solid/dotted lines outline the cell body/nucleus, respectively. Arrows mark pTDP-43+ punctae.

Comment in

References

    1. Mejzini R, Flynn LL, Pitout IL, Fletcher S, Wilton SD, and Anthony Akkari P (2019). ALS Genetics, Mechanisms, and Therapeutics: Where Are We Now? Frontiers in Neuroscience 13. 10.3389/fnins.2019.01310. - DOI - PMC - PubMed
    1. Pihlstrøm L, Wiethoff S, and Houlden H (2017). Genetics of neurodegenerative diseases: an overview. Handb. Clin. Neurol 145, 309–323. 10.1016/B978-0-12-802395-2.00022-5. - DOI - PubMed
    1. Barmada SJ, Skibinski G, Korb E, Rao EJ, Wu JY, and Finkbeiner S (2010). Cytoplasmic mislocalization of TDP-43 is toxic to neurons and enhanced by a mutation associated with familial amyotrophic lateral sclerosis. J. Neurosci 30, 639–649. 10.1523/JNEUROSCI.4988-09.2010. - DOI - PMC - PubMed
    1. Sweeney P, Park H, Baumann M, Dunlop J, Frydman J, Kopito R, McCampbell A, Leblanc G, Venkateswaran A, Nurmi A, et al. (2017). Protein misfolding in neurodegenerative diseases: implications and strategies. Transl. Neurodegener 6, 6. 10.1186/s40035-017-0077-5. - DOI - PMC - PubMed
    1. Melentijevic I, Toth ML, Arnold ML, Guasp RJ, Harinath G, Nguyen KC, Taub D, Parker JA, Neri C, Gabel CV, et al. (2017). C. elegans neurons jettison protein aggregates and mitochondria under neurotoxic stress. Nature 542, 367–371. 10.1038/nature21362. - DOI - PMC - PubMed

Publication types

MeSH terms

Substances