. 2023 Mar;615(7953):728-733.
doi: 10.1038/s41586-023-05779-1. Epub 2023 Feb 8.

The structural basis for HIV-1 Vif antagonism of human APOBEC3G

Affiliations

The structural basis for HIV-1 Vif antagonism of human APOBEC3G

Yen-Li Li et al. Nature. 2023 Mar.

Abstract

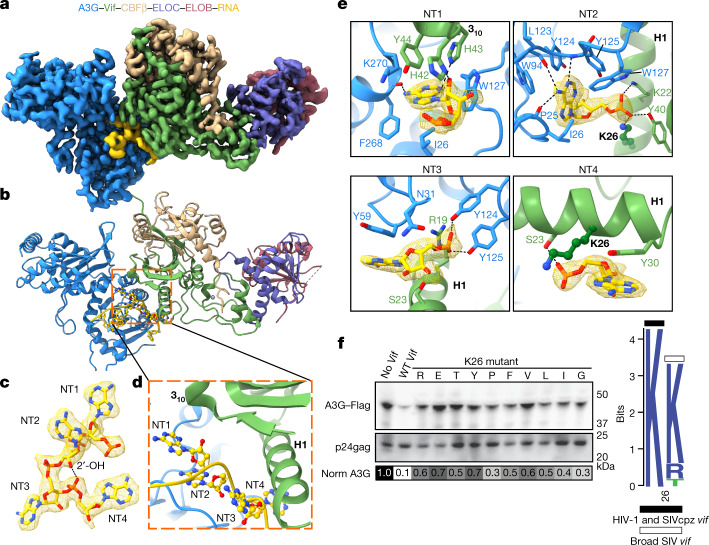
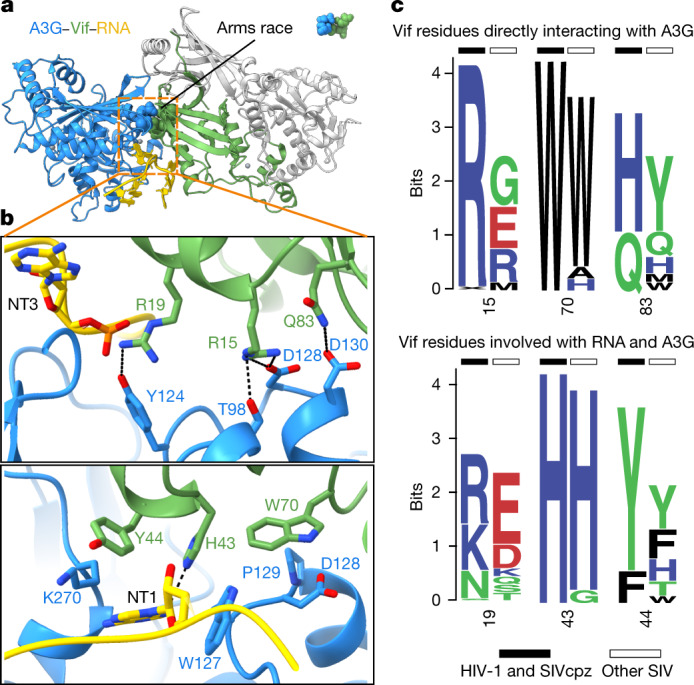
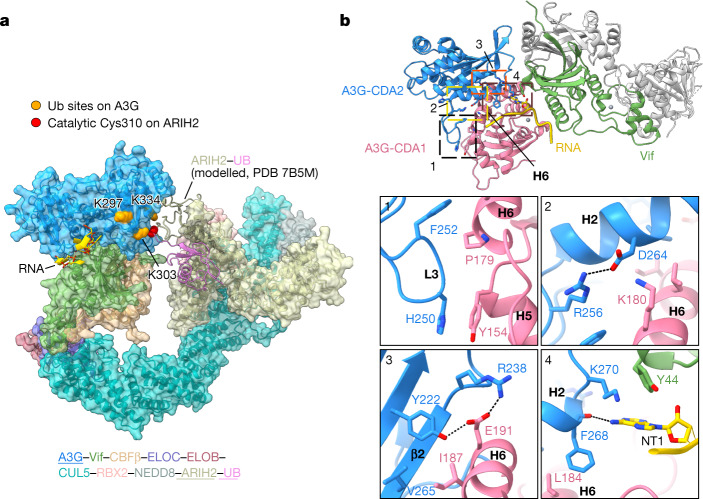
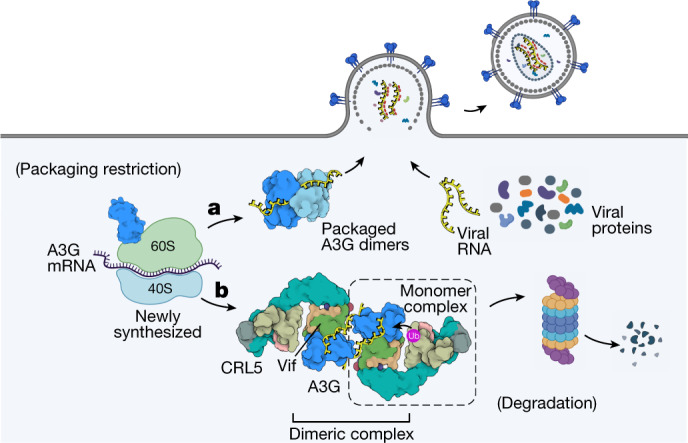
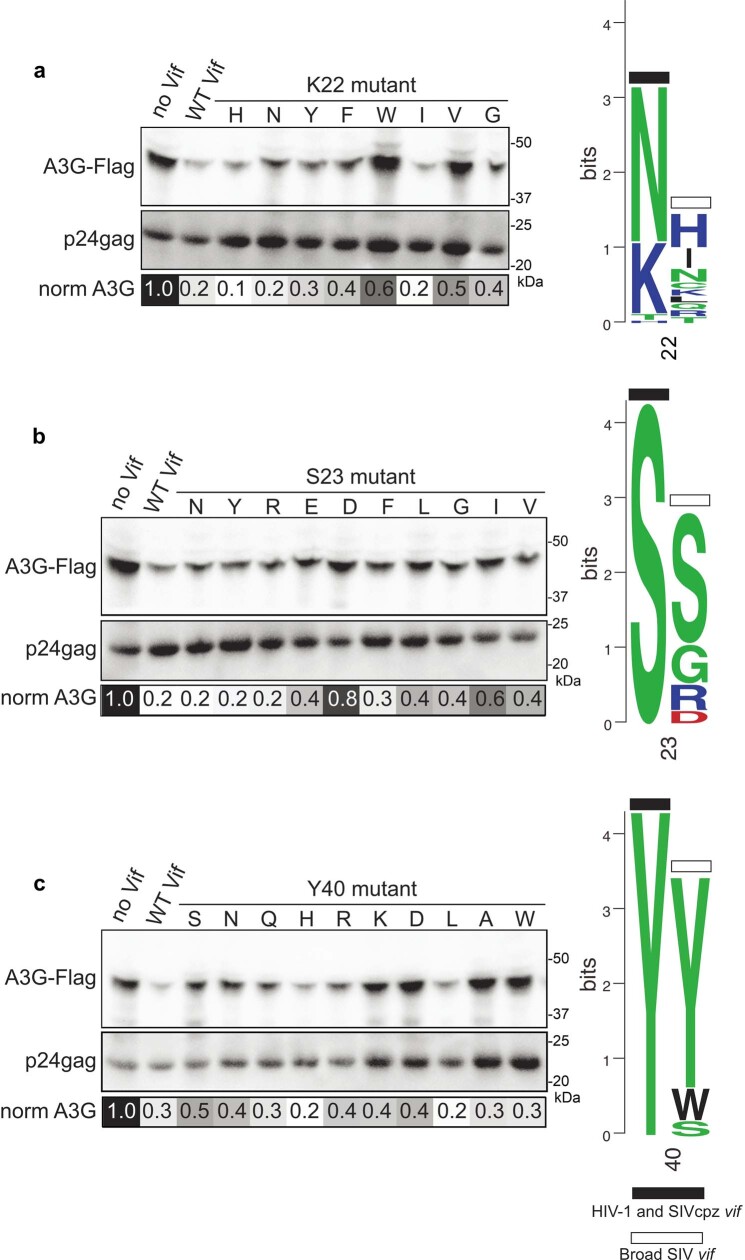
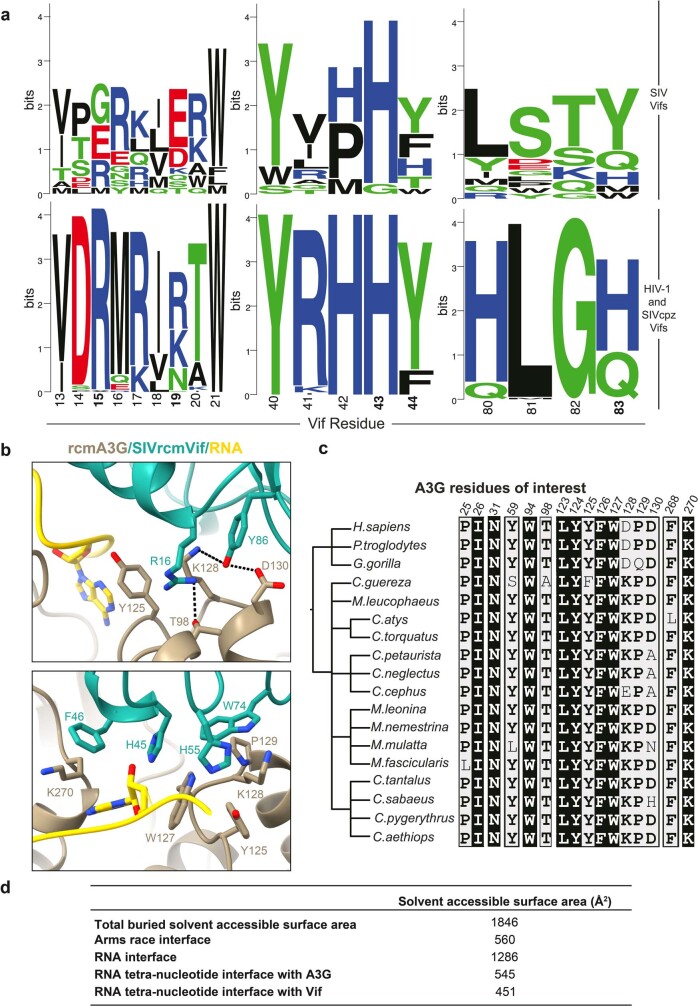
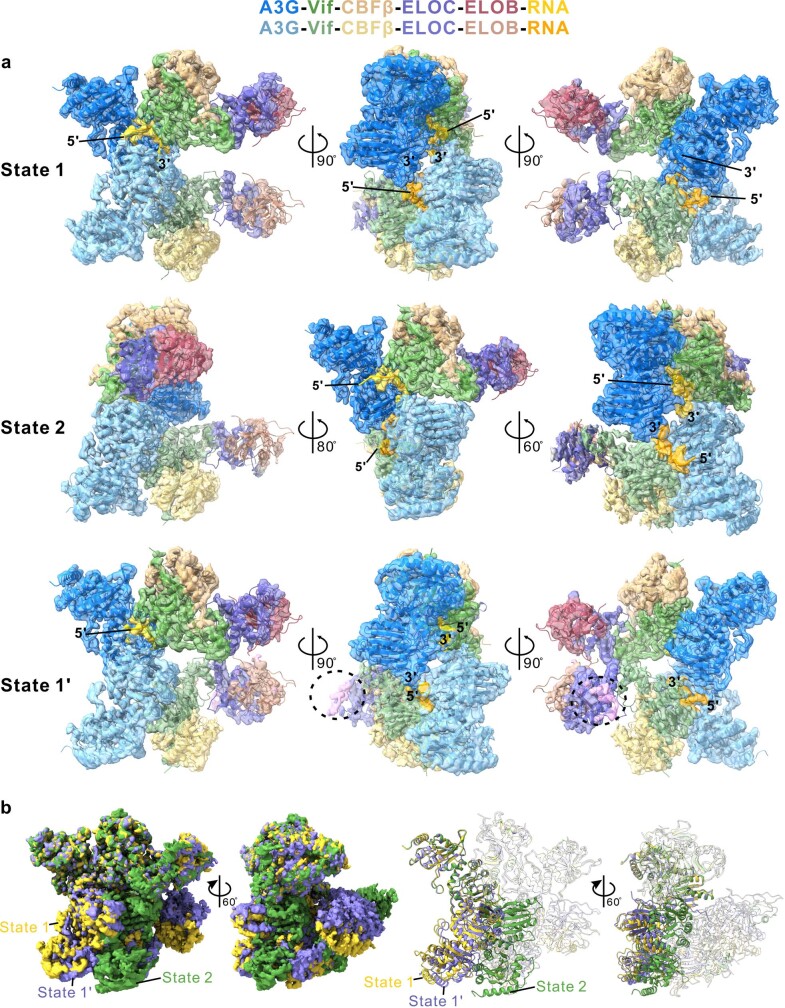
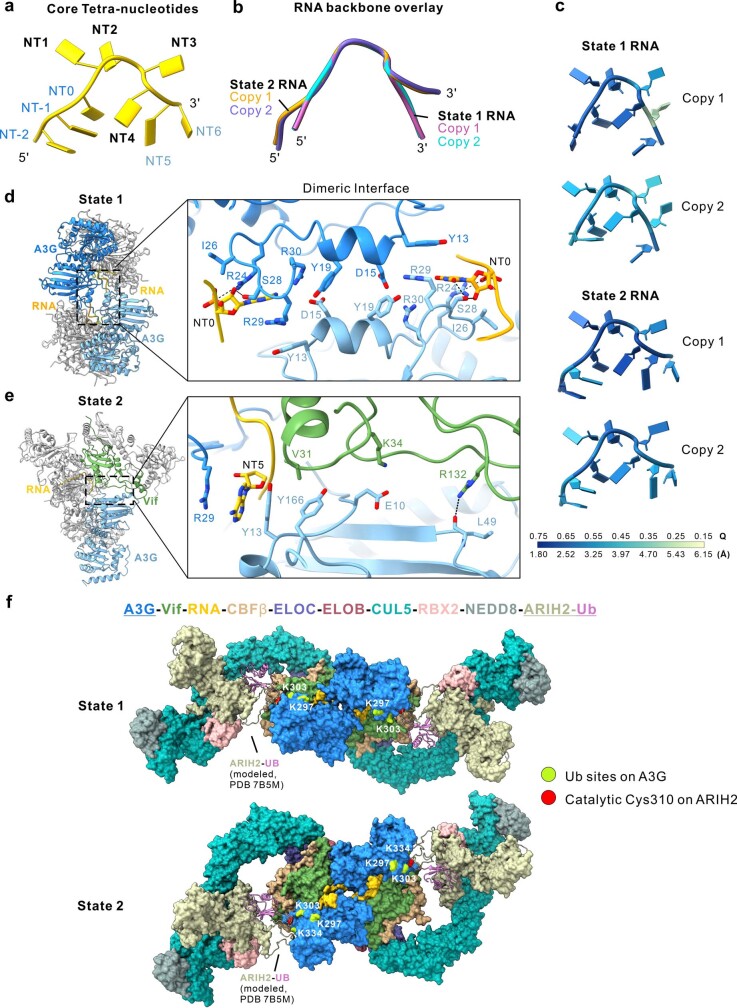
The APOBEC3 (A3) proteins are host antiviral cellular proteins that hypermutate the viral genome of diverse viral families. In retroviruses, this process requires A3 packaging into viral particles1-4. The lentiviruses encode a protein, Vif, that antagonizes A3 family members by targeting them for degradation. Diversification of A3 allows host escape from Vif whereas adaptations in Vif enable cross-species transmission of primate lentiviruses. How this 'molecular arms race' plays out at the structural level is unknown. Here, we report the cryogenic electron microscopy structure of human APOBEC3G (A3G) bound to HIV-1 Vif, and the hijacked cellular proteins that promote ubiquitin-mediated proteolysis. A small surface explains the molecular arms race, including a cross-species transmission event that led to the birth of HIV-1. Unexpectedly, we find that RNA is a molecular glue for the Vif-A3G interaction, enabling Vif to repress A3G by ubiquitin-dependent and -independent mechanisms. Our results suggest a model in which Vif antagonizes A3G by intercepting it in its most dangerous form for the virus-when bound to RNA and on the pathway to packaging-to prevent viral restriction. By engaging essential surfaces required for restriction, Vif exploits a vulnerability in A3G, suggesting a general mechanism by which RNA binding helps to position key residues necessary for viral antagonism of a host antiviral gene.


Conflict of interest statement

The authors declare no competing interests.

Figures

Fig. 1
Fig. 1. Structure of the VCBC ligase substrate receptor in complex with human A3G and RNA.
a, Cryo-EM map for the A3G–RNA–VCBC monomer. b, Corresponding view of the refined coordinate model of the A3G–VCBC complex, highlighting the four-nucleotide core motif (ball-and-stick) between Vif and A3G. Here and throughout, the same colour coding for A3G, Vif, CBFβ, ELOB, ELOC and RNA is used as indicated. c, Composite density map for NT1–4 of RNA, with a hydrogen bond indicated between ribose 2′-OH on NT2 and phosphate on NT4. d, Ribbon diagram showing NT1–4 of RNA bridging helix 1 (H1) and 310 helix turn of Vif with A3G. e, Close-up of protein–RNA interactions between Vif and A3G for each core nucleotide of RNA. f, Functional assessment of amino acid substitutions of residue K26 in HIV-1 Vif. Left, amino acid mutants at Vif residue K26 were assessed for their ability to prevent packaging of A3G into virions; top, virion incorporation of A3G; bottom, amount of virus (p24gag) in the corresponding virion preparation. Below is a greyscale heatmap of relative A3G incorporation normalized to p24gag based on two replicate transfections (with the exception of K26Y), with the amount of A3G in the ‘No Vif’ control set to 1.0 (darkest shading). Controls were run on the same gel as the samples. For Source data, see Supplementary Fig. 1. Right, logo plot of amino acids found in the consensus of all HIV-1 clades, as well as SIVcpz (black bar) and all other SIV strains with equal distribution of each SIV (white bar). WT, wild type.
Fig. 2
Fig. 2. Interplay between the molecular arms race and RNA interfaces of Vif–A3G.
a, Ribbon diagram showing position of molecular arms race interface (spheres) relative to the RNA interface (sticks). CBFβ, ELOB and ELOC are coloured grey. b, Close-up of molecular arms race interface (top) and residues that contribute to Vif–A3G binding and in contact with RNA (bottom). Residues D128 and D130 of A3G are under diversifying selection; residue Q83 is an adaptation that allowed SIVrcm Vif to neutralize hominid primate A3G and thus enable cross-species transmission. c, Logo plots of natural sequence variation in Vif residues that line the molecular arms race (top) and Vif–A3G–RNA interface (bottom). HIV-1 and SIVcpz sequences (black bars) are the consensus of all HIV-1 clades as well as SIVcpz, and SIV sequences (white bars) are all other SIV strains using equal distribution of each SIV.
Fig. 3
Fig. 3. Vif orients acceptor lysine residues on CDA2 of A3G for ubiquitin transfer.
a, Comparative model of A3G/RNA in complex with Vif CRL5 E3 ligase bound to coenzyme ARIH2 that transfers the first ubiquitin (Ub) to CDA2 of A3G. Lysine residues identified as A3G ubiquitination sites by mass spectrometry and required for Vif-mediated degradation of A3G are coloured orange; the catalytic Cys310 of ARIH2 is coloured red. b, Overview of interactions that stabilize the relative orientation of CDA domains in A3G. Helix 6 (H6), previously shown to be important in A3G dimerization, is labelled. Bottom panels show close-up of interactions within A3G CDA domains, and between A3G, RNA and Vif.
Fig. 4
Fig. 4. Schematic model of A3G inhibition by HIV-1 Vif.
a,b, Packaging of A3G into HIV-1 virus requires A3G dimerization and its interaction with viral RNA (a); Vif neutralizes A3G early during its biosynthesis by binding RNA-bound A3G, inhibition of A3G dimerization and promotion of ubiquitin-mediated proteolysis (b). Created with BioRender.com.
Extended Data Fig. 1
Extended Data Fig. 1. A3G–VCBC–CUL5N complex expression, purification, and characterization.
a, Size exclusion chromatograph of purified A3G–VCBC–CUL5N complex along with a coomassie blue-stained SDS-PAGE (insert) of peak fraction (blue bar). The gel is representative of three independent experiments. For source gel data, see Supplementary Fig. 1b. b, A representative motion-corrected cryo-EM micrograph of purified complexes collected from peak fraction (blue bar in (a)) imaged on UltraAuFoil grid. Scale bar, 50 nm. c, Selected 2D class averages used for generating ab initio model in the first round of heterogeneous refinement (Extended Data Fig. 2a). Similar class averages were obtained from three independent preparations imaged on Quantifoil Gold grids. Scale bar, 100 Å. Shown at the bottom are expanded views of the fourth and fifth 2D classes with two copies of A3G-VCBC labeled in white and yellow.
Extended Data Fig. 2
Extended Data Fig. 2. Workflow of cryo-EM image processing.
Flowchart of pre-processing, classification, and refinement used to generate a, the consensus reconstruction map (monomer) and b, final maps (dimers) for model building. See Methods for details. Black boxes indicate the selected classes and corresponding particles used in the further refinement. The consensus reconstruction is colored according to the local resolution estimated by ResMap. Shown on the right are the A3G and VCBC structures fit in the consensus map that is colored by subunits. Masks were used to determine different regions of volume for focused refinement and 3D variability analysis in cryoSPARC. Green and orange boxes indicate the final reconstruction for monomer and dimers, respectively; their corresponding Gold-Standard Fourier Shell Correlation (GSFSC) curves are shown at the bottom. The nominal resolution of the final map for monomer, State 1, and State 2 dimer is 2.7, 3.3, and 3.2 Å, respectively.
Extended Data Fig. 3
Extended Data Fig. 3. Cryo-EM map quality metrics.
a, Front and back views of EM density maps colored by local resolution estimated by ResMap. b, Euler angle distribution of the particles contributing to the final 3D reconstruction. c, Directional FSC plot for the reconstruction calculated by 3DFSC. Shown are histograms of directional FSC values overlaid with global FSC (0.143 cutoff; red curve) and ±1 standard deviation from the mean of directional FSC (green curve). Sphericity of approximately 0.8 for State 1 and State 2 indicate mild resolution anisotropy in the reconstruction map, which might be caused by the slightly preferred orientation of particles shown in (b). d-f, Cryo-EM density and model fit for regions of interest of the reconstruction. Shown in mesh are EM maps with corresponding atomic models to demonstrate side chain density and map-model fit from various regions of the reconstructions: d, A3G CDA1-CDA2 (left), Zn2+ ion and residues within 5 Å of Zn2+ in the zinc finger domains of A3G and Vif (middle), arms race and RNA interfaces (right) from 2.7 Å monomer structure. e, Dimeric interface of State 1 and State 2. f, RNA in A3G–RNA–VCBC monomer, State 1 and State 2 dimer. See Supplementary Fig. 2–4 for map-model fit analysis by PHENIX.
Extended Data Fig. 4
Extended Data Fig. 4. Image processing with focused classification and 3D refinement.
a, The same consensus reconstruction map shown in Extended Data Fig. 2a. b, Focused classification with partial signal subtraction yielded 3D reconstruction maps with improved density quality of the bottom region and revealed two major conformational states as seen with 3D variability analysis (see Extended Data Fig. 2b). The mask used for focused classification is highlighted in yellow. Selected classes subjected to further processing are boxed in black. GSFSC plots are shown to the right of corresponding classes. See Methods for details.
Extended Data Fig. 5
Extended Data Fig. 5. Functional and evolutionary assessment of Vif residues involved in RNA binding.
Left: Amino acid mutants at Vif residue a, K22, b, S23, and c, Y40 were assessed for their ability to prevent packaging of A3G into virions. Top Western blot in each panel shows the virion incorporation of A3G, while the bottom Western blot in each panel shows the amount of virus (p24gag) in the corresponding virion preparation. Below each panel is a greyscale heatmap of the relative A3G incorporation normalized to p24gag based on two replicate transfections (with the exception of S23Y and S23D) with the amount of A3G in the “No Vif” control set to 1.0 (darkest color). Controls were run on the same gel as the samples. For source data, see Supplementary Fig. 1a. Right of each panel: Logo plot of amino acids found in the consensus of all HIV-1 clades as well as SIVcpz (black bar), and all other SIV strains using equal distribution of each SIV (white bar).
Extended Data Fig. 6
Extended Data Fig. 6. Characterization of arms race interface.
a, Logo plots showing sequence variation of Vif residue that interacts with A3G for HIV-1 and SIVcpz (bottom) and other SIVs (top). Data is similar to that of Fig. 2c except that neighboring residues are also shown for context. b, A comparative model of rcmA3G–SIVrcm Vif–CBFβ was built with the hA3G-VCBC monomer structure as a template. Dashed lines represent the hydrogen bond network involved in the arms race interface (top). Residue K128 of rcmA3G interacts with Y86 of SIVrcm Vif, the primary determinant of Vif adaption to counteract hominid A3G. Residue F46 and W74 of SIVrcm Vif previously reported to be critical for rcmA3G neutralization engage in extensive hydrophobic interactions with rcmA3G in the model (bottom). Note amino acids 16 and 86 of SIVrcm Vif correspond to amino acids 15 and 83, respectively, in HIV-1 Vif. c, Sequence alignment of A3G residues that contact RNA or Vif from Old World Monkeys and hominids. Fully conserved residues are highlighted with white text on black background. d, Buried solvent accessible surface area for A3G–RNA–VCBC monomer structure.
Extended Data Fig. 7
Extended Data Fig. 7. A3G-RNA-VCBC forms multiple discrete dimeric configurations.
a, Cryo-EM maps for State 1 (top), State 2 (middle), and State 1′ (bottom) colored by subunit, showing three dimeric configurations of the A3G–RNA–VCBC complex (Extended Data Fig. 2b). Densities for single copies of RNA in State 1 and State 2 are clear for 8 and 9 nucleotides, respectively. In contrast, only 5 nucleotides were fit in the density map for State 1′ due to the moderate resolution at both ends of RNA. The 5′ and 3′ ends of single-stranded RNA are indicated. Extra weak density (pink) near ELOC corresponds to the expected position of CUL5N (denoted by black dashed circle) is observed for State 1′. State 1 and State 2 differ by a rigid-body motion with the second A3G–VCBC protomer rotated by 66° and translated by 28 Å relative to one another (Supplementary Video 1). b, A comparison of cryo-EM maps for State 1 (yellow), State 1′ (purple), and State 2 (green) in two orientations (left). Corresponding view of the structures for State 1, State 1′, and State 2, which are aligned by superposing A3G monomer (right). A3G is shown in solid ribbon while other proteins are in transparent for clarity. State 1′ has a dimeric configuration much similar to State 1, which are related by a 9° rotation and 4 Å translation. See Supplementary Discussion for the details.
Extended Data Fig. 8
Extended Data Fig. 8. Dimeric interfaces in the different configurations of the A3G-RNA-VCBC complex.
a, Schematic illustrating the annotation of RNA nucleotides used in this study. NT1-4 denotes the core tetra-nucleotides buried in the groove formed by A3G and Vif in the monomer; NT0 and NT5 are located near the dimeric interface for State 1 and State 2, respectively. b, Overlay of two copies of RNA backbone for State 1 and State 2. c, RNA models colored by per nucleotide Q-score. The corresponding resolution estimated from each Q-score is indicated at the bottom of colored bar. The Q-score for State 1 and State 2 EM map is 0.54 and 0.56, respectively. d–e, Structure overview (left) and close-up (right) of the dimeric interface formed by (d) A3G and A3G for State 1 and (e) A3G and Vif for State 2. The buried solvent accessible surface area calculated by Chimera X is ~ 350 and ~ 480 Å2, respectively. Note that the RNA interface is in close proximity to the dimeric interface, suggesting RNA aids or dominates dimerization for both State 1 and State 2. See Supplementary Discussion for the details. f, Model of dimeric A3G-RNA-VCBC in complex with CUL5/RBX2 E3 ligase bound to ubiquitin-loaded ARIH2 (ARIH2~UB) for State 1 (top) and State 2 (bottom). States 1 and States 2 of A3G-RNA-VCBC are compatible with CUL5/RBX2 binding and ubiquitin transfer. The model was built by overlaying A3G-RNA-VCBC dimer structures determined in this study with published structure VCBC-CUL5NTD (PDB code 4N9F), neddylated CUL5CTD–RBX2–ARIH2 (PDB code 7ONI), and a comparative model of ARIH2~UB (built based on a partial structure containing CUL1-RBX1-ARIH1-UB; PDB code 7B5M). Ubiquitin sites (K297, K303, and K334) on A3G are colored in lime, and catalytic Cys 310 on ARIH2 colored in red. See Supplementary Discussion for the details.

References

    1. Sheehy AM, Gaddis NC, Choi JD, Malim MH. Isolation of a human gene that inhibits HIV-1 infection and is suppressed by the viral Vif protein. Nature. 2002;418:646–650. doi: 10.1038/nature00939. - DOI - PubMed
    1. Harris RS, et al. DNA deamination mediates innate immunity to retroviral infection. Cell. 2003;113:803–809. doi: 10.1016/S0092-8674(03)00423-9. - DOI - PubMed
    1. Pollpeter D, et al. Deep sequencing of HIV-1 reverse transcripts reveals the multifaceted antiviral functions of APOBEC3G. Nat. Microbiol. 2018;3:220–233. doi: 10.1038/s41564-017-0063-9. - DOI - PMC - PubMed
    1. Delviks-Frankenberry KA, Desimmie BA, Pathak VK. Structural insights into APOBEC3-mediated lentiviral restriction. Viruses. 2020;12:587. doi: 10.3390/v12060587. - DOI - PMC - PubMed
    1. Uriu K, Kosugi Y, Ito J, Sato K. The battle between retroviruses and APOBEC3 genes: its past and present. Viruses. 2021;13:124. doi: 10.3390/v13010124. - DOI - PMC - PubMed

Publication types

MeSH terms