. 2023 Jul;152(1):136-144.
doi: 10.1016/j.jaci.2023.01.021. Epub 2023 Feb 7.

Local type 2 immunity in eosinophilic gastritis

Affiliations

Local type 2 immunity in eosinophilic gastritis

Netali Ben-Baruch Morgenstern et al. J Allergy Clin Immunol. 2023 Jul.

Abstract

Background: Eosinophilic gastritis (EoG) associates with type 2 immunity. However, the type 2 cytokine cellular source, gastric T-cell composition, and gastric T-cell relationship (or relationships) with disease pathology remain understudied.

Objective: We defined gastric T-cell populations and their association with histologic and endoscopic EoG pathology.

Methods: Gastric biopsy samples (n = 6 EoG, n = 7 control) were subjected to histologic, endoscopic, and flow cytometry analyses. In a complementary cohort (n = 83 EoG), IL4, IL5, and IL13 mRNA levels were correlated with EoG pathologic parameters.

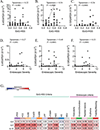
Results: Gastric biopsy samples contained CD3+ T cells that were mainly CD8+; the CD8/CD4 ratio was comparable in EoG and control biopsy samples (5.7 ± 3.0 and 4.3 ± 0.6, respectively; P = .28). Gastric regulatory T (CD3+CD4+FOXP3+) and TH2 (CD3+CD4+GATA3+) cell levels were increased in EoG versus controls (2-fold, P < .05 and 10-fold, P < .001, respectively) and correlated with gastric eosinophil levels (r = 0.63, P < .05 and r = 0.85, P < .001, respectively), endoscopic pathology (r = 0.56, P < .01; r = 0.84, P < .001, respectively), and histopathology (r = 0.72, P < .01; r = 0.82, P < .01, respectively). Cytokine-positive, most notably IL-4+, TH2 cell levels strongly correlated with histologic and endoscopic scores (r = 0.82, P < .0001 and r = 0.78, P < .0001, respectively). In an independent EoG cohort (n = 83), bulk gastric IL4, IL5, and IL13 mRNA levels correlated with histologic score (r = 0.22, P < .005; r = 0.54, P < .0001; and r = 0.36, P < .0001, respectively) and endoscopic score (r = 0.27, P < .001; r = 0.40, P < .0001; and r = 0.35, P < .0001, respectively).

Conclusions: EoG is a TH2 cell-associated disease featuring increased gastric type 2 cytokine-producing CD3+CD4+GATA3+TH2 cells that strongly correlate with disease pathologies.

Keywords: Eosinophilic gastritis; T cells; eosinophils; type 2 cytokines.


Conflict of interest statement

Competing interests:

M.E.R. is a consultant for Pulm One, Spoon Guru, ClostraBio, Serpin Pharm, Allakos, Celldex, Nextstone One, Bristol Myers Squibb, Astra Zeneca, Ellodi Pharma, GlaxoSmith Kline, Regeneron/Sanofi, Revolo Biotherapeutics, and Guidepoint and has an equity interest in the first seven listed and royalties from reslizumab (Teva Pharmaceuticals), PEESSv2 (Mapi Research Trust) and UpToDate. M.E.R. is an inventor of patents owned by Cincinnati Children’s Hospital Medical Center. T.S. has received research support from NIH (K99 AI158660) Research Fellowships and is a co-inventor of patents owned by Cincinnati Children’s Hospital Medical Center. M.H.C. has received research funding from AstraZeneca, Meritage Pharma Inc., Receptos/Celgene, Regeneron Pharmaceuticals and Shire, a Takeda company, and is a consultant for Allakos, Arena Pharmaceuticals, AstraZeneca, Calypso Biotech, EsoCap Biotech, GlaxoSmithKline, Receptos/Celgene/BMS, Regeneron Pharmaceuticals, Robarts Clinical Trials Inc./Alimentiv, Inc. and Shire, a Takeda company. V.A.M. is a consultant for Takeda and Allakos. All other authors declare that they have no competing interests.

Figures

Figure 1:
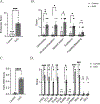
Figure 1:. Gastric eosinophil levels of human biopsies
A–B A cohort of gastric tissue (EoG, n = 7; Control, n = 6) was evaluated for gastric eosinophil levels. Peak (A) and mean numbers (B) of gastric eosinophils per HPF (derived from 5 HPF) are presented. A–B Individual markers represent distinct individuals; a black circle represents an individual without extra-gastric EGID, a triangle represents an individual with concurrent extra-gastric EGID, and a white circle represents a control individual. Bars represent mean ± SEM, analyzed using a student t-test. ***P < 0.001. EoG, eosinophilic gastritis; HPF, high-power microscopic field.
Figure 2:
Figure 2:. Histologic and endoscopic features and scoring of gastric tissue
A–D Gastric tissue of a cohort of study subjects (EoG, n = 7; Control, n = 6) was evaluated for histologic and endoscopic scoring. Overall endoscopic severity (A) and the individual endoscopic components (B) are presented. Overall Histology Scoring System (HSS) score of the histopathology severity (C) and the individual histologic components (D), including LPES, lamina propria eosinophil sheets; PCC, periglandular circumferential collars; EoSE, eosinophils in surface epithelium; EosGl, eosinophil glandulitis; EoGA, eosinophil gland abscess; EoMM, eosinophils in muscularis mucosa; LPF, lamina propria fibroplasia; LPSMH, lamina propria smooth muscle hyperplasia; REC, reactive epithelial changes; AIC, acute inflammatory cells; and SEU, surface erosion/ulceration. A–D Individual markers represent distinct individuals; a black circle represents an individual without extra-gastric EGID, a triangle represents an individual with concurrent extra-gastric EGID, and a white circle represents a control individual. Bars represent mean ± SEM, analyzed using ordinary student t-test. *P < 0.05, **P < 0.01, ***P < 0.001, ****P < 0.0001, and ns = not significant. EoG, eosinophilic gastritis.
Figure 3:
Figure 3:. Identification and quantification of T cell populations by disease state
A–D A cohort of gastric tissue (EoG, n = 7; Control, n = 6) was analyzed by flow cytometry to identify T cell populations (T cytotoxic, CD3+CD8+; T helper, CD3+CD4+; double-negative cells, CD3+CD8CD4; and double-positive cells, CD3+CD8+CD4int; Th2 cells, CD3+CD4+GATA3+; T regulatory cells, CD3+CD4+FOXP3+; and CD3+CD4+FOXP3GATA3. A The gating strategy is shown. B-D The percentage of CD8+ cells, CD4+ cells, CD8+CD4int and CD8CD4 cells (B), CD4+GATA3+ cells (C) CD4+FOXP3+ (D), and CD4+GATA3FOXP3 (E) of the total lymphocyte population (CD3high) is graphed. Each data point is a distinct subject; a black circle represents an individual without extra-gastric EGID, a triangle represents an individual with concurrent extra-gastric EGID, and a white circle represents a control individual. Bars represent mean ± SEM, analyzed using a student t-test. *P < 0.05, ***P < 0.001, and ns = not significant. EoG, eosinophilic gastritis.
Figure 4:
Figure 4:. Gastric T cell cytokine production by disease state
Single-cell suspensions prepared from gastric tissue (Control [n = 6] and EoG [n =7]) were stimulated with PDBU and ionomycin in the presence of brefeldin A and monensin (as described in methods). Harvested cells were fixed, stained, and analyzed by flow cytometry to identify T2 cytokine–producing populations. A-B Representative gating strategy for each cytokine-producing Th2 population (Th2 IL-4+, left column; Th2 IL-5+, middle column; and Th2 IL-13+, right column) in Control (top row) and EoG (lower row) (A). The percentages of each cell population relative to the total lymphocyte population (CD3high) (B) and relative to the Th2 (CD3+CD4+GATA3+FOXP3) subpopulations are shown (C). Individual dots represent distinct subjects; a black circle represents an individual without extra-gastric EGID, a triangle represents an individual with concurrent extra-gastric EGID, and a white circle represents a control individual. Bars represent mean ± SEM. Data were analyzed using a student t-test. **P < 0.01, ***P < 0.001. EoG, eosinophilic gastritis. PDBU, phorbol 12,13-dibutyrate.
Figure 5:
Figure 5:. Association of gastric T cell populations with histologic and endoscopic features
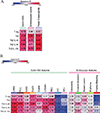
Gastric biopsies were obtained from non-EoG controls (n = 6) and patients with EoG (n =7). EoG-HSS analysis, including the determination of peak eosinophil count, was performed on these biopsies. For the same endoscopies during which biopsies for histologic assessment were procured, gastric endoscopic features were assessed and scored. For the same endoscopies, additional biopsies were obtained, single-cell suspensions of gastric tissue were produced, and flow cytometry analysis was performed to identify T cell populations. A Spearman r–based heatmap showing the correlation between gastric T cell populations and overall assessment of histologic severity, overall assessment of endoscopic severity, and peak eosinophil count. B Spearman r–based heatmap showing the correlation between gastric T cell populations and individual histologic (left) and endoscopic (right) features. For A and B, red indicates a positive correlation, and blue indicates a negative correlation. A bold number indicates statistical significance (P < 0.05). AIC, acute inflammatory cells; EoG, eosinophilic gastritis; EoSE, eosinophils in surface epithelium; EosGl, eosinophil glandulitis; EoMM, eosinophils in muscularis mucosa; HPF, high-power microscopic field; LPES, lamina propria eosinophil sheets; LPF, lamina propria fibroplasia; LPSMH, lamina propria smooth muscle hyperplasia; PCC, periglandular circumferential collars; REC, reactive epithelial changes; SEU, surface erosion/ulceration.
Figure 6:
Figure 6:. Association of gastric T2 cytokine mRNA levels with histologic and endoscopic pathologies.
A-C Spearman r correlation analysis shows the correlation between histologic score and the gastric mRNA level of the T2 cytokines IL4 (A), IL5 (B), and IL13 (C). D-F Spearman r correlation analysis shows the correlation between endoscopic scores and the gastric mRNA level of the T2 cytokines IL4 (D), IL5 (E), and IL13 (F). Individual data points represent distinct subjects. (G), Spearman r–based heatmap showing the correlation between gastric T2 cytokine mRNA and individual components of histology (left) and endoscopy (right). Red indicates a positive correlation, and blue indicates a negative correlation. The bold number indicates statistical significance (P < 0.05). RNA was isolated from gastric biopsies obtained from individuals with EoG (n = 83 in an independent cohort). AIC, acute inflammatory cells; EoG, eosinophilic gastritis; EosGl, eosinophil glandulitis; EoMM, eosinophils in muscularis mucosa; EoSE, eosinophils in surface epithelium; GAPDH, glyceraldehyde 3-phosphate dehydrogenase; HSS, Histology Scoring System; LPES, lamina propria eosinophil sheets; LPF, lamina propria fibroplasia; LPSMH, lamina propria smooth muscle hyperplasia; PCC, periglandular circumferential collars; REC, reactive epithelial changes; SEU, surface erosion/ulceration.

References

    1. Jensen ET, Martin CF, Kappelman MD, Dellon ES. Prevalence of Eosinophilic Gastritis, Gastroenteritis, and Colitis: Estimates From a National Administrative Database. J Pediatr Gastroenterol Nutr 2016; 62:36–42. - PMC - PubMed
    1. Moawad FJ. Eosinophilic Esophagitis: Incidence and Prevalence. Gastrointest Endosc Clin N Am 2018; 28:15–25. - PubMed
    1. Gonsalves N Eosinophilic Gastrointestinal Disorders. Clin Rev Allergy Immunol 2019; 57:272–85. - PubMed
    1. Collins MH, Capocelli K, Yang GY. Eosinophilic Gastrointestinal Disorders Pathology. Front Med (Lausanne) 2017; 4:261. - PMC - PubMed
    1. Rothenberg ME. Eosinophilic gastrointestinal disorders (EGID). J Allergy Clin Immunol 2004; 113:11–28; quiz 9. - PubMed

Publication types

Supplementary concepts