

Do associations of physical activity and sedentary behaviour with cardiovascular disease and mortality differ across socioeconomic groups? A prospective analysis of device-measured and self-reported UK Biobank data
- PMID: 36754587
- PMCID: PMC10359566
- DOI: 10.1136/bjsports-2022-105435
Do associations of physical activity and sedentary behaviour with cardiovascular disease and mortality differ across socioeconomic groups? A prospective analysis of device-measured and self-reported UK Biobank data
Abstract
Objective: To examine if individual-level and area-level socioeconomic status (SES) modifies the association of moderate-to-vigorous physical activity (MVPA), domain-specific physical activity and sedentary behaviour with all-cause mortality (ACM) and incident cardiovascular disease (CVD).
Methods: We used self-reported (International Physical Activity Questionnaire short form) and accelerometer-measured physical activity and sedentary behaviour data from the UK Biobank. We created an individual-level composite SES index using latent class analysis of household income, education and employment status. The Townsend Index was the measure of area-level SES. Cox proportional hazards regression models stratified across SES were used.
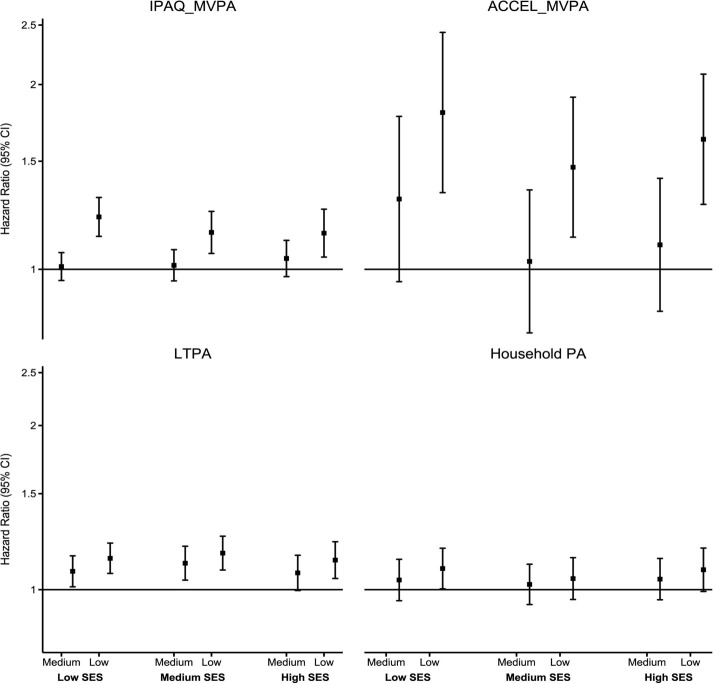
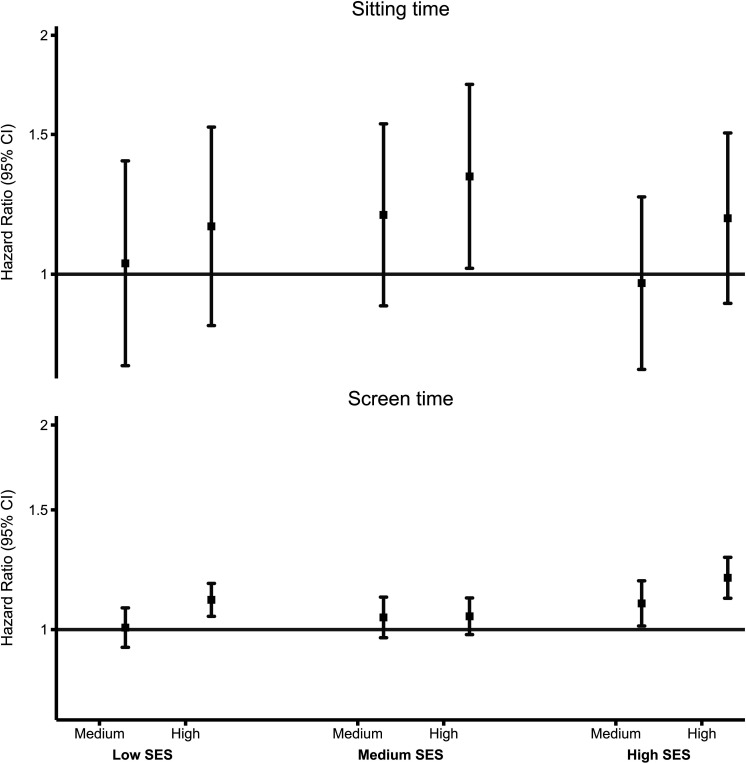
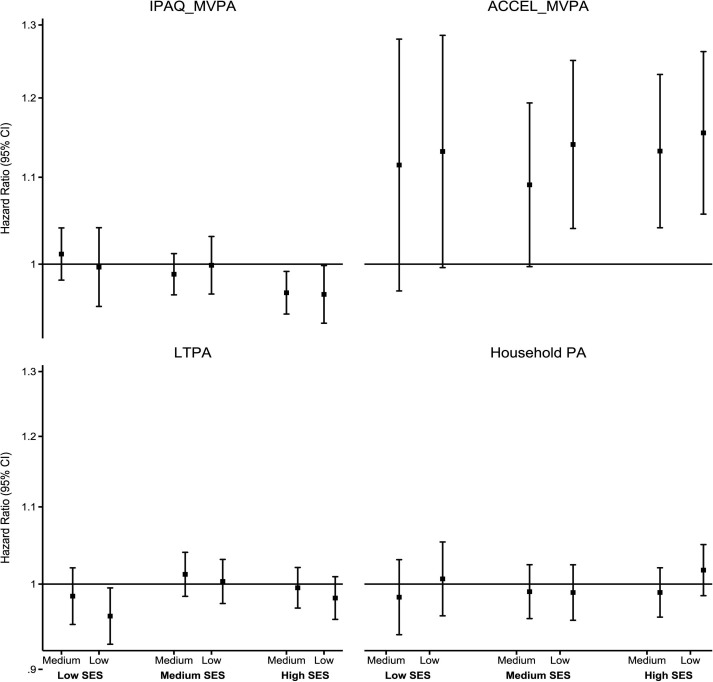
Results: In 328 228 participants (mean age 55.9 (SD 8.1) years, 45% men) with an average follow-up of 12.1 (1.4) years, 18 033 deaths and 98 922 incident CVD events occurred. We found an increased ACM risk of low physical activity and high sedentary behaviour and an increased incident CVD risk of low accelerometer-measured moderate-to-vigorous physical activity (ACCEL_MVPA) and high sitting time. We observed statistically significant interactions for all exposures in ACM analyses by individual-level SES (p<0.05) but only for screen time in area-level SES-ACM analysis (p<0.001). Compared with high self-reported moderate-to-vigorous physical activity (IPAQ_MVPA), adjusted ACM HRs for low IPAQ_MVPA were 1.14 (95% CI 1.05 to .25), 1.15 (95% CI 1.06 to 1.24) and 1.22 (95% CI 1.13 to 1.31) in high, medium and low individual-level SES, respectively. There were higher detrimental associations of low ACCEL_MVPA with decreasing area-level SES for both outcomes and of high screen time with ACM in low area-level SES.
Conclusion: We found modest evidence suggesting that the detrimental associations of low MVPA and high screen time with ACM and incident CVD are accentuated in low SES groups.
Keywords: Physical activity; Sedentary Behavior.
© Author(s) (or their employer(s)) 2023. Re-use permitted under CC BY-NC. No commercial re-use. See rights and permissions. Published by BMJ.
Conflict of interest statement
Competing interests: None declared.
Figures
Similar articles
-
Individual and area-level socioeconomic status, Life's Simple 7, and comorbid cardiovascular disease and cancer: a prospective analysis of the UK Biobank cohort.Public Health. 2024 Sep;234:178-186. doi: 10.1016/j.puhe.2024.06.028. Epub 2024 Jul 17. Public Health. 2024. PMID: 39024928
-
Replacement of sedentary behavior with various physical activities and the risk of incident depression: a prospective analysis of accelerator-measured and self-reported UK Biobank data.Soc Psychiatry Psychiatr Epidemiol. 2024 Nov;59(11):2105-2116. doi: 10.1007/s00127-024-02708-z. Epub 2024 Jul 13. Soc Psychiatry Psychiatr Epidemiol. 2024. PMID: 39001888
-
Can incidental physical activity offset the deleterious associations of sedentary behaviour with major adverse cardiovascular events?Eur J Prev Cardiol. 2025 Jan 6;32(1):77-85. doi: 10.1093/eurjpc/zwae316. Eur J Prev Cardiol. 2025. PMID: 39325719
-
Interventions outside the workplace for reducing sedentary behaviour in adults under 60 years of age.Cochrane Database Syst Rev. 2020 Jul 17;7(7):CD012554. doi: 10.1002/14651858.CD012554.pub2. Cochrane Database Syst Rev. 2020. PMID: 32678471 Free PMC article.
-
Device-measured physical activity, sedentary time, and risk of all-cause mortality: an individual participant data analysis of four prospective cohort studies.Br J Sports Med. 2023 Nov;57(22):1457-1463. doi: 10.1136/bjsports-2022-106568. Epub 2023 Oct 24. Br J Sports Med. 2023. PMID: 37875329 Review.
Cited by
-
Association Between Alcohol Consumption, Other Healthy Habits and Sociodemographic Variables and the Values of Different Insulin Resistance Risk Scales in 139,634 Spanish Workers.Healthcare (Basel). 2025 Apr 17;13(8):921. doi: 10.3390/healthcare13080921. Healthcare (Basel). 2025. PMID: 40281870 Free PMC article.
-
Association of lifestyle with valvular heart disease progression and life expectancy among elderly people from different socioeconomic backgrounds.BMC Med. 2024 Sep 5;22(1):367. doi: 10.1186/s12916-024-03576-9. BMC Med. 2024. PMID: 39237933 Free PMC article.
-
Differences in Associated Factors of Sedentary Behavior by Diabetes Mellitus Status: A Nationwide Cross-Sectional Study.J Clin Med. 2023 Aug 22;12(17):5453. doi: 10.3390/jcm12175453. J Clin Med. 2023. PMID: 37685520 Free PMC article.
-
Modulating the Expression of Exercise-induced lncRNAs: Implications for Cardiovascular Disease Progression.J Cardiovasc Transl Res. 2024 Jun 10. doi: 10.1007/s12265-024-10530-w. Online ahead of print. J Cardiovasc Transl Res. 2024. PMID: 38858339 Review.
-
Diurnal patterns of accelerometer-measured physical activity and sleep and risk of all-cause mortality: a follow-up of the National Health and Nutrition Examination Surveys (NHANES).Int J Behav Nutr Phys Act. 2024 Oct 18;21(1):120. doi: 10.1186/s12966-024-01673-9. Int J Behav Nutr Phys Act. 2024. PMID: 39425164 Free PMC article.
References
-
- Marmot M, Allen J, Goldblatt P. n.d. A social movement, based on evidence, to reduce inequalities in health: fair society, healthy lives (the marmot review). Social Science & Medicine 1982;71:1254–8. - PubMed
-
- Khanolkar AR, Chaturvedi N, Kuan V, et al. . Socioeconomic inequalities in prevalence and development of multimorbidity across adulthood: a longitudinal analysis of the MRC 1946 national survey of health and development in the UK. PLoS Med 2021;18:e1003775. 10.1371/journal.pmed.1003775 - DOI - PMC - PubMed
-
- Foster HME, Celis-Morales CA, Nicholl BI, et al. . The effect of socioeconomic deprivation on the association between an extended measurement of unhealthy lifestyle factors and health outcomes: a prospective analysis of the UK Biobank cohort. Lancet Public Health 2018;3:e576–85.:S2468-2667(18)30200-7. 10.1016/S2468-2667(18)30200-7 - DOI - PubMed
MeSH terms
LinkOut - more resources
Full Text Sources