. 2023 Aug 1;94(3):203-214.
doi: 10.1016/j.biopsych.2022.10.011. Epub 2022 Oct 28.

How Discrimination Gets Under the Skin: Biological Determinants of Discrimination Associated With Dysregulation of the Brain-Gut Microbiome System and Psychological Symptoms

Affiliations

How Discrimination Gets Under the Skin: Biological Determinants of Discrimination Associated With Dysregulation of the Brain-Gut Microbiome System and Psychological Symptoms

Tien S Dong et al. Biol Psychiatry. .

Abstract

Background: Discrimination is associated with negative health outcomes as mediated in part by chronic stress, but a full understanding of the biological pathways is lacking. Here we investigate the effects of discrimination involved in dysregulating the brain-gut microbiome (BGM) system.

Methods: A total of 154 participants underwent brain magnetic resonance imaging to measure functional connectivity. Fecal samples were obtained for 16S ribosomal RNA profiling and fecal metabolites and serum for inflammatory markers, along with questionnaires. The Everyday Discrimination Scale was administered to measure chronic and routine experiences of unfair treatment. A sparse partial least squares-discriminant analysis was conducted to predict BGM alterations as a function of discrimination, controlling for sex, age, body mass index, and diet. Associations between discrimination-related BGM alterations and psychological variables were assessed using a tripartite analysis.

Results: Discrimination was associated with anxiety, depression, and visceral sensitivity. Discrimination was associated with alterations of brain networks related to emotion, cognition and self-perception, and structural and functional changes in the gut microbiome. BGM discrimination-related associations varied by race/ethnicity. Among Black and Hispanic individuals, discrimination led to brain network changes consistent with psychological coping and increased systemic inflammation. For White individuals, discrimination was related to anxiety but not inflammation, while for Asian individuals, the patterns suggest possible somatization and behavioral (e.g., dietary) responses to discrimination.

Conclusions: Discrimination is attributed to changes in the BGM system more skewed toward inflammation, threat response, emotional arousal, and psychological symptoms. By integrating diverse lines of research, our results demonstrate evidence that may explain how discrimination contributes to health inequalities.

Keywords: Brain resting state; Discrimination; Gut microbiome; Inflammation; Psychological symptoms; Systems biology.


Conflict of interest statement

All other authors report no biomedical financial interests or potential conflicts of interest.

Figures

Figure 1.
Figure 1.
Conceptual model linking the brain-gutmicrobiome system to discrimination and clinical outcomes. AAA, aromatic amino acid; EDS, Everyday Discrimination Scale; IL-1 β, interleukin 1β; NFK-B, nuclear factor kappa light chain enhancer of activated B cells; PHQ, Physical Health Question-naire; PSS, Perceived Stress Scale; SCFA, short-chain fatty acids.
Figure 2.
Figure 2.
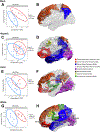
Brain regions associated with discrimination by race/ethnicity. Sparse partial least square linear discriminant analysis (sPLS-DA) plots, restingstate pairwise differences by levels of discrimination, and anatomical diagram of brain regions associated with discrimination across the different races/ethnicities: Black (A, B), Hispanic (C, D), Asian (E, F), and White (G, H). AngG, angular gyrus; AoCS, anterior occipital sulcus; ATrCos, anterior transverse collateral sulcus; CcS, calcarine sulcus; CgSMarp, marginal branch of the cingulate sulcus; Cun, cuneus; EDS, Everyday Discrimination Scale; FMarG/S, fronto-marginal gyrus and sulcus; FuG, fusiform gyrus; HG, Heschl’s gyrus; InfCirInS, inferior segment of circular sulcus of the insula; InfFGOpp, opercular part of the inferior frontal gyrus; InfFS, inferior frontal sulcus; InfOcG/S, interior occipital gyrus/sulcus; InfPrCS, inferior part of the precentral sulcus; IntPS/TrPS, intraparietal sulcus (interparietal sulcus) and transverse parietal sulci; JS, sulcus intermedius primus (of Jensen); LinG, lingual gyrus; LORs, lateral orbital sulcus; MACgG/S, middleanterior part of the cingulate gyrus and sulcus; MFG, middle frontal gyrus; MoCG, middle occipital gyrus; MOcS/LuS, middle occipital sulcus and lunatus sulcus; MTG, middle temporal gyrus; OcPo, occipital pole; OrG, orbital gyri; PaCL/S, paracentral lobule and sulcus; PerCaS, pericallosal sulcus; PrCun, precuneus; RG, gyrus rectus; SbCG/S, subcallosal gyrus/sulcus; SbPs, subparietal sulcus; SuMarG, supramarginal gyrus; SupFG, superior frontal gyrus; SupFS, superior frontal sulcus; SupPL, superior parietal lobule; SupTG, superior temporal gyrus; SupTGLp, lateral aspect of the superior temporal gyrus; Thal, thalamus; TPo, temporo-parietooccipital; TrFPoG/S, transverse frontopolar gyri and sulci.
Figure 3.
Figure 3.
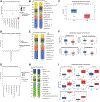
Microbiome and fecal metabolites associated with discrimination by race/ethnicity. (A) Differential abundance testing by DESEq2 of bacterial taxa associated with discrimination in Black individuals. (B) Taxonomic plot of genera with a relative abundance ≥ 1% by discrimination in Black individuals. Similar analysis represented for Hispanic (D, E) and White (G, H) individuals. Fecal metabolites by discrimination in Black (C), Hispanic (F), and Asian (I) individuals. Asian individuals had no microbiome differences by discrimination level, and White individuals had no metabolites that were different by discrimination level. EDS, Everyday Discrimination Scale.
Figure 4.
Figure 4.
Expression levels of several inflammatory markers extrapolated from peripheral blood mononuclear cells for Black (A), Hispanic (B), and White (C) participants. *p value < .05. EDS, Everyday Discrimination Scale.
Figure 5.
Figure 5.
Networks depicting high discrimination associated with brain-gut microbiome immune factors. Networks relating brain, peripheral blood mononuclear cells, microbiome, and clinical questionnaire data by race in those individuals experiencing high discrimination. Red lines are positive associations, and blue lines are negative associations.

Comment in

References

    1. Potter LN, Brondolo E, Smyth JM (2019): Biopsychosocial correlates of discrimination in daily life: A review. Stigma Health 4:38–61. - PMC - PubMed
    1. Causadias JM, Korous KM (2019): Racial discrimination in the United States: A national health crisis that demands a national health solution. J Adolesc Health 64:147–148. - PubMed
    1. Pascoe EA, Smart Richman L (2009): Perceived discrimination and health: A meta-analytic review. Psychol Bull 135:531–554. - PMC - PubMed
    1. Chiang JJ, Taylor SE, Bower JE (2015): Early adversity, neural development, and inflammation. Dev Psychobiol 57:887–907. - PubMed
    1. Nettis MA, Pariante CM, Mondelli V (2020): Early-life adversity, systemic inflammation and comorbid physical and psychiatric illnesses of adult life. Curr Top Behav Neurosci 44:207–225. - PubMed

Publication types