. 2023 Jul;33(7):5107-5117.
doi: 10.1007/s00330-023-09426-1. Epub 2023 Feb 9.

COVID-19 and vaccination impact on radiology departments provided by Dose Archiving and Communication System

Affiliations

COVID-19 and vaccination impact on radiology departments provided by Dose Archiving and Communication System

Olivier Meyrignac et al. Eur Radiol. 2023 Jul.

Abstract

Objectives: To study the impact of COVID-19 on chest CT practice during the different waves using Dose Archiving and Communication System (DACS).

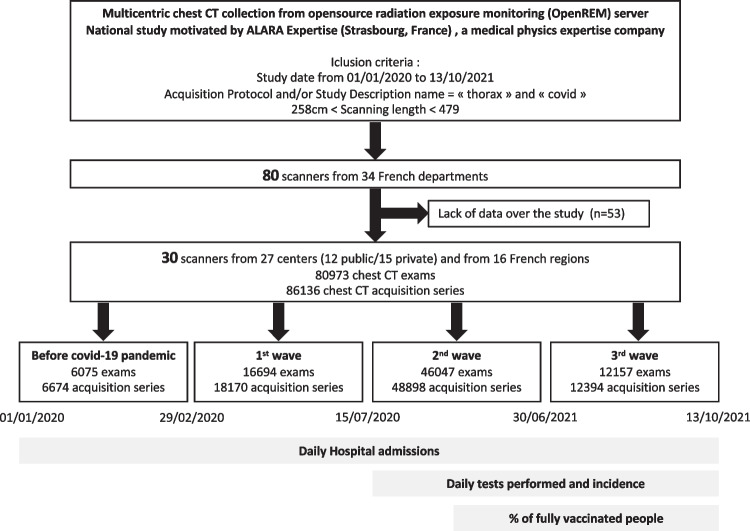
Methods: Retrospective study including data from 86,136 chest CT acquisitions from 27 radiology centers (15 private; 12 public) between January 1, 2020, and October 13, 2021, using a centralized DACS. Daily chest CT activity and dosimetry information such as dose length product (DLP), computed tomography dose index (CTDI), and acquisition parameters were collected. Pandemic indicators (daily tests performed, incidence, and hospital admissions) and vaccination rates were collected from a governmental open-data platform. Descriptive statistics and correlation analysis were performed.

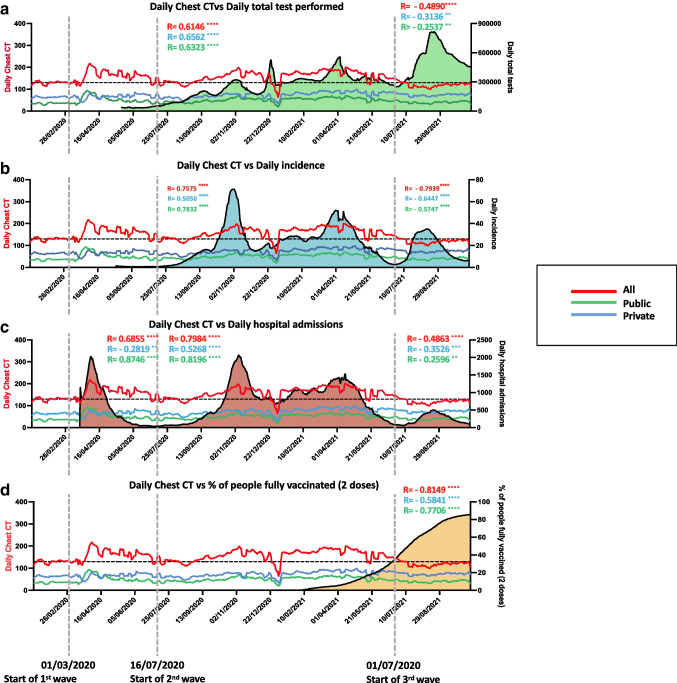
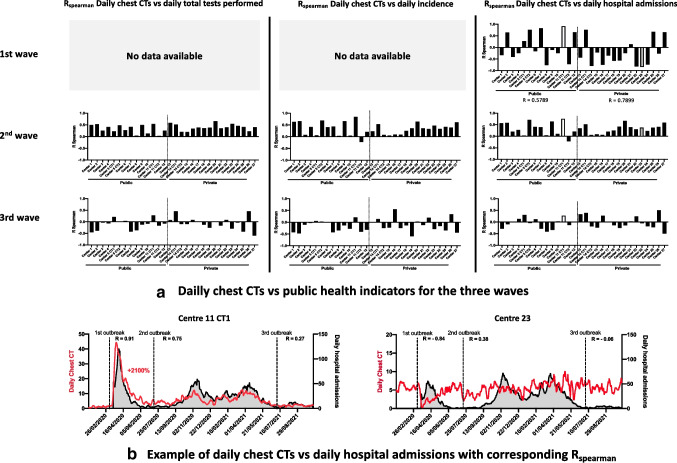
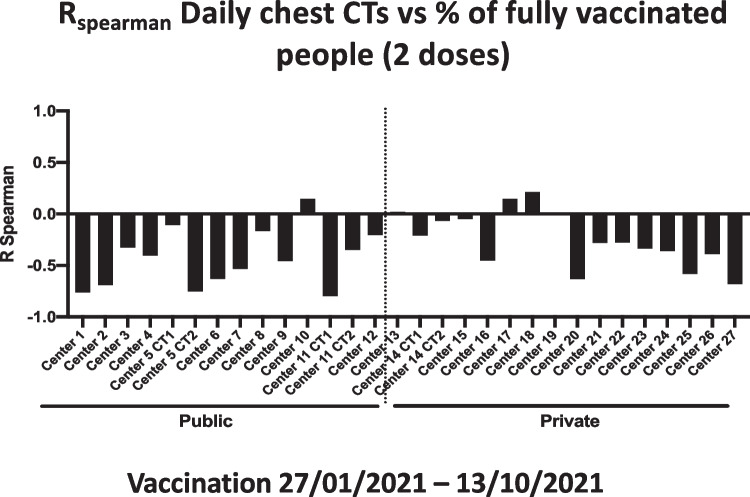
Results: For the first two waves, strong positive and significant correlations were found between all pandemic indicators and total chest CT activity, as high as R = 0.7984 between daily chest CT activity and hospital admissions during the second wave (p < 0.0001). We found differences between public hospitals and private imaging centers during the first wave, with private centers demonstrating a negative correlation between daily chest CT activity and hospital admissions (-0.2819, p = 0.0019). Throughout the third wave, simultaneously with the rise of vaccination rates, total chest CT activity decreased with significant negative correlations with pandemic indicators, such as R = -0.7939 between daily chest CTs and daily incidence (p < 0.0001). Finally, less than 5% of all analyzed chest CTs could be considered as low dose.

Conclusions: During the first waves, COVID-19 had a strong impact on chest CT practice which was lost with the arrival of vaccination. Low-dose protocols remained marginal.

Key points: • There was a significant correlation between the number of daily chest CTs and pandemic indicators throughout the first two waves. It was lost during the third wave due to vaccination arrival. • Differences were observed between public and private centers, especially during the first wave, less during the second, and were lost during the third. • During the first three waves of COVID-19 pandemic, few CT helical acquisitions could be considered as low dose with only 3.8% of the acquisitions according to CTDIvol and 4.3% according to DLP.

Keywords: COVID-19; Data analysis; Incidence; Public health; Tomography, X-ray computed.


Conflict of interest statement

The authors of this manuscript declare relationships with the following companies: ALARA and Fibermetrix.

Figures

Fig. 1
Fig. 1
Study flowchart showing the study period, the centers’ characteristics, and the number of examinations and acquisitions analyzed overall and according to the different waves
Fig. 2
Fig. 2
Daily chest CTs of all 30 scanners according to national data of daily tests performed (a), daily incidence (b), daily hospital admissions (c), and fully vaccinated people (2 doses) (d). All pandemic indicators as well as the vaccination rate were extracted from the French government open-data project (http://data.gouv.fr). The horizontal black dotted lines represent the average daily chest CT activity over January and February2020 which was considered as normal chest CT activity. The vertical gray dotted lines represent the different waves. The R value for Spearman correlations (RSpearman) between the overall daily chest CT (red), private daily CT (blue), and public daily CT (green) with all pandemic indicators and vaccination rates for the three waves are shown
Fig. 3
Fig. 3
R value for Spearman correlations (RSpearman) between daily chest CT of each scanner and the corresponding departmental data of daily tests performed, daily incidence, and daily hospital admissions for each wave (a). In order to show the disparities between chest CT activity and COVID-19 pandemic spread according to the centers and their location, we have shown two examples of daily chest CTs according to daily hospital admissions for the 11-CT1 and 23 centers (b). The Spearman correlation R values in each wave for both centers were also shown to demonstrate the consistency of this choice of method. These R values are highlighted in white for center 11-CT1 and in gray for center 23 in panel a
Fig. 4
Fig. 4
Overall CT activity (a) and percentage of chest CTs in overall activity (b) according to the three waves. For the overall activity, January 2020 was considered as a 100% activity. The black line represents the activity of the 30 scanners. The green and red lines represent, respectively, the activity of public centers and private centers
Fig. 5
Fig. 5
R value of Spearman correlations (RSpearman) between daily chest CTs of each scanner and the corresponding departmental data of % of fully vaccinated people (2 doses)
Fig. 6
Fig. 6
Tukey box plot showing the distribution of mean CTDIvol (a) per acquisition for each scanner studied. The red dotted line shows the national DRL for a chest CT acquisition, the green dotted line a dose level of a low-dose acquisition, and the blue box the range of dose acquisition considered as standard. The pie chart shows the share of each of these categories in the total acquisition of the 30 scanners for mean CTDIvol (a). Distribution of mean CTDI (b) for the 30 scanners before the COVID-19 pandemic and according to the different waves of the pandemic. The green lines show the 25° and 75° percentiles. The red lines show the medians. Mann–Whitney test was used to search statistical differences between CTDI according to the different waves, and the black stars show the p value summary (**p < 0.01; ****p < 0.0001)

References

    1. Zhou P, Yang X-L, Wang X-G, et al. A pneumonia outbreak associated with a new coronavirus of probable bat origin. Nature. 2020;579:270–273. doi: 10.1038/s41586-020-2012-7. - DOI - PMC - PubMed
    1. World Health Organization (2020) WHO Director-General’s opening remarks at the media briefing on COVID-19. https://www.who.int/director-general/speeches/detail/who-director-genera...
    1. (2022) COVID-19 Map Johns Hopkins Coronavirus Resource Center. https://coronavirus.jhu.edu/map.html
    1. Gostic K, Gomez AC, Mummah RO, et al (2020) Estimated effectiveness of symptom and risk screening to prevent the spread of COVID-19. eLife 9:e55570. 10.7554/eLife.55570 - PMC - PubMed
    1. Ducray V, Vlachomitrou AS, Bouscambert-Duchamp M, et al. Chest CT for rapid triage of patients in multiple emergency departments during COVID-19 epidemic: experience report from a large French university hospital. Eur Radiol. 2021;31:795–803. doi: 10.1007/s00330-020-07154-4. - DOI - PMC - PubMed