. 2023 Feb 8;14(1):550.
doi: 10.1038/s41467-023-36189-6.

VGLL3 is a mechanosensitive protein that promotes cardiac fibrosis through liquid-liquid phase separation

Affiliations

VGLL3 is a mechanosensitive protein that promotes cardiac fibrosis through liquid-liquid phase separation

Yuma Horii et al. Nat Commun. .

Abstract

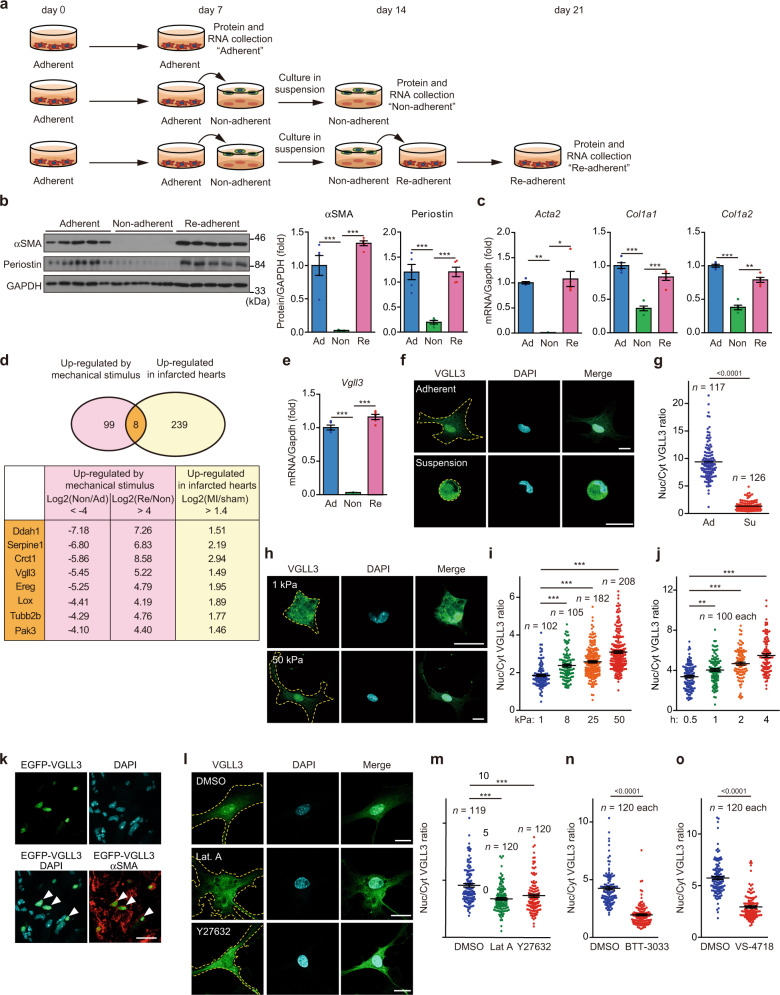
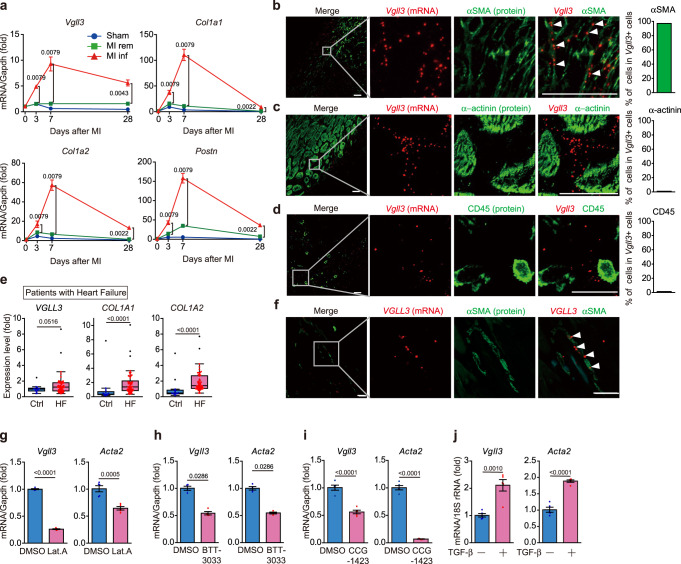
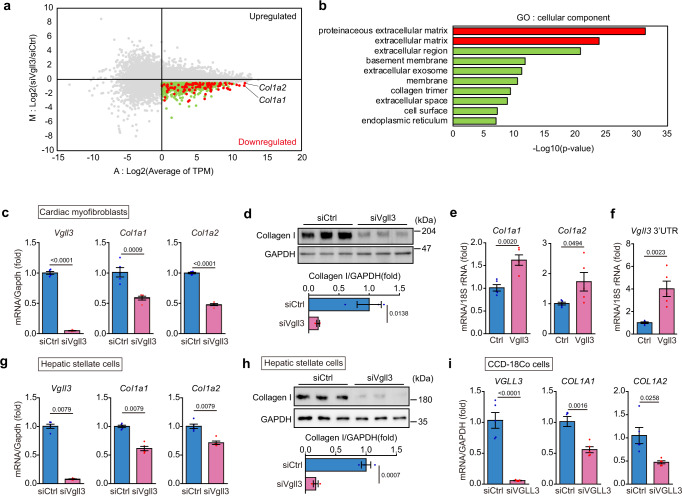
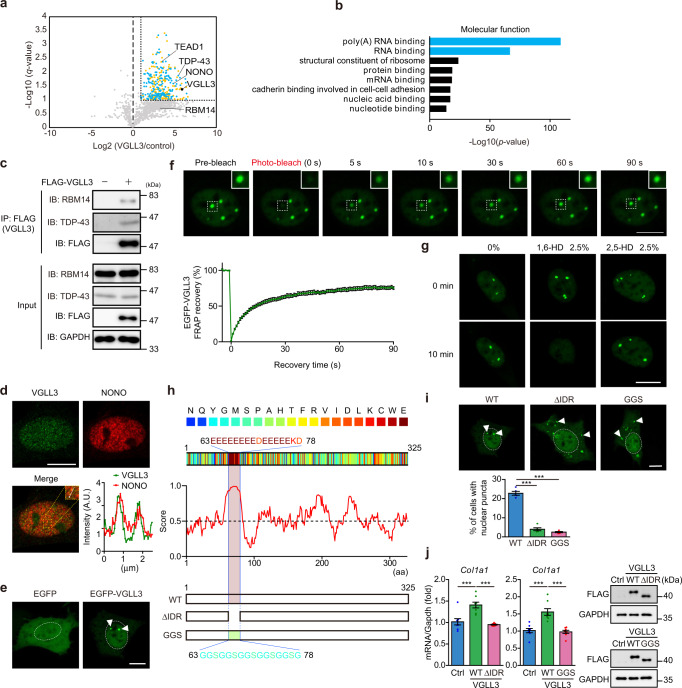
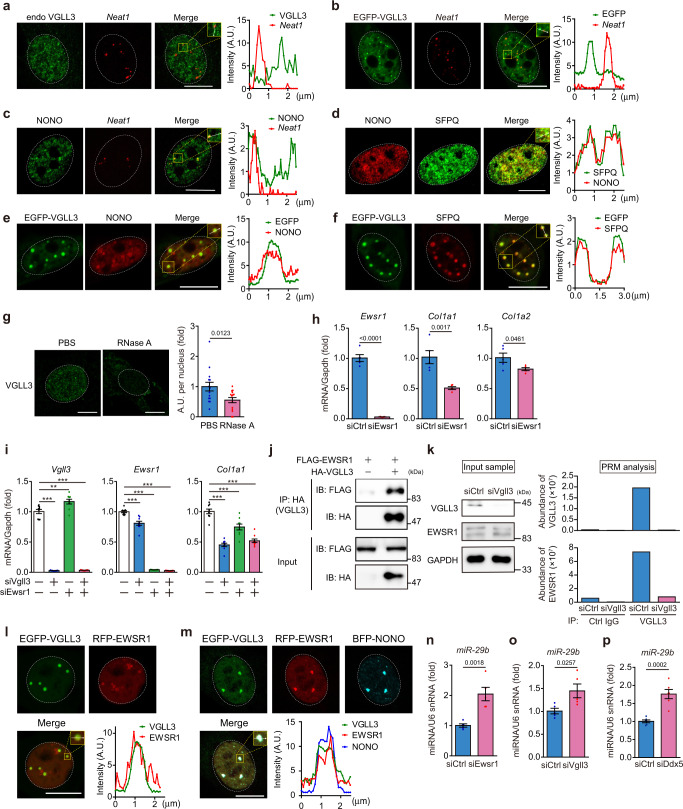
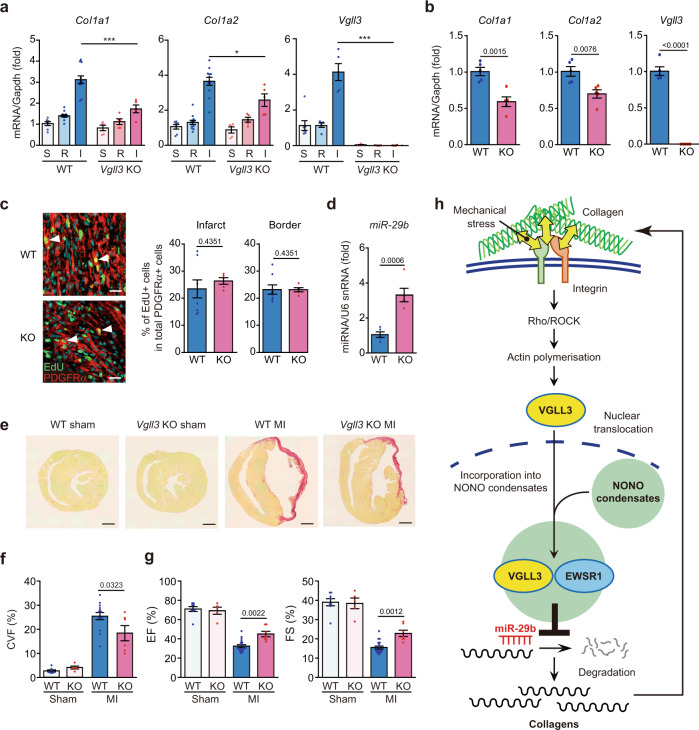
Myofibroblasts cause tissue fibrosis by producing extracellular matrix proteins, such as collagens. Humoral factors like TGF-β, and matrix stiffness are important for collagen production by myofibroblasts. However, the molecular mechanisms regulating their ability to produce collagen remain poorly characterised. Here, we show that vestigial-like family member 3 (VGLL3) is specifically expressed in myofibroblasts from mouse and human fibrotic hearts and promotes collagen production. Further, substrate stiffness triggers VGLL3 translocation into the nucleus through the integrin β1-Rho-actin pathway. In the nucleus, VGLL3 undergoes liquid-liquid phase separation via its low-complexity domain and is incorporated into non-paraspeckle NONO condensates containing EWS RNA-binding protein 1 (EWSR1). VGLL3 binds EWSR1 and suppresses miR-29b, which targets collagen mRNA. Consistently, cardiac fibrosis after myocardial infarction is significantly attenuated in Vgll3-deficient mice, with increased miR-29b expression. Overall, our results reveal an unrecognised VGLL3-mediated pathway that controls myofibroblasts' collagen production, representing a novel therapeutic target for tissue fibrosis.


Conflict of interest statement

The authors declare no competing interests.

Figures

Fig. 1
Fig. 1. Substrate stiffness induces Vgll3 expression and its nuclear translocation in myofibroblasts.
a Schematic representation of the protocol for regulating myofibroblast differentiation using substrate stiffness. b Western blot detection of αSMA, periostin and GAPDH in Adherent (Ad), Non-adherent (Non), and Re-adherent (Re) cardiac myofibroblasts (n = 5 each). c mRNA levels of fibrosis-related genes in Ad, Non and Re cardiac myofibroblasts (n = 5 each). d Venn diagram of genes upregulated by substrate stiffness and in infarcted hearts. e mRNA levels of Vgll3 in Ad, Non, and Re cardiac myofibroblasts (n = 5 each). fi Confocal immunofluorescence images of endogenous VGLL3 in myofibroblasts cultured in suspension or adherent culture (f), or plated on soft (1 kPa) and stiff (50 kPa) hydrogels (h). Graphs indicate the ratios of nuclear to cytoplasmic VGLL3 intensities in myofibroblasts cultured in adherent (Ad) or suspension (Su) culture (g), or plated on hydrogels with different elastic modulus (i). j Ratios of nuclear to cytoplasmic VGLL3 intensities in myofibroblasts attached for different durations on plastic plate. k Nuclear localisation of EGFP-VGLL3 in myofibroblasts (αSMA) in the left ventricle of MI murine hearts on day 3. White arrowheads in merged images indicated representative signals for VGLL3 in myofibroblasts. l Confocal immunofluorescence images of myofibroblasts treated with DMSO (0.5%), latrunculin A (Lat A, 2 μM), and Y27632 (80 μM). mo Ratios of nuclear to cytoplasmic VGLL3 intensities in myofibroblasts treated with the cytoskeletal inhibitors (m), the integrin β1 inhibitor BTT-3033 (30 μM) (n), or FAK inhibitor VS-4718 (50 μM) (o). All experiments were performed at least three times. Data in (b, c, e, g, i, j), and (mo) are shown as the mean ± SEM. P-values were determined using one-way ANOVA followed by Tukey’s range test in (b, c) (Col1a1 and Col1a2) and (e), Kruskal–Wallis followed by Dunn’s test in c (Acta2), (i, j, m), and two-sided Mann–Whitney’s U test in g, n, and o, *P < 0.05, **P < 0.01, ***P < 0.001. Scale bars in (f, h, k) and l = 20 μm. Source data are provided as a Source Data file.
Fig. 2
Fig. 2. Vgll3 is induced in fibrotic heart and is specifically expressed in myofibroblasts.
a mRNA levels of Vgll3 and fibrosis-related genes in sham-operated mouse hearts (sham), and in the remote (rem) and infarcted (inf) areas of mouse hearts after myocardial infarction (MI) (n = 3–6 hearts/group). bd Co-detection of Vgll3 mRNA and αSMA (b), α-actinin (c) and CD45 (d) in the left ventricle of MI murine hearts on day 7. Percentage of cells positive for each marker protein in Vgll3 + cells is shown in each graph (n > 100 cells). e mRNA levels of VGLL3 and fibrosis-related genes in the hearts of control individuals (Ctrl) (n = 14) and patients with heart failure (HF) (n = 50) based on data from GSE116250. f Co-detection of VGLL3 mRNA and αSMA in the left ventricle of patients with MI. gi Vgll3 and Acta2 mRNA levels in cardiac myofibroblasts treated with Lat.A (2 μM) for 4 h (n = 5 each) (g), BTT-3033 (15 μM) for 12 h (n = 4 each) (h) and CCG-1423 (10 μM) for 24 h (n = 5 each) (i). j Vgll3 and Acta2 mRNA levels in neonatal rat cardiac fibroblasts treated with TGF-β (10 ng/mL) for 24 h (n = 4 each). Data in (e) are presented as box and whisker plots (Tukey style, outliers in black dots). The box shows the 25th to 75th percentile range with the median value represented by a horizontal line. The whiskers stretch to the minimum and maximum values within 1.5 times the interquartile range from the 25th–75th percentiles. Data in (a), and (gj) are presented as the mean ± SEM. P-values were determined using the two-sided Mann–Whitney’s U test in (a, e, h), two-sided Student’s t test in (g, i, j). All in situ hybridisation data are representative of at least three independent experiments. White arrowheads in (b, f) indicate the representative signals for Vgll3 or VGLL3 mRNA. Scale bars in bd, f = 30 μm. Source data are provided as a Source Data file.
Fig. 3
Fig. 3. Vgll3 promotes fibrosis-related gene expression in myofibroblasts.
a Representative MA plot of RNA-seq data demonstrating upregulated or downregulated genes by siVgll3 treatment in cardiac myofibroblasts. Red and green dots represent genes downregulated by siVgll3 treatment (M < −0.5, A > 0). Red and green dots represent proteinaceous extracellular matrix genes/extracellular matrix genes and the other genes shown in (b), respectively. b Enrichment analysis of ontology for the genes downregulated by siVgll3 treatment. c mRNA levels of Vgll3 and fibrosis-related genes in cardiac myofibroblasts transfected with siRNA (#1) targeting Vgll3 (n = 5 each). d Protein levels of Collagen I and GAPDH in cardiac myofibroblasts transfected with siRNA (#1) targeting Vgll3 (n = 3 each). e Col1a1 and Col1a2 mRNA levels in NIH3T3 cells overexpressing FLAG-VGLL3 (n = 5 each). f mRNA levels of Vgll3 3′UTR in NIH3T3 cells overexpressing FLAG-VGLL3 (n = 5 each). g mRNA levels of Vgll3 and fibrosis-related genes in hepatic stellate cells isolated from the livers of NASH model mice, and transfected with siRNA (#1) targeting Vgll3 (n = 5 each). h Protein levels of Collagen I and GAPDH in hepatic stellate cells isolated from the livers of NASH model mice, and transfected with siRNA (#1) targeting Vgll3 (n = 3 each). i mRNA levels of VGLL3 and fibrosis-related genes in CCD-18Co transfected with siRNA targeting VGLL3 (n = 5 each). All experiments were conducted at least three times. Data in (ci) are presented as the mean ± SEM. P-values were determined using the one-sided Fisher’s exact test in (b), the two-sided Student’s t test in (cf, h, i), and the two-sided Mann–Whitney’s U test in (g), Source data are provided as a Source Data file.
Fig. 4
Fig. 4. VGLL3 undergoes liquid–liquid phase separation through its glutamic acid-rich low-complexity domain.
a Volcano plot of differential protein profiles in anti-FLAG immunoprecipitates from control and FLAG-VGLL3–overexpressing myofibroblasts. Orange and blue dots represent the proteins (q < 0.1, fold increase >2). Blue dots represent poly-(A) RNA binding and RNA binding proteins. b Enrichment analysis of the ontology for proteins that significantly interact with FLAG-VGLL3. c Interaction between FLAG-VGLL3 and endogenous RBM14 and TDP-43 in cardiac myofibroblasts. d Immunostaining of endogenous VGLL3 and NONO in myofibroblasts. The graph represents line scans along the white line in the yellow dashed square in the inset. e Images of live NIH3T3 cells overexpressing EGFP or EGFP-VGLL3. f Fluorescence recovery after photobleaching (FRAP) analysis of EGFP-VGLL3 puncta in live NIH3T3 cells. The mean intensity of normalised fluorescence was shown in the graph (n = 15). g Effects of 1,6-HD and 2,5-HD treatments on EGFP-VGLL3 puncta in NIH3T3 cells. h Scheme of the primary sequence of mouse VGLL3, with individual amino acids colour-coded by the PLAAC algorithm. Schematic prediction of intrinsic disorder tendency in mouse VGLL3 by IUPred2A. The intrinsically disordered region (IDR; aa 63–78) in mouse VGLL3 is highlighted. All amino acid residues in the IDR region were deleted (ΔIDR) or replaced with glycine (G) and serine (S) residues (GGS) in VGLL3 ΔIDR mutant or GGS mutant, respectively. i Images of live NIH3T3 cells overexpressing EGFP-VGLL3 (WT) and EGFP-VGLL3 mutants (ΔIDR and GGS). The graph represents the percentage of cells harbouring nuclear puncta in the cells (n = 5). j Col1a1 mRNA levels in the cells (n = 8). The protein levels of overexpressed FLAG-VGLL3s in the cells were evaluated by western blotting. All experiments were performed at least three times. Data in (i, j) are shown as the mean ± SEM. P-values were determined using one-way ANOVA followed by Tukey’s range test in (i, j), ***P < 0.001. White dashed circles or white arrowheads in (e, i) mark the nucleus or the representative puncta, respectively. Scale bars = 10 μm. Source data are provided as a Source Data file.
Fig. 5
Fig. 5. The VGLL3/EWSR1 complex in NONO condensates increases collagen expression through attenuation of miR-29b production.
a Micrographs of endogenous VGLL3 puncta detected by immunostaining, and Neat1 mRNA detected by RNA-FISH in cardiac myofibroblasts. b Micrographs of EGFP-VGLL3 puncta and Neat1 mRNA detected by RNA-FISH in NIH3T3 cells. c Micrographs of endogenous NONO puncta detected by immunostaining, and Neat1 mRNA detected by RNA-FISH in myofibroblasts. d Micrographs of endogenous NONO and SFPQ detected by immunostaining in myofibroblasts. e, f Micrographs of EGFP-VGLL3 and endogenous NONO (e) or SFPQ (f) in NIH3T3 cells. g Micrographs of endogenous VGLL3 in myofibroblasts treated with PBS or RNase A. Summed intensity of VGLL3-signal per nucleus is shown in graph (n = 15 cells/group). h mRNA levels of Ewsr1 and fibrosis-related genes in cardiac myofibroblasts transfected with siRNA targeting Ewsr1 (n = 5 each). i Vgll3, Ewsr1 and Col1a1 mRNA levels in myofibroblasts transfected with siRNA targeting Vgll3, Ewsr1, or both Vgll3/Ewsr1 (n = 5 each). j Interaction between HA-VGLL3 and FLAG-EWSR1 in HEK293 cells. k Endogenous interaction between VGLL3 and EWSR1 in myofibroblasts analysed by parallel reaction monitoring (PRM) mass spectrometry of immunoprecipitants with anti-VGLL3 antibody. Western blot images of cell lysates used in the PRM analysis are shown in the left. l, m Images of live NIH3T3 cells transfected with EGFP-VGLL3 and RFP-EWSR1 (l) or EGFP-VGLL3, RFP-EWSR1, and BFP-NONO (m). np miR-29b levels in myofibroblasts transfected with siRNA targeting Ewsr1 (n), Vgll3 (o) or Ddx5 (p) (n = 5–6). All experiments were performed at least three times. Data in (gi, n, o, p) are shown as the mean ± SEM. P-values were determined using the two-sided Student’s t test in (g, h, n, o, p), and one-way ANOVA followed by Tukey’s range test in (i), **P < 0.01, ***P < 0.001. White dashed circles mark the nucleus. The graphs represent line scans along the white lines in the yellow dashed square in the insets on (af, l, m). Scale bars in (ag, l), and m = 10 μm. Source data are provided as a Source Data file.
Fig. 6
Fig. 6. Vgll3 deficiency in mice attenuates cardiac fibrosis and impairs cardiac dysfunctions after myocardial infarction.
a mRNA levels of Col1a1, Col1a2 and Vgll3 in sham (S)-operated ventricles, and in the remote (R) and infarcted (I) areas of wild-type (WT) and Vgll3 knock-out (KO) mouse hearts, 3 days after MI (WT: S/R/I, n = 7/12/12; KO: S/R/I, n = 5/5/5). b mRNA levels of Col1a1, Col1a2 and Vgll3 in cardiac myofibroblasts isolated from WT and Vgll3 KO mouse hearts, 3 days after MI (WT: n = 5; KO: n = 5). c Immunostaining images of heart sections of WT and Vgll3 KO mice on day 4 after MI. EdU were injected into the mice 24 h before sampling. White arrowheads indicate EdU+ and PDGFRα + fibroblasts. The percentages of EdU+ cells in total PDGFRα + fibroblasts of border or infarcted area are shown in the graph (WT: n = 8; KO: n = 5). d miR-29b levels in infarcted areas of WT and Vgll3 KO mouse hearts, 3 days after MI (n = 5 each). e Images of heart sections of WT and Vgll3 KO mice, 28 days after MI, stained with Picro-Sirius red. f The collagen volume fraction (CVF) was calculated as the percentage of Picro-Sirius red-positive collagen deposition area (WT: Sham/MI, n = 8/14; KO: Sham/MI, n = 5/6). g Echocardiographic measurements of the ejection fraction (EF) and fractional shortening (FS), 28 days after MI (WT: Sham/MI, n = 8/18; KO: Sham/MI, n = 5/7). h Schematic of the VGLL3-mediated signalling pathway that enhances collagen gene expression in myofibroblasts. Data in (ad, f, g) are shown as the mean ± SEM. P-values were determined using one-way ANOVA followed by Tukey’s range test in (a) (Col1a1 and Col1a2), Kruskal–Wallis followed by Dunn’s test in (a) (Vgll3), two-sided Student’s t test in (b, d, f), and two-sided Mann–Whitney’s U test in (c, g), *P < 0.05, ***P < 0.001. n.s.; not statistically significant. Scale bars in c = 20 μm, e = 1 mm. Source data are provided as a Source Data file.

References

    1. Tallquist MD. Cardiac fibroblast diversity. Annu. Rev. Physiol. 2020;82:63–78. doi: 10.1146/annurev-physiol-021119-034527. - DOI - PMC - PubMed
    1. Distler JHW, et al. Shared and distinct mechanisms of fibrosis. Nat. Rev. Rheumatol. 2019;15:705–730. doi: 10.1038/s41584-019-0322-7. - DOI - PubMed
    1. Henderson NC, Rieder F, Wynn TA. Fibrosis: from mechanisms to medicines. Nature. 2020;587:555–566. doi: 10.1038/s41586-020-2938-9. - DOI - PMC - PubMed
    1. Bochaton-Piallat, M. L., Gabbiani, G. & Hinz, B. The myofibroblast in wound healing and fibrosis: answered and unanswered questions. F1000Research5, F1000 Faculty Rev-752 (2016). - PMC - PubMed
    1. Pakshir P, et al. The myofibroblast at a glance. J. Cell Sci. 2020;133:jcs227900. doi: 10.1242/jcs.227900. - DOI - PubMed

Publication types