. 2023 Feb 9;14(1):700.
doi: 10.1038/s41467-023-36424-0.

TRIM40 is a pathogenic driver of inflammatory bowel disease subverting intestinal barrier integrity

Affiliations

TRIM40 is a pathogenic driver of inflammatory bowel disease subverting intestinal barrier integrity

Sujin Kang et al. Nat Commun. .

Abstract

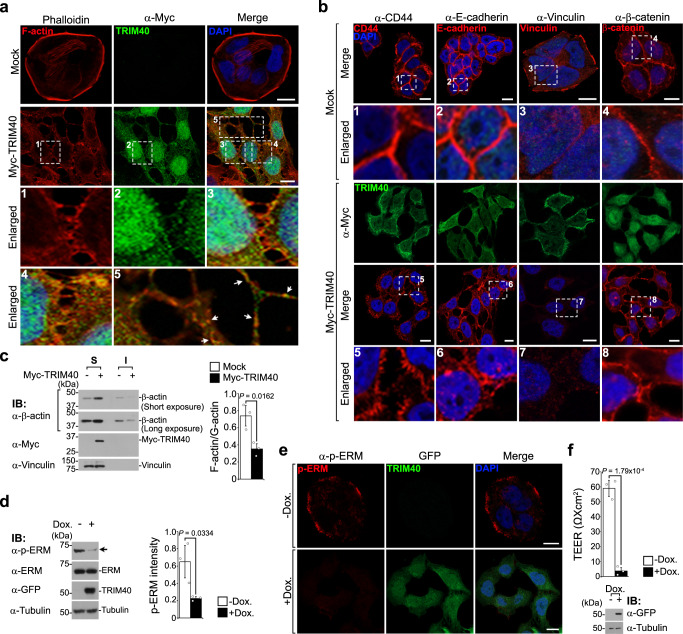
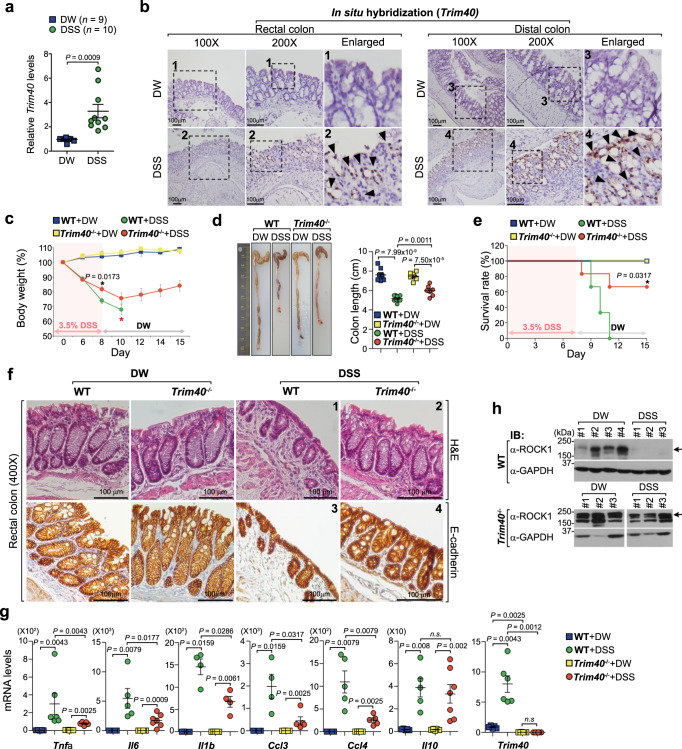
The cortical actin cytoskeleton plays a critical role in maintaining intestinal epithelial integrity, and the loss of this architecture leads to chronic inflammation, as seen in inflammatory bowel disease (IBD). However, the exact mechanisms underlying aberrant actin remodeling in pathological states remain largely unknown. Here, we show that a subset of patients with IBD exhibits substantially higher levels of tripartite motif-containing protein 40 (TRIM40), a gene that is hardly detectable in healthy individuals. TRIM40 is an E3 ligase that directly targets Rho-associated coiled-coil-containing protein kinase 1 (ROCK1), an essential kinase involved in promoting cell-cell junctions, markedly decreasing the phosphorylation of key signaling factors critical for cortical actin formation and stabilization. This causes failure of the epithelial barrier function, thereby promoting a long-lived inflammatory response. A mutant TRIM40 lacking the RING, B-box, or C-terminal domains has impaired ability to accelerate ROCK1 degradation-driven cortical actin disruption. Accordingly, Trim40-deficient male mice are highly resistant to dextran sulfate sodium (DSS)-induced colitis. Our findings highlight that aberrant upregulation of TRIM40, which is epigenetically silenced under healthy conditions, drives IBD by subverting cortical actin formation and exacerbating epithelial barrier dysfunction.


Conflict of interest statement

The authors declare no competing interests.

Figures

Fig. 1
Fig. 1. TRIM40 upregulation is associated with IBD pathogenesis through morphological and cytoskeletal alterations.
a Venn diagram illustrating the overlap among differentially expressed genes from UC and CD patients, and healthy controls. b TRIM69 or TRIM40 expression in RNA-seq data from IBD (GSE117993) compared with normal tissues from the Genotype-Tissue Expression project. Bold letters; normal intestinal tissues. c, d Comparison of TRIM40 expression in the rectum and ileum (c) or rectal mucosa (d) between UC, CD, and normal samples (GSE117993, GSE57945, and GSE109142). P values are determined by unpaired two-tailed t test. (n, numbers of patients; mean ± SD). n.s.; not significant. e qPCR showing TRIM40 mRNA levels in IBD compared with normal tissues. P values are determined by unpaired two-tailed t test. (n, numbers of patients; mean ± SD). f IHC analysis of TRIM40 on control, UC, or CD patients. The mean IHC score ± SD of all samples from controls, UC, or CD was 0.3 ± 0.17, 2.0 ± 0.71, 1.9 ± 0.17, respectively (×100). P values are determined by unpaired two-tailed t test. (n = 4 biologically independent samples; mean ± SD). Enlarged views of the regions (#1–3) are denoted by the black dashed squares. Scale bars, 100 μm. g Heat map showing the relative expression of the indicated genes by RNA-seq in control vector- or Myc-TRIM40-expressing HT-29 cells. The selected genes in the heat map were ISGs and cytoskeleton-related genes. Red or blue colors represent high- or low-fold change, respectively. O.E.; overexpression. RNA-seq results were obtained in two independent experiments (#1, #2). h qPCR showing relative mRNA levels of the indicated genes in control vector- or Myc-TRIM40-expressing HT-29 cells. P values are determined by unpaired two-tailed t test. (n  =  3 biological independent experiments, mean ± SD). i, j Microscopic analysis showing morphological deformation in control or GFP-TRIM40-expressing HT-29 cells. Scale bars, 10 µm. Graphs showing comparison of cell-to-cell distance in control or GFP-TRIM40-expressing HT-29 cells. The distance was analyzed by ImageJ software (V 1.8.0) and P values are determined by unpaired two-tailed t test. (n, biologically independent measurements of the distance between cells; mean ± SD). Source data are provided as a Source Data file.
Fig. 2
Fig. 2. TRIM40 disrupts epithelial integrity by destabilizing cortical actin cytoskeleton.
a, b Confocal fluorescent images of HT-29 cells expressing control vector or Myc-TRIM40. Cells were stained with anti-Myc antibody (Myc-TRIM40, green) and phalloidin (F-actin, red) (a). For confocal microscopy analysis of proteins located in cell-to-cell junctions, cells were stained with anti-Myc antibody (Myc-TRIM40, green) and anti-CD44, anti-E-cadherin, anti-Vinculin, or anti-β-catenin antibodies (AJ proteins, red) (b). Enlarged views of the regions are denoted by the white dashed squares. White arrows in image #5 represent the partial colocalization of TRIM40 with irregular accumulation of F-actin on filamentous stretches. Nuclei were stained with 4′,6-diamidino-2-phenylindole (DAPI, blue). Scale bars, 10 µm. (n  ≥ 3 biological independent experiments). c Immunoblots showing β-actin levels in soluble (S) and insoluble (I) fractions from HT-29 cells expressing control vector or Myc-TRIM40. Graphs showing the ratios of F-actin to G-actin. Vinculin was used as a loading control. d Immunoblots showing decreased p-ERM levels in HT-29 cells temporally overexpressed GFP-TRIM40 by using a doxycycline-inducible system. Quantification of the band intensity of p-ERM (right graph). Tubulin was used as a loading control. e Confocal fluorescent images of GFP-TRIM40 (green) and phosphorylated ERM (p-ERM, red) in doxycycline-induced GFP-TRIM40-overexpressing cells. Cells were treated with doxycycline (2 μg ml−1) for 48 h and were stained with DAPI (blue). Scale bars, 10 µm. f Transepithelial electrical resistance (TEER) values of Caco-2 cells temporally overexpressed GFP-TRIM40 by doxycycline treatment. P values are determined by unpaired two-tailed t test in c, d, f. (n  =  3 biological independent experiments, mean ± SD). All data are representative of three independent experiments and source data are provided as a Source Data file.
Fig. 3
Fig. 3. TRIM40 regulates RhoA–ROCK1 signaling by promoting ROCK1 degradation.
a Schematic representation of actin cytoskeleton signaling pathways by Rho family GTPases. b Immunoblot analysis for the expression of signaling proteins associated with the actin cytoskeleton in HT-29 cells expressing control vector or Myc-TRIM40. Cell extracts were analyzed using the indicated antibodies. For p-LIMK1 levels, lysates from cells expressing LIMK1-Myc with control vector or Flag-TRIM40 were immunoblotted with the indicated antibodies. Tubulin and GAPDH were used as a loading control. c Immunoblot analysis of ROCK1, p-CFL1, and CFL1 levels in FHC cells expressing control vector or Myc-TRIM40. Cell lysates were analyzed using the indicated antibodies. Tubulin was used as a loading control. d Immunoblot analysis of ROCK1 protein levels in HT-29 cells expressing control vector or Myc-TRIM40 after treatment with MG132 (10 µM) or chloroquine (CQ, 10 µM) for 12 h. Cell lysates were analyzed using the indicated antibodies. Tubulin was used as a loading control. e Co-immunoprecipitation of TRIM40 with ROCK1 in HT-29 cells expressing control vector or Myc-TRIM40. Cells were treated with MG132 (20 µM) for 4 h and cell lysates were immunoprecipitated with anti-Myc antibodies and then analyzed by immunoblotting with the indicated antibodies. f Immunoblots showing ROCK1 ubiquitination in HT-29 cells expressing control vector or Myc-TRIM40. Cells were treated with MG132 (10 µM) for 12 h and lysed. Cell lysates were immunoprecipitated with anti-ROCK1 antibodies and analyzed by immunoblotting with indicated antibodies. Tubulin was used as a loading control. All data are representative of three independent experiments and source data are provided as a Source Data file.
Fig. 4
Fig. 4. The RING, B box, and C-terminal domains of TRIM40 are required for ROCK1 degradation.
a Schematic representation of full-length TRIM40 (WT) and TRIM40 mutants. ∆RING, ∆BB, ∆CC, or ∆CT lacks RING, B-box, coiled-coil, or C-terminal region, respectively. TRIM40-C29S substitutes cysteine with serine at 29 residue. b Immunoblots showing ROCK1 ubiquitination in control vector-, WT-TRIM40-, or TRIM40∆RING-expressing HT-29 cells. c Immunoblots of ROCK1 levels in HT-29 cells expressing WT-TRIM40 or TRIM40 mutants. Quantification of ROCK1 band intensity relative to tubulin band intensity (bottom graph). The asterisk, dimeric forms of TRIM40∆CT. d Immunoblot analysis of ROCK1 levels in HT-29 cells expressing control vector, WT-TRIM40, or TRIM40-C29S. Quantification of ROCK1 band intensity relative to tubulin band intensity in lysates (bottom graph). e Confocal images showing cortical F-actin in HT-29 cells expressing control vector, WT-TRIM40, TRIM40 deletion, or TRIM40-C29S. Cells were stained with phalloidin for cortical F-actin (red) and anti-Myc antibody for WT-TRIM40, TRIM40 deletion, or TRIM40-C29S mutants (green). Nuclei were stained with DAPI (blue). Scale bars, 10 μm. f Co-immunoprecipitation of TRIM40 mutants with ROCK1 in HT-29 cells expressing control vector, WT-TRIM40, or TRIM40 deletion mutants. After MG132 (20 µM) treatment, lysates were immunoprecipitated with anti-Myc antibody, and analyzed by immunoblotting with the indicated antibodies. *; dimeric forms of TRIM40∆CT. g Graph showing comparison of cell-to-cell distance in HT-29 cells expressing control vector (n = 52), WT-TRIM40 (n = 77), TRIM40∆RING (n = 83), TRIM40∆BB box (n = 51), and TRIM40∆CT (n = 47). The distance was analyzed by ImageJ software (V 1.8.0) and P values are determined by unpaired two-tailed t test. (n, biologically independent measurements of the distance between cells; mean ± SD). h TEER assay for intestinal epithelial barrier function in Caco-2 cells expressing control vector, WT-TRIM40, or TRIM40 deletion mutants. P values are determined by unpaired two-tailed t test in (c, d, h). (n  =  3 biological independent experiments, mean ± SD). All Data are representative of three independent experiments and source data are provided as a Source Data file.
Fig. 5
Fig. 5. Trim40-deficient mice were less susceptible to DSS-induced colitis.
a qPCR showing relative mRNA levels of Trim40 in 2% DSS-induced colitis. Trim40 expression was analyzed in colon tissue from WT male mice (DW, n = 9; DSS, n = 10). P values are determined by unpaired two-tailed t test. (n, numbers of mice; mean ± SD). b ISH showing Trim40 mRNA levels in rectal or distal colon tissues from WT male mice with 2% DSS. Brown (black arrowheads) indicates Trim40 mRNA expression. Enlarged views of the regions are denoted by the black dashed squares (#1–4). Scale bars, 100 μm. c Relative loss of body weight in male mice with 3.5% DSS. WT (DW, n = 3; DSS, n = 6), Trim40−/− (DW, n = 4; DSS, n = 6). P values are determined by unpaired two-tailed t test. (n, numbers of mice; mean ± SEM). Red asterisk indicates that most control mice died within 10 days of DSS administration. d Images of colon length of male mice at day 7 after 2% DSS administration. WT (DW, n = 8; DSS, n = 10), Trim40−/− (DW, n = 7; DSS, n = 7). Graph showing colon length of mice (WT and Trim40−/−) after DSS administration (right). P values are determined by unpaired two-tailed t test. (n, numbers of mice; mean ± SD). e Survival curve of male mice treated with 3.5% DSS for 8 days, followed by normal water for 7 days. WT (n = 9), Trim40−/− male mice (n = 10). P value is determined by log-rank test. (n, numbers of mice). f Representative H&E staining and IHC staining with E-cadherin of the rectum from WT and Trim40−/− male mice at day 3 after 1% DSS. Scale bars, 100 µm. g qPCR showing relative mRNA levels of the indicated genes in 2% DSS-induced colitis. P values are determined by Mann–Whitney U Test. (n  ≥  4 biological independent mice; mean ± SD). n.s.; not significant. h ROCK1 protein levels in the rectal region from WT and Trim40−/− male mice with 2.5% DSS for 3 days. All data are representative of three independent experiments and source data are provided as a Source Data file.
Fig. 6
Fig. 6. Proposed model of upregulated TRIM40-driven IBD initiation and progression.
The upregulated expression of typically epigenetically silenced TRIM40 acts as a pathogenic driver of IBD. The proposed mechanism involves the direct targeting of ROCK1 degradation and cortical actin disruption, which accelerates the destruction of epithelial integrity and function, the transition of short- to long-lived inflammation, and ultimately leads to severe intestinal tissue damage (image created with BioRender.com).

References

    1. Maloy KJ, Powrie F. Intestinal homeostasis and its breakdown in inflammatory bowel disease. Nature. 2011;474:298–306. - PubMed
    1. Lechuga S, Ivanov AI. Actin cytoskeleton dynamics during mucosal inflammation: a view from broken epithelial barriers. Curr. Opin. Physiol. 2021;19:10–16. - PMC - PubMed
    1. Mostowy S, Shenoy AR. The cytoskeleton in cell-autonomous immunity: structural determinants of host defence. Nat. Rev. Immunol. 2015;15:559–573. - PMC - PubMed
    1. Wu SK, et al. Cortical F-actin stabilization generates apical-lateral patterns of junctional contractility that integrate cells into epithelia. Nat. Cell Biol. 2014;16:167–178. - PubMed
    1. Chalut KJ, Paluch EK. The actin cortex: a bridge between cell shape and function. Dev. Cell. 2016;38:571–573. - PubMed

Publication types