. 2023 Apr;616(7956):319-325.
doi: 10.1038/s41586-022-05647-4. Epub 2023 Feb 8.

An E1-E2 fusion protein primes antiviral immune signalling in bacteria

Affiliations

An E1-E2 fusion protein primes antiviral immune signalling in bacteria

Hannah E Ledvina et al. Nature. 2023 Apr.

Erratum in

Abstract

In all organisms, innate immune pathways sense infection and rapidly activate potent immune responses while avoiding inappropriate activation (autoimmunity). In humans, the innate immune receptor cyclic GMP-AMP synthase (cGAS) detects viral infection to produce the nucleotide second messenger cyclic GMP-AMP (cGAMP), which initiates stimulator of interferon genes (STING)-dependent antiviral signalling1. Bacteria encode evolutionary predecessors of cGAS called cGAS/DncV-like nucleotidyltransferases2 (CD-NTases), which detect bacteriophage infection and produce diverse nucleotide second messengers3. How bacterial CD-NTase activation is controlled remains unknown. Here we show that CD-NTase-associated protein 2 (Cap2) primes bacterial CD-NTases for activation through a ubiquitin transferase-like mechanism. A cryo-electron microscopy structure of the Cap2-CD-NTase complex reveals Cap2 as an all-in-one ubiquitin transferase-like protein, with distinct domains resembling eukaryotic E1 and E2 proteins. The structure captures a reactive-intermediate state with the CD-NTase C terminus positioned in the Cap2 E1 active site and conjugated to AMP. Cap2 conjugates the CD-NTase C terminus to a target molecule that primes the CD-NTase for increased cGAMP production. We further demonstrate that a specific endopeptidase, Cap3, balances Cap2 activity by cleaving CD-NTase-target conjugates. Our data demonstrate that bacteria control immune signalling using an ancient, minimized ubiquitin transferase-like system and provide insight into the evolution of the E1 and E2 machinery across domains of life.


Conflict of interest statement

Competing Interest

The University of Colorado Boulder and the University of California San Diego have patents pending for Cap2 and Cap3 technologies on which H.E.L., Q.Y., Y.G., K.D.C., and A.T.W are listed as inventors.

Figures

Extended Data Figure 1.
Extended Data Figure 1.. Phage protection assays, inputs for IPs, and CD-NTase antibody verification along with CryoEM information.
(a) Image of double agar overlay phage infection assay used to measure efficiency of plating for a lysate of phage T2. E. coli MG1655 expressing the indicated vectors is shown. Zones of clearance (plaques) represent successful phage infection and replication. Apparent plaque forming units (PFU) per mL is calculated for the lysate infecting each bacterial genotype. Fold protection is the PFU per mL of empty vector divided by Vc CBASS, ~104 in this assay. (b) Efficiency of plating of the indicated phage when infecting E. coli expressing CBASS with the indicated genotype. Data plotted as in Fig. 1b. C.D. CD-NTase: DID131AIA.; C.D. capV: C62A. (c) Efficiency of plating of the indicated phage when infecting E. coli expressing V. cholerae CBASS with the indicated genotypes. Data plotted as in Fig. 1b. (d) Western blot analysis of cell lysates (inputs) and αVSV-G immunoprecipitation of E. coli expressing CBASS with the indicated genotypes. These samples correspond to the mass spectrometry in Fig. 1c. αRNAP western blot serves as a loading control for bacterial cells. (−): CBASS operon, CD-NTase without VSV-G; (+): CBASS operon, CD-NTase with N-terminal VSV-G. (e) Whole cell western blot analysis of E. coli expressing either an empty vector (EV) or CBASS (wild-type). αCD-NTase Western blot used a custom CD-NTase antibody; arrow indicates monomeric CD-NTase at the expected molecular weight. αRNAP western blot serves as a loading control for bacterial cells. (f) Efficiency of plating of the indicated phage when infecting E. coli expressing CBASS with the indicated genotypes. Data plotted as in Fig. 1b. (g) Whole cell western blot analysis of E. coli expressing the indicated genotypes of CBASS. Data are the input for the immunoprecipitation presented in Fig. 1d. (h) Whole cell western blot analysis of E. coli expressing the indicated genotypes of CBASS. Data are the input for the immunoprecipitation presented in Fig. 1e. For (f),(g) and (h) ±ϕ indicates phage T2 at an MOI of 2. (i) Operon structure of CBASS from E. cloacae. See Supplementary Table 5 for relevant accession numbers. (j) Size exclusion chromatography elution profile (Superdex 200 Increase 10/300 GL) and SDS-PAGE analysis of E. cloacae Cap2–CD-NTase. The fraction used for cryoEM analysis is shaded in gray. C.D. Cap2: C109A/C548A (k) Representative electron micrograph of E. cloacae Cap2–CD-NTase. (l) Fourier Shell Correlation (FSC) curve for the final refinement of the 2:2 Cap2–CD-NTase complex. (m) 3D FSC analysis for the 2:2 Cap2–CD-NTase complex. (n) Fourier Shell Correlation (FSC) curve for the final refinement of the 2:1 Cap2–CD-NTase complex. (o) 3D FSC analysis for the 2:1 Cap2–CD-NTase complex. (p) Local resolution of the final refined map for the 2:2 Cap2–CD-NTase complex, colored from blue (≤1.8 Å) to magenta (≥4.00 Å). (q) Local resolution of the final refined map for the 2:1 Cap2–CD-NTase complex colored from blue (≤1.8 Å) to magenta (≥4.00 Å). Outline indicates the areas of missing density compared to the 2:2 Cap2–CD-NTase complex.
Extended Data Figure 2.
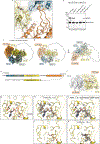
Extended Data Figure 2.. The CD-NTase rigidifies Cap2 through a bipartite interaction and crystal structures of an E. cloacae Cap2 E1-CD-NTase fusion.
(a) Closeup view of the interaction between Cap2 (yellow/blue) and CD-NTase (orange), with key residues shown as sticks and labeled. (b) Coomassie stained SDS-PAGE of proteins that purified by Ni2+-affinity chromatography from E. coli co-expressing E. cloacae 6×His-tagged cd-ntase (His6-CD-NTase) and catalytically inactivated cap2 (C548A/C109A; C.D.) with the indicated genotype. (c) CryoEM density for 2:1 Cap2–CD-NTase complex, with domains labeled and colored as in Fig. 2b. Outline indicates the areas of missing density compared to the 2:2 Cap2–CD-NTase complex, including one protomer of CD-NTase and the E2 and linker domains for the (a) protomer of Cap2. (d) Two views of the 2:1 Cap2–CD-NTase complex, with domains labeled and colored as in panel (c). Outlines indicate the areas of missing density compared to the 2:2 Cap2–CD-NTase complex. (e) Design of a fusion between the C-terminal E1 domain of E. cloacae Cap2 (residues 363–600) and the C-terminus of CD-NTase (residues 370–381), with a three-residue GSG linker. (f) 2.1 Å resolution crystal structure of the E. cloacae Cap2–CD-NTase fusion crystallized in the presence of ATP, with two Cap2 E1 domains colored yellow and gray, and the two CD-NTase C-termini colored orange. See also Extended Data Table 2. (g) Closeup of the Cap2 adenylation active site, showing the CD-NTase–AMP conjugate and active site residues. Residues 533–546 are disordered and represented by a dotted line. Bound Mg2+ ion is shown in black. (h) View as in (g), with 2FO-FC electron density contoured at 1.0 σ around the CD-NTase–AMP conjugate and active site residues. (i) View as in (g), with FO-FC omit map density contoured at 1.5 σ around the CD-NTase–AMP conjugate. (j) Closeup of the Cap2 adenylation active site in a 1.8 Å-resolution structure of the Cap2-CD-NTase fusion crystallized in the absence of added nucleotide (apo state). (k) View as in (j), with 2Fo-Fc electron density contoured at 1.0 σ around the CD-NTase C-terminus.
Extended Data Figure 3.
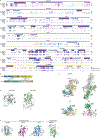
Extended Data Figure 3.. Cap2 is related to autophagy E1 and E2 proteins.
(a) Protein alignment of Cap2 from E. cloacae, Cap2 from V. cholerae, ATG10 from S. cerevisiae (4EBR), and ATG7 from S. cerevisiae (3T7H). Domains are indicated above the alignment with colors corresponding to Fig. 2. The secondary structure of Cap2 from E. cloacae is indicated in purple with alpha helices depicted as cylinders and beta sheets as arrows. The catalytic cysteines found in the E2 and E1 domains are highlighted in red. See Supplementary Table 5 for relevant accession numbers. (b) Domain schematic of E. cloacae Cap2 and S. cerevisiae ATG7, with approximate root-mean-squared distance (Cα r.m.s.d.) values for the linker/NTD and E1 domains noted. (c) Structures of E. cloacae Cap2 (left), compared to S. cerevisiae ATG7 (right; PDB ID 4GSK), with one protomer colored as in panel (a) and the dimer mate colored gray. For each protein, the E1 active-site cysteine residue (C548 for Cap2, C507 for ATG7) is shown as a sphere and labeled. (d) Structures of the E. cloacae Cap2 linker domain (left), compared to the S. cerevisiae ATG7 NTD (right; PDB ID 4GSK). ATG7 features a second subdomain (residues 147–268, shown in white) inserted into the loop separating β-strands 6 and 7 (labeled) where Cap2 has a partially disordered loop (residues 319–356). (e) Structure of the Cap2 E2 domain (active-site C109 shown as a sphere), compared to Kluyveromyces marxianus ATG10 (PDB ID 3VX7), S. cerevisiae ATG3 (PDB ID 2DYT), and Homo sapiens UBE2D2 (PDB ID 4DDG). Structural features not shared are shown in white. The active-site cysteine of each protein is shown as a sphere.
Extended Data 4.
Extended Data 4.. Analysis of Cap2 mutants and epitope-tagged CD-NTase and evidence that Cap2 conjugates the CD- NTase C-terminus to a target.
(a) Efficiency of plating of the indicated phage when infecting E. coli expressing CBASS with the indicated genotype. Data plotted as in Fig. 1b. (b) Efficiency of plating of the indicated phage when infecting E. coli expressing CBASS with the indicated genotype. Data plotted as in Fig. 1b. (c) Western blot analysis of cell lysates from E. coli expressing CBASS with the indicated genotypes demonstrating that the mutations do not affect expression levels. (d) Western blot analysis of cell lysates from E. coli expressing CBASS with the indicated genotypes demonstrating that the mutations do not affect protein expression levels. (e) SDS-PAGE analysis of E. cloacae Cap2 activity assay. The indicated genotypes of His6-Cap2 and the CD-NTase were expressed from a single plasmid and the formation of a CD-NTase–His6-Cap2 conjugate was used as an indicator of Cap2 activity. (−): no CD-NTase; (+): wild-type CD-NTase; (ΔC): CD-NTase lacking its C-terminal 19 residues; C.D. Cap2: C548A/C109A. Blue asterisk indicates a putative intermediate with CD-NTase thioester-linked to the Cap2 E1 catalytic cysteine (C548). The formation of a CD-NTase–Cap2 conjugate in the absence of a functional E1 catalytic cysteine (C548A) indicates that in vitro, this residue is dispensable for catalysis and the nearby E2 catalytic cysteine (C109) can function in instead. (f) Cap2 E1 active site (yellow) in Cap2–CD-NTase cryoEM structure with the residues mutated in (a) indicated and the E1 active-site cysteine residue (C548 for Cap2) shown as a sphere and labeled. The CD-NTase C-terminus (orange) conjugated to AMP (black). (g) Left: SDS-PAGE analysis of Ni2+-purified E. cloacae His6-Cap2, expressed either alone or with full-length CD-NTase. Right: Protease treatment (TEV or Cap3) of the CD-NTase–His6-Cap2 conjugate. (h) Schematic of the inferred CD-NTase–His6-Cap2 conjugate formed upon coexpression of E. cloacae His6-Cap2 and CD-NTase, with cleavage sites for Cap3 and TEV protease indicated. (i) SDS-PAGE analysis with detection by coomassie (left) or αHA western blot (right) of αHA immunoprecipitated E. cloacae Cap2 coexpressed with HA-CD-NTase. C.D. Cap2: C548A/C109A. Red asterisk indicates band used for tryptic mass spectrometry analysis in (f-g). (j) Peptides detected in tryptic mass spectrometry of the marked band in €, showing conjugation of CD-NTase to the N-terminus of a second HA-CD-NTase molecule. See Supplementary Table 7 for mass spectrometry data. (k) Collision-induced dissociation mass spectrum of the peptide indicated in (f), with b1 peak indicated (mass of 350.1533 is that of Met+(H+)+(Phe-Ala)). (l) SDS-PAGE analysis of Ni2+-purified E. cloacae His6-Cap2 with CD-NTase with the indicated genotype.
Extended Data Figure 5.
Extended Data Figure 5.. The C-terminus of the CD-NTase is conserved in type II CBASS systems and the quantification of CD-NTase-mediated second messenger generation.
(a) Sequence logos of C-terminal 10 residues of the CD-NTase in type I (2284 sequences), type II (1556 sequences), and type II (short) (593 sequences) CBASS systems. Type II (short) CBASS systems encode an E2 ubiquitin transferase-like enzyme without a linked E1 domain, and do not encode a JAB isopeptidase. (b) Phylogenetic tree adapted from Whiteley et al., with sequence logos of the C-terminus for CD-NTase clades analyzed in Cap3 experiments (Fig. 4d, Extended data Fig. 6d–g) shown. Saturated colors bordered with solid lines depict branches of the tree that contain type II systems, whereas the de-saturated colors bordered with dashed lines depict clades with non-type II systems. The CD-NTases used in this study are listed below each sequence logo. Blue circles with numbers represent CD-NTase numbers as reported previously. (c) cGAMP generated by αVSV-G immunoprecipitation from E. coli expressing CBASS operons with the indicated genotypes. Western blots of input are in (e) and immunoprecipitation in (f). N=3 technical replicates representative of three independent biological replicates. Data is presented as the mean values ± the SEM. ϕ (−): no infection; ϕ (+): phage T2 at an MOI of 2; CapV (+): wild-type; CapV (C.D.): S62A; CD-NTase (+): wild-type; CD-NTase (C.D.): DID131AIA; CD-NTase (V): N-terminal VSV-G epitope tagged CD-NTase; Cap3 (+): wild-type; Cap3 (Δ): genetically deleted cap3; Cap2 (+): wild-type; Cap2 (F): C-terminal 3x-FLAG epitope tagged Cap2; Cap2 (E1): C522A; Cap2 (E2): C90A. (d) Data in (c) presented on a log10 scale. (e) Whole cell western blot analysis of E. coli expressing CBASS with the indicated genotype. Data corresponds to the input for the immunoprecipitation shown in (a) and (b). (f) Western blot analysis of αVSV-G immunoprecipitation of E. coli expressing CBASS with the indicated genotypes. These data correspond to the samples used to measure cGAMP synthesis in (c) and (d). (g) Quantification of the cGAMP produced by the V. cholerae CD-NTase with, or without, a C-terminal GFP fusion. (h) Quantification of the cAAG produced by the E. cloacae CD-NTase with, or without, a C-terminal GFP fusion. For (g) and (h) N=3 independent biological replicates and the data is presented as the mean ± the SD.
Extended Data Figure 6.
Extended Data Figure 6.. Cap3 overexpression inhibits phage protection by cognate CBASS.
(a) Efficiency of plating of the indicated phage when infecting E. coli expressing CBASS with the indicated genotype. cd-ntase-VSV-G (−): wild-type CD-NTase; cd-ntase-VSV-G (+): C-terminal VSV-G epitope tagged CD-NTase; wild-type indicates otherwise a full CBASS operon; Δcap3: CBASS operon with only cap3 deletion. Data plotted as in Fig. 1b. (b) Western blot analysis of cell lysates from E. coli expressing CBASS with the indicated genotypes, abbreviated as in (a). Cells were infected with phage T5 at an MOI of 2 for the indicated time prior to harvesting for analysis. (c) Efficiency of plating of the indicated phage when infecting E. coli expressing CBASS Δcap3 in the absence or presence of overexpressed cap3 with the indicated genotype. Data plotted as in Fig. 4a. C.D. cap3: HTH101ATA. A Two-sided Student’s t-test was used to calculate significance; n.s., p>0.05; *, p<0.05; **, p<0.001. See Extended data Fig. 6h for protein alignment. (d) Efficiency of plating of the indicated phage when infecting E. coli expressing a full CBASS operon from V. cholerae in the absence or presence of overexpressed cap3 from another CBASS system, indicated on the x-axis. Data plotted as in Fig. 4a. (e) Efficiency of plating of the indicated phage when infecting E. coli expressing a full CBASS operon from E. cloacae in the absence or presence of overexpressed cap3 from another CBASS system, indicated on the x-axis. Data plotted as in Fig. 4a. (f) Efficiency of plating of the indicated phage when infecting E. coli expressing a full CBASS operon from C. freundii in the absence or presence of overexpressed cap3 from another CBASS system, indicated on the x-axis. Data plotted as in Fig. 4a. (g) Efficiency of plating of the indicated phage when infecting E. coli expressing a full CBASS operon from E. coli in the absence or presence of overexpressed cap3 from another CBASS system, indicated on the x-axis. Data plotted as in Fig. 4a. For (d-g) the red dashed boxes indicated the data utilized in Fig. 4d, See Supplementary Table 5 for relevant accession numbers. (h) Protein alignment of the JAMM/JAB protease Sst2 from S. pombe (Uniprot ID Q9P371; residues 235–435), Cap3 from E. cloacae, and Cap3 from V. cholerae. The active site glutamate, as well as two zinc-coordinating histidine residues, are noted. For experiments using Cap3 from E. cloacae, the first 16 annotated amino acids (green box) were removed as we found the translation start site is likely misannotated for this gene. See Supplementary Table 5 for relevant accession numbers.
Extended Data Figure 7.
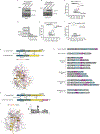
Extended Data Figure 7.. Cap3 cleavage of a CD-NTase model substrate.
(a) Domain schematic and predicted structure/model of the V. cholerae Cap3-CD-NTase complex and with the CD-NTase C-terminus and Zn2+ ion manually modeled from an overlay with a structure of S. pombe Sst2 bound to ubiquitin (PDB ID 4K1R). (b) Summary of tryptic digest mass spectrometry analysis of the V. cholerae Cap3-treated CD-NTase bands as in Fig. 4b. Pink arrow indicates the inferred Cap3 cleavage site; gray arrows indicate trypsin cleavage sites. See Supplementary Table 3 for data. (c) Coomassie stained SDS-PAGE of a V. cholerae model substrate (CD-NTase-GFP fusion protein) with the indicated mutations in the CD-NTase C-terminus, with and without incubation with V. cholerae Cap3. (d) Domain schematic and predicted structure/model of the E. cloacae Cap3-CD-NTase complex with the CD-NTase C-terminus and Zn2+ ion manually modeled from an overlay with a structure of S. pombe Sst2 bound to ubiquitin (PDB ID 4K1R). (e) Coomassie stained SDS-PAGE of an E. cloacae model substrate (CD-NTase-GFP fusion protein) with the indicated mutations in the CD-NTase C-terminus, with and without incubation with E. cloacae Cap3. (f) Coomassie stained SDS-PAGE of an E. cloacae model substrate (CD-NTase-GFP fusion protein) incubated with E. cloacae Cap3 with the indicated reaction condition/genotype. (g) Summary of tryptic digest mass spectrometry analysis of the E. cloacae Cap3-treated CD-NTase bands as in (f), showing the putative Cap3 cleavage site. Pink arrow indicates the inferred Cap3 cleavage site; gray arrows indicate trypsin cleavage sites. See Supplementary Table 3 for data.
Extended Data Figure 8.
Extended Data Figure 8.. -NTase immunoprecipitation reveals numerous potential protein targets and Cap2 homologs are found in other bacteria.
CD (a) Western blot analysis of cell lysates generated from E. coli expressing CBASS Δcap3 with the additional indicated genotypes. (b) Western blot analysis of αVSV-G immunoprecipitations generated from E. coli expressing CBASS Δcap3 with the additional indicated genotypes. These samples were used in the mass spectrometry analysis displayed in (c-f). (c) Mass spectrometry of immunoprecipitated VSV-G-CD-NTase as shown in (b). Data are label free quantitation (LFQ) score and fold enrichment comparing immunoprecipitations from bacteria expressing CBASS Δcap3 to a strain expressing CBASS Δcap3 cap2C522A(E1). Both strains encode an N-terminally VSV-G tagged CD-NTase. Cap2 and CD-NTase are represented as colored circles corresponding to Fig. 1a and are labeled. Proteins which we determined were significantly enriched (LFQ> 108 and a fold enrichment >4) are colored in pink. Circles above the dotted line are proteins with peptides identified only in the sample listed on the x-axis. See Supplementary Table 8 for data. (d) Characterization of the predicted functions of the proteins that were significantly enriched in (c). (e) Mass spectrometry of immunoprecipitated VSV-G-CD-NTase as in (c) comparing immunoprecipitations from bacteria expressing CBASS Δcap3 where CD-NTase has an N-terminal VSV-G tag to a strain expressing CBASS lacking a VSV-G tag (negative control). (f) Mass spectrometry of immunoprecipitated VSV-G-CD-NTase as in (c) comparing immunoprecipitations from bacteria expressing CBASS Δcap3 cap2C522A(E1) where CD-NTase has an N-terminal VSV-G tag to a strain expressing CBASS lacking a VSV-G tag (negative control). (g) Top: Structural comparison between E. cloacae Cap2 and a predicted structure/model of Azohydromonas australica Pap2. Cα r.m.s.d. values are reported for superposition of individual domains: E2 domain (52 Cα atoms overlaid), linker (90 Cα atoms), and E1 (133 Cα atoms). Predicted catalytic cysteine residues are noted for each protein. Bottom: Structural prediction of a Pap3 (pink) and the C-terminus of PycC (yellow) from A. australica. Predicted active site residues of Pap3 are shown as sticks with a zinc ion (gray) modeled from a structure of S. pombe Sst2 bound to ubiquitin (PDB ID 4K1R). (h) Structural comparison between E. cloacae Cap2 and a predicted structure/model of the Cap2-like protein from the Xanthamonas arboricola MBL-group operon. Cα r.m.s.d. values are reported for superposition of individual domains: E2 domain (94 Cα atoms overlaid), linker (50 Cα atoms), and E1 (154 Cα atoms). Predicted catalytic cysteine residues are noted for each protein. (i) Predicted structure/model of a complex between X. arboricola JAB domain (pink) and the C-terminus of MBL (yellow). Predicted active site residues of the JAB domain are shown in sticks, with a zinc ion (gray) modeled from a structure of S. pombe Sst2 bound to ubiquitin (PDB ID 4K1R). The conserved glycine residue of MBL (white) is positioned for cleavage. (j) Sequence logo for the C-terminal 9 residues of 268 MBL encoded within MBL-group operons. See also Supplementary Table 9. (k) Operon structure of previously described and proposed phage defense systems that contain E1, E2 and JAB domain containing proteins along with operons of unknown function that contain these domains. Operons are grouped by conserved protein domains. The E1-superfamily these groups is also indicated in paratheses,. Genes are colored by domain type; E1 and E2 domains, blue; JAB domains, purple; all other domains, grey. Metallo-β-lactamase (MBL); metal binding domain (CEHH); tandem β-grasp fold domain containing protein (multi-ub); single β-grasp fold domain containing protein (ub); Domains of unknown function (DUF); genes with no discernable domains (?). See also Supplementary Table 9.
Figure 1:
Figure 1:. Cap2 is essential for CBASS function and directly interacts with the CD-NTase.
(a) Operon structure of CBASS from V. cholerae. See Supplementary Table 5 for relevant accession numbers. (b) Efficiency of plating of phage T2 when infecting E. coli expressing V. cholerae CBASS with the indicated genotype. Data represent fold decrease in plaque forming units compared to bacteria expressing an empty vector. See Extended data Fig. 1b for infections with phages T4, T5, and T6. Catalytically dead (C.D.) cd-ntase: DID131AIA.; C.D. capV: S62A. (c) Mass spectrometry of immunoprecipitated VSV-G-CD-NTase. Data are iBAQ quantitation score and fold enrichment comparing anti-VSV-G (αVSV-G) immunoprecipitations from bacteria expressing wild-type CBASS where the CD-NTase has an N-terminal VSV-G tag to a strain expressing the CBASS operon without a VSV-G tag. Cap2 and CD-NTase are represented as colored circles corresponding to (a) and are labeled. Circles above the dotted line are proteins with peptides only identified in the VSV-G-tagged samples and not untagged control. (d) Western blot analysis of αVSV-G immunoprecipitation from E. coli expressing CBASS with the indicated genotypes. ±ϕ indicates phage T2 at a multiplicity of infection (MOI) of 2. See Extended data Fig. 1g for pre-IP sample analysis. (e) Western blot analysis of αFLAG immunoprecipitation from E. coli expressing CBASS with the indicated genotype. ±ϕ indicates phage T2 at an MOI of 2. See Extended data Fig. 1h for pre-IP sample analysis.
Figure 2:
Figure 2:. Cryoelectron microscopy structure of a Cap2–CD-NTase complex.
(a) Domain schematic of CD-NTase and Cap2 from Enterobacter cloacae and ATG10 and ATG7 from Saccharomyces cerevisiae, with domains colored and labeled to represent similarity. See also Extended data Fig. 3. (b) 2.74 Å resolution cryoEM density for the E. cloacae Cap2–CD-NTase (C.D. Cap2: C109A/C548A) complex, with domains colored as in (a). See also Extended Data Table 1, Extended data Fig. 1i–q, and Supplementary Fig. 2. (c) Two views of the 2:2 heterotetrameric Cap2–CD-NTase complex, with domains colored as in (a). (d) View of one set of active sites in the Cap2–CD-NTase complex, with the E1 and E2 active-site residues (C548 and C109, respectively; both mutated to alanine in this structure) shown as spheres. (e) Efficiency of plating of phage T2 when infecting E. coli expressing CBASS with the indicated genotype. Adenylation residue (adn). Data plotted as in Fig. 1b. See Extended data Fig. 4a for infections with phages T4, T5, and T6.
Figure 3:
Figure 3:. The CD-NTase is the substrate of Cap2.
(a) Cap2 adenylation active site in Cap2–CD-NTase cryoEM structure. The CD-NTase C-terminus (orange) is conjugated to AMP (black). See also Extended data Fig. 2e–k. (b) Sequence logos for the C-terminal 9 residues of 1556 CD-NTase enzymes from diverse type II CBASS or CD-NTases from only the V. cholerae-like group (Clade A1; Extended data Fig. 5d). Data are depicted as bits and signified by the height of each residue. (c) Efficiency of plating by phage T2 when infecting E. coli expressing CBASS with the indicated genotype. Data plotted as in Fig. 1b, see Extended data Fig. 4b for infections with phages T4, T5, and T6. C.D. CD-NTase: DID131AIA. (d) Western blot analysis of αFLAG immunoprecipitation from E. coli expressing CBASS with the indicated genotype. (e) E. cloacae Cap2 activity assay, representing Cap2-mediated catalysis as a fraction of wild-type. The indicated genotypes of Cap2 and CD-NTase were expressed from a single plasmid and the formation of a CD-NTase conjugate was measured (in this assay, CD-NTase is conjugated to the flexible N-terminus of His6-Cap2; see Extended data Fig. 4e–k for details). N=3 independent biological replicates and data are presented as the mean values ± the SD. (−): no protein; (+): wild-type protein; (ΔC): CD-NTase lacking its C-terminal 19 residues; C.D. Cap2: C548A/C109A. See Extended data Fig. 3a for Cap2 protein alignment. (f) Western blot analysis of cell lysates from E. coli expressing empty vector (EV) or capV-cd-ntase-cap2 (CBASS Δcap3) with the indicated genotype. For (d), (e), and (f) adenylation residue (adn). (g) cGAMP generated by αVSV-G immunoprecipitation from E. coli expressing CBASS Δcap3 with the indicated genotype. (−): CD-NTase without VSV-G; (+): CD-NTase with N-terminal VSV-G: C.D. CD-NTase: DID131AIA. See also Extended data Fig. 5c–f. (h) cGAMP generated by αVSV-G immunoprecipitation from E. coli expressing capV-(vsv-g-cd-ntase)-cap2. ±ϕ indicates phage T2 at an MOI of 2. For (g) and (h) N=3 technical replicates representative of three independent biological replicates. Data is presented as the mean values ± the SEM. Two-sided student’s t-test was used to calculate significance; n.s., p>0.05; *, p<0.05 (p-value = 0.0028); **, p<0.001 (p-value<0.0001).
Figure 4:
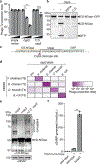
Figure 4:. Cap3 antagonizes CBASS phage defense
(a) Efficiency of plating of phage T2 when infecting E. coli expressing CBASS Δcap3 in the absence or presence of overexpressed cap3 with the indicated genotype. Data plotted as in Fig. 1b. C.D. cap3: HTH101ATA. See Extended data Fig. 6h for protein alignment and Extended data Fig. 6c for infections with phages T4, T5, and T6. (b) Coomassie stained SDS-PAGE of a V. cholerae model substrate (CD-NTase–GFP fusion protein) incubated with V. cholerae Cap3 with the indicated reaction condition/genotype. See Extended data Fig. 7 for cleavage of CD-NTase mutants and for activity assays with E. cloacae Cap3. (c) Summary of tryptic digest mass spectrometry analysis of the Cap3-treated CD-NTase bands as in (b), showing the putative V. cholerae Cap3 cleavage site. See also Extended data Fig. 7b and Supplementary Table 3. (d) Efficiency of plating of the indicated phage when infecting E. coli expressing CBASS and cap3 from the indicated system. All samples contained 500 μM IPTG to induce expression of cap3. See also Extended data Fig. 6d–g. (e) Western blot analysis of cell lysates from E. coli expressing CBASS Δcap3 plus a second vector expressing cap3 with the indicated genotype. C.D. cap3: HTH101ATA. (f) cGAMP generated by αVSV-G immunoprecipitation from E. coli expressing CBASS with the indicated genotype. (−): CD-NTase without VSV-G; (+): CD-NTase with N-terminal VSV-G. See also Extended data Fig. 5c–f. N=3 technical replicates representative of three independent biological replicates. Data is presented as the mean values ± the SEM. Two-sided Student’s t-test was used to calculate significance; n.s., p>0.05; *, p<0.05; **, p<0.001 (p-value<0.0001).
Figure 5:
Figure 5:. Proposed mechanism for the role of Cap2 and Cap3 in CBASS signaling
(a) Model depicting the role of Cap2 and Cap3 in CBASS regulation. Briefly, Cap2 conjugates the CD-NTase to an unknown target via an E1-E2 ubiquitin transferase-like mechanism. CD-NTase conjugation primes the CD-NTase for activation by phage infection. Upon infection, the CD-NTase becomes enzymatically active and generates a cyclic oligonucleotide second messenger which then activates an effector protein. Effector protein activity leads to cell death, inhibiting phage by abortive infection. This process is antagonized by Cap3 protease activity which removes the CD-NTase from target proteins, thereby limiting priming. (b) General operon structure of type I Pycsar systems. Below is a sequence logo for the C-terminal 9 residues of 550 PycC proteins encoded within type I Pycsar. See also Supplementary Table 9. (c) General operon structure of identified type II Pycsar systems. Below is a sequence logo for the C-terminal 9 residues of 55 PycC encoded within type II Pycsar. See also Supplementary Table 9. (d) General structures of operons that encode E1, E2 and JAB domain containing proteins. Genes are colored by domain type; E1 and E2 domains, blue; JAB domains, purple; all other domains, grey. Genes in dashed boxes are not always found within the operons. Operons are grouped by conserved protein domains and the E1-superfamily these groups is also indicated in paratheses. Metallo-β-lactamase (MBL); metal binding domain (CEHH); tandem β-grasp fold domain containing protein (multi-ub); single β-grasp fold domain containing protein (ub). See also Extended data Fig. 8k and Supplementary Table 9.

References

    1. Ni G, Ma Z & Damania B cGAS and STING: At the intersection of DNA and RNA virus-sensing networks. PLOS Pathog. 14, e1007148 (2018). - PMC - PubMed
    1. Whiteley AT et al. Bacterial cGAS-like enzymes synthesize diverse nucleotide signals. Nature 567, 194–199 (2019). - PMC - PubMed
    1. Cohen D et al. Cyclic GMP-AMP signalling protects bacteria against viral infection. Nature 574, 691–695 (2019). - PubMed
    1. Ye Q et al. HORMA Domain Proteins and a Trip13-like ATPase Regulate Bacterial cGAS-like Enzymes to Mediate Bacteriophage Immunity. Mol. Cell 77, 709–722.e7 (2020). - PMC - PubMed
    1. Morehouse BR et al. STING cyclic dinucleotide sensing originated in bacteria. Nature 586, 429–433 (2020). - PMC - PubMed

Publication types

Substances