. 2023 Feb;614(7948):564-571.
doi: 10.1038/s41586-022-05682-1. Epub 2023 Feb 8.

Aberrant phase separation and nucleolar dysfunction in rare genetic diseases

Affiliations

Aberrant phase separation and nucleolar dysfunction in rare genetic diseases

Martin A Mensah et al. Nature. 2023 Feb.

Abstract

Thousands of genetic variants in protein-coding genes have been linked to disease. However, the functional impact of most variants is unknown as they occur within intrinsically disordered protein regions that have poorly defined functions1-3. Intrinsically disordered regions can mediate phase separation and the formation of biomolecular condensates, such as the nucleolus4,5. This suggests that mutations in disordered proteins may alter condensate properties and function6-8. Here we show that a subset of disease-associated variants in disordered regions alter phase separation, cause mispartitioning into the nucleolus and disrupt nucleolar function. We discover de novo frameshift variants in HMGB1 that cause brachyphalangy, polydactyly and tibial aplasia syndrome, a rare complex malformation syndrome. The frameshifts replace the intrinsically disordered acidic tail of HMGB1 with an arginine-rich basic tail. The mutant tail alters HMGB1 phase separation, enhances its partitioning into the nucleolus and causes nucleolar dysfunction. We built a catalogue of more than 200,000 variants in disordered carboxy-terminal tails and identified more than 600 frameshifts that create arginine-rich basic tails in transcription factors and other proteins. For 12 out of the 13 disease-associated variants tested, the mutation enhanced partitioning into the nucleolus, and several variants altered rRNA biogenesis. These data identify the cause of a rare complex syndrome and suggest that a large number of genetic variants may dysregulate nucleoli and other biomolecular condensates in humans.


Conflict of interest statement

D. Hnisz and X.S. are founders and scientific advisors of Nuage Therapeutics. The other authors declare no competing interests.

Figures

Fig. 1
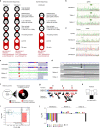
Fig. 1. De novo frameshifts in HMGB1 cause BPTAS.
a, Photographs of individuals diagnosed with BPTAS. Top row, hands of I1, I2 and I5. Note brachydactyly, irregular finger length and hypoplasia of the nails. Bottom row, lower extremities of I1, I2 and I5, presenting with malformed legs, joint contractures, preaxial polysyndactyly and hypoplasia of the nails. b, Radiograms of I1, I2, I4 and I5. Top far left, limb radiograms (at newborn age) of I1 showing brachydactyly and brachyphalangy, tibial aplasia, hypoplastic fibulae and preaxial polysyndactyly. Top middle left, babygram of I2. Note tibial aplasia, hypoplastic and absent fibulae, hypoplastic pelvic bones and hypoplastic right femur. Top middle right, lower extremities of I4 (at 6 months) showing asymmetric shortness of tibiae and fibulae. Top far right, fetogram of I5 showing tibial aplasia, hypoplastic and absent fibulae, hypoplastic pelvic bones and contractures of joints. Bottom row, hand radiograms of I1, I2 (both at newborn age), I4 (at 6 months) and of I5 (at 21 weeks of gestation). Note the short middle phalanges and short proximal phalanges of the thumbs. c, Pathogenic frameshift variants in the acidic tail of HMGB1 in the individuals with BPTAS reported in this article are highlighted in red. Previously reported variants associated with developmental delay are in black. Note the genotype–phenotype correlation: C-terminal frameshifts result in BPTAS, whereas other variants lead to a neurodevelopmental phenotype. d, Amino acid sequence of the C terminus of HMGB1 in individuals with BPTAS and in selected vertebrates. Acidic residues glutamate and aspartate are shaded in red, basic residues arginine and lysine are shaded in blue. Note the replacement of the conserved acidic tail in individuals with BPTAS. e, Family pedigrees. Individuals with BPTAS are highlighted with black boxes, and the genotypes are below the boxes. f, Charge plots of WT and mutant HMGB1. I, individual; L, left; NT, not tested; R, right; WT, wild type.
Fig. 2
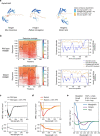
Fig. 2. A BPTAS-causing frameshift alters HMGB1 phase separation in vitro.
a, Graph plotting the intrinsic disorder of HMGB1. Red arrowhead shows the position of the BPTAS frameshift. The position of the IDR is highlighted with an orange bar and the position of HMG boxes with blue bars. b, Structures of WT and mutant HMGB1 predicted with AlphaFold2. Colours ranging from blue to orange depict the per-residue measure of local confidence (pLDDT) for the model. c, Representative images from droplet formation assays of eGFP–HMGB1 variants at the indicated concentrations. The experiment was repeated three times, with similar results obtained. d, Quantification of the relative amount of condensed protein at the indicated concentrations. Data displayed as the mean ± s.d. e, Relative fluorescence intensity of the bleached area from eGFP–HMGB1 condensates before and after photobleaching. Data displayed as the mean ± s.d. f, Scheme of co-droplet assays. g, Representative images of eGFP–HMGB1 proteins mixed with preassembled mCherry-labelled MED1-IDR, HP1α or NPM1 droplets. h,i, Quantification of eGFP (h) and 5′ FAM (i) fluorescence intensity in mCherry-labelled MED1-IDR, HP1α and NPM1 droplets mixed with full-length mEGFP–HMGB1 proteins (h) or 5′  FAM–HMGB1-IDR peptides (i). Fold change values between the mean intensities of WT and mutants (Mut.) are indicated above the plot. Median is shown as a line within the boxplot, which spans from the 25th to 75th percentiles. Whiskers depict a 1.5× interquartile range. P values are from two-tailed Welch’s t-test. **P < 1 × 10−2, ***P  < 1 × 10−3, ****P < 1 × 10−4. Scale bars, 5 µm (c) and 10 µm (g).
Fig. 3
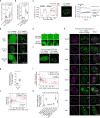
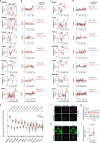
Fig. 3. Mutant HMGB1 replaces the granular component of the nucleolus in vivo.
a, Representative images of live U2OS cells expressing eGFP–HMGB1 proteins. Nuclear area revealed by Hoechst staining is shown as dashed white lines in a, c and f. b, Model of the nucleolus. R1, RNA polymerase I. c, Left, representative images of U2OS cells expressing RFP–FIB1 and mutant eGFP–HMGB1. Right, fluorescence intensity profiles from the region highlighted by the dashed yellow line. Low and high indicate nuclei with a relatively low or high amount, respectively, of the mutant protein. d, Relative fluorescence intensity of eGFP–HMGB1 before and after photobleaching. Data displayed as the mean ± s.d. e, Schematic and sequence representation of HMGB1 variants. Blue bars, HMG boxes. NLS, nuclear localization signal. Red arrow marks the position of the frameshift mutation (K184Rfs*44) and red letters highlight mutagenized amino acids. f, Representative images of live U2OS cells expressing the indicated eGFP–HMGB1 variants. g, Relative fluorescence intensity of eGFP–HMGB1 variants before and after photobleaching. Data are displayed as a line for the mean signal, with the shaded region representing ± s.d., n = number of cells examined. h, Representative images from puromycin-staining experiments with U2OS cells ectopically expressing eGFP–HMGB1 proteins. The puromycin signal was used to trace the cell area to highlight GFP+ cells with a dashed line. i, Normalized puromycin intensities displayed as the mean ± s.d. from three independent biological replicate experiments. ***P < 0.0002, ****P < 0.0001 by one-way ANOVA. j, Quantification of the viability of cells expressing the indicated HMGB1 proteins. Data displayed as individual points from independent biological replicates (n = 4). Bar charts show mean ± s.d. *** P = 0.0005, * P = 0.0177 by one-way ANOVA. Scale bars, 10 µm (a,c,f) or 20 µm (h).
Fig. 4
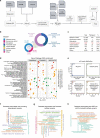
Fig. 4. A catalogue of variants in C-terminal IDRs reveals frameshifts associated with nucleolar mispartitioning and dysfunction.
a, Circos plot of the IDR variant catalogue. The circles indicate the location of genes that contain a truncation (stop gained) or frameshift variant in the dbSNP, 1000 Genomes Project, COSMIC and ClinVar databases. The highlighted genes contain a pathogenic frameshift that creates a sequence of ≥20 amino acids comprising ≥15% arginine residues. b, Summary statistics and features of variant types in C-terminal IDRs. P values are from hypergeometric tests. c, Identification of frameshifts creating a sequence of ≥20 amino acids that consist of ≥15% arginine residues. Plotted is the fraction of arginine residues against the length of the sequence created by the frameshift. The genes containing the variants selected for further validation are highlighted orange. Pathogenic gene variants are in blue. d, Representative images of U2OS cells co-expressing RFP–FIB1 and the indicated eGFP-tagged proteins. Nuclear area revealed by Hoechst staining is shown as dashed white lines. Mutations in the following genes are associated with the indicated conditions: microphthalmia (HMGB3 and RAX); myopathy (MYOD1); congenital central hypoventilation (PHOX2B); myelodysplasia (RUNX1); Axenfeld–Rieger syndrome type 3 (FOXC1); myelofibrosis (CALR); alveolar capillary dysplasia (FOXF1); anophthalmia/microphthalmia-oesophaegalatresia syndrome (SOX2); Paget disease of bone 2, early-onset frontotemporal dementia and amyotrophic lateral sclerosis (SQSTM1); blepharophimosis, ptosis and epicanthus inversus (FOXL2); and hereditary cancer predisposing syndrome (MEN1). Scale bar, 10 µm. e, Nucleolar mispartitioning strongly correlates with the fraction of arginine residues in the frameshift sequence. Plotted are Pearson’s correlation coefficients of the extent of nucleolar mispartitioning of mutant proteins with protein features of their IDRs (left triangle) and features of the sequences created by the frameshifts (right triangle). The colour corresponds to the value of Pearson’s correlation coefficients, and the size of the circles is proportional to the P value of the Pearson’s r. f, RT–qPCR analysis of rRNA species in U2OS cells expressing the indicated WT and mutant proteins. rRNA levels are normalized against an RNAPII transcript (GAPDH), and fold changes are calculated against the rRNA/GAPDH level measured in the cells expressing WT protein. Data are shown as mean ± s.d., P values are from two-tailed Welch’s t-test. AA, amino acid; SNP, single nucleotide polymorphism; nucl. enr., nucleolar enrichment.
Extended Data Fig. 1
Extended Data Fig. 1. Clinical findings in BPTAS individuals.
(a-c) I1 at age of 9 months. (a) Palmar view, left hand: brachydactyly and reduced creases of fingers. (b) Right foot: preaxial polysyndactyly, syndactyly between the second and third toes, increased soft tissue of distal toes in the dorso-ventral axis, hypoplastic/missing nails. (c) Malformed upper and lower limbs, contractures of large joints. (d-i) I2. (d) Lateral babygram (after birth): normal lateral spine apart from limb anomalies. (e-f) X-rays of upper extremities: contractures of the elbows, dislocation of the radius head, short radius and ulna, short middle phalanges. (g-i) I2, photos at age of 11 years. Plantar and dorsal views of the feet: preaxial polysyndactyly, hypoplastic nails. (j-l) I4. (j) Left foot, (k) Right foot, (l) Right hand. Radiograms of the feet at the age of 6 months showing symmetrical preaxial polysyndactyly. Radiogram of the right hand at age of 6 months: Note retarded bone age and short tubular bones, the middle phalanges are slightly more affected than the other ones. (m-r) I5 at 21 weeks of gestation. (m) Note webbed elbows. (n) Contractures of large joints. (o) Dorsal view of hands showing brachydactyly with hypoplastic nails. (p) Abnormal female genitalia. (q-r) Radiograms of the lower extremities and pelvis: hypoplastic iliac wings, lack of tibiae, hypoplastic fibulae, and preaxial polydactyly of feet. (s) Histogram of the syndromes suggested among the top-10 Face2Gene-suggestions of the images of individuals affected with BPTAS and the composite mask of this syndrome showing telecanthus and blepharophimosis.
Extended Data Fig. 2
Extended Data Fig. 2. Patient genotyping and population-genetic data.
(a) Variant detection and filtering scheme of the whole genome (I1 and I5) and exome sequencing data (I4). (b) gDNA Sanger sequencing data of HMGB1 in I1. (c) gDNA Sanger sequencing data of HMGB1 in I2, and I3, note identical de novo frameshift also found in I2 c.551_554delAGAA, de novo occurrence in I3. (d) Exome sequencing data of HMGB1 in I4. Note identical frameshift as in I2 in I3, and de novo occurrence. (e) Sequencing of HMGB1 cDNA in I3 and an unaffected control. Note the detection of both the wildtype and mutant cDNA in I3. (f) Allele counts of non-synonymous variants in HMGB1’s acidic tail in the gnomAD database (v.2.1.1). Note that especially non-acidic substitutions are rare, and no frameshifts of HMGB1 are listed in gnomAD. (g) Position of nonsynonymous variants in HMGB1’s acidic tail. Note that most variants do not significantly shorten the uninterrupted succession of aspartic acid (D) and glutamic acid (E). The 4 non-acidic substitutions comprise merely 5 of 1123 non-synonymous alleles of the acidic tail listed in gnomAD. (h) Pedigree of family 6. Squares denote male, circles denote female individuals. Individuals diagnosed with BPTAS are highlighted with solid black boxes, and the genotypes are displayed below the boxes. WT = wildtype. (i) Microdeletion in 13q12.3 in I5. CMA data showing loss of HMGB1 in I6. (j) qPCR showing de novo occurrence and revealing deletion of all exons, colored primers are positioned between the last non-deleted and first deleted oligo of the CMA, black primer X chromosomal control. Data are from one biological replicate.
Extended Data Fig. 3
Extended Data Fig. 3. Computational and biochemical characterization of HMGB1.
(a) Predicted structures of Hmgb1 proteins from AlphaFold2 Protein Structure Database. Colors ranging from blue to orange depict the per-residue measure of local confidence for the model. (b) Left: MSA depth assessment for the sequences for quality assessment of the predicted HMGB1 models. Aligned sequences are colored by sequence identity. Sequence coverage frequency is depicted by a black line. The dotted red line marks the frameshift in the mutant. Right: Disorder analysis of wild type and mutant HMGB1 sequences using AlphaFold2 pLDDT scores (yellow) and Metapredict scores (blue). (c) Circular dichroism (CD) data of the WT HMGB1 IDR peptide in the absence (black) and in the presence (gray) of 2.5 % trifluoroethanol (TFE). On the upper panel, the CD spectra are shown as the mean residue ellipticity (MRE) as a function of wavelength. On the lower panel, the high-tension voltage (HT) values are shown as a function of wavelength. Vertical dotted lines indicate the wavelength value corresponding to HT = 600 V. (d) Circular dichroism (CD) data of the Mutant HMGB1 IDR peptide in the absence (red) and in the presence (orange) of 2.5 % trifluoroethanol TFE. On the upper panel, the CD spectra are shown as the mean residue ellipticity (MRE) as a function of wavelength. On the lower panel, the high-tension voltage (HT) values are shown as a function of wavelength. Vertical dotted lines indicate the wavelength value corresponding to HT = 600 V. (e) Representative CD spectra of α-helix, β-strand and disordered proteins, shown as the mean residue ellipticity (MRE) as a function of wavelength. The data was obtained from the Protein Circular Dichroism Data Bank (PCDDB) (see Methods).
Extended Data Fig. 4
Extended Data Fig. 4. Mutant HMGB1 protein and synthetic IDR peptide.
(a) Chromatograms from size-exclusion chromatography (SEC) of wild type and mutant mEGFP-HMGB1 fusion proteins. Selected fractions highlighted with red. (b) SDS-PAGE analysis of purified proteins after His-Tag column purification before SEC and after SEC purification steps. Analysis was performed once for each protein prep. (c) SDS-PAGE of SEC purified HMGB1 proteins followed by immunoblotting with anti-EGFP and anti-HMGB1 antibodies. Analysis was performed once for each protein prep. (d) Representative images from droplet formation assays performed with 5’FAM-labeled HMGB1-IDR variant peptides at indicated concentrations in the presence of 20 ng/µl RNA or without RNA. Experiment was replicated 2 times with similar results. (e) Quantification of the relative amount of condensed protein of 5’FAM-HMGB1-IDR peptides at the indicated concentrations. Data displayed as mean ± SD from 5 image fields examined per condition. (f) Representative images from droplet formation assays performed with 2.5 µM 5’FAM-labeled HMGB1-IDR synthetic peptides at indicated RNA concentrations. Experiment was replicated 2 times with similar results. (g) Quantification of the relative amount of condensed protein of 2.5 µM 5’FAM-HMGB1-IDR peptides at the indicated RNA concentrations. Data displayed as mean ± SD from 5 image fields examined per condition. (h) Scheme of co-droplet assays. (i) (top) Representative images of droplets formed by 5’FAM-HMGB1-IDR peptide mixed with pre-assembled mCherry-labeled MED1-IDR, HP1α or NPM1 droplets. (bottom) Example images from 5 µM 5’FAM-HMGB1 mutant peptide mixed with mCherry labeled NPM1 droplets with uneven distribution of the peptide within droplet. (j) Dual fluorescence plot quantification of 5’FAM and mCherry fluorescence intensities in mCherry-labeled NPM1, MED1-IDR or HP1α droplets mixed with synthetic HMGB1 IDR peptides. Each dot represents one droplet, and the size of the dot is proportional to the size of the droplet. Scale bars, 5 µm (d,f) or 1 µm (g,i).
Extended Data Fig. 5
Extended Data Fig. 5. Mutant HMGB1 forms nuclear inclusions in human cells.
(a) Quantification of the nuclear enrichment of EGFP as the ratio of mean signal intensities inside and outside the nucleus. Red dashed line depicts a value of 1 (no enrichment). For all boxplots in this figure, the median is shown as a line within the boxplot, which spans from 25th to 75th percentiles. Whiskers depict a 1.5x interquartile range. **** P < 2.2 x 10⁻¹⁶, two-tailed Welch’s t-test. (b) Quantification of nuclear inclusions as the standard deviation of nuclear EGFP fluorescence intensity normalized by mean intensity. **** P < 2.2 x 10⁻¹⁶, two-tailed Welch’s t-test. (c) (left) Graph plotting the intrinsic disorder of HMGB1 predicted by PONDR VLXT algorithm. The positions two different IDR definitions are highlighted with orange bars and the position of HMG boxes with blue bars. IDR1 begins from Asn135 as defined by PONDR analysis and IDR2 begins from Ala164, excluding any sequence belonging to HMG box. (middle) Representative image from U2OS cells expressing EGFP-HMGB1-mutant-IDR2. Scale bar = 10 µm. (right) Relative fluorescence intensity of bleached EGFP-HMGB1 WT full-length, mutant full length and mutant IDRs 1 and 2 before and after photobleaching. Data is displayed with a line showing the mean and lighter shade represents ± SD. (d) Representative images of live MCF7, HCT116 and HEK293T cells expressing mEGFP-HMGB1 variants. The nuclear area is shown as dashed white lines. Scale bar = 10 µm. (e) Representative images of EGFP-HMGB1 within live U2OS cell nuclei before and after photobleaching. FRAP recovery quantified in (Fig. 3d). Scale bar = 1 µm. (f) Representative images of formaldehyde-fixed U2OS cells ectopically expressing EGFP-HMGB1 WT or mutant proteins. Scale bar = 5 µm. (g) Quantification of presence of nuclear inclusions in fixed cells in panel (f) represented as the standard deviation of nuclear EGFP fluorescence intensity normalized by mean intensity. (h) Immunofluorescence for RNAPII, MED1, SC35, HP1α, NPM1 and FIB1 in U2OS cells expressing full length mutant EGFP-HMGB1. (low) indicates a nucleus with a relatively low amount of the mutant protein, (high) indicates a nucleus with a relatively high amount of the mutant protein. Scale bar = 10 µm. (i) Quantification of the ratio between intra- /extranucleolar NPM1 intensity and EGFP-HMGB1 intensity inside nucleoli. r = Pearson’s correlation coefficient, P-value from a two-tailed t-test. (j) Quantification of the average NPM1 fluorescence outside the nucleoli and EGFP-HMGB1 intensity inside the nucleoli for the IF experiments shown in panel (h). r = Pearson’s correlation coefficient, p-value from a two-tailed t-test. (k) Quantification of nuclear inclusions in the panel of EGFP-HMGB1 mutants (Fig. 3e–g) as the standard deviation (SD) of nuclear EGFP signal normalized to the mean nuclear EGFP signal intensity. FL = full length.
Extended Data Fig. 6
Extended Data Fig. 6. Additional characterization of HMGB1 mutant nuclear inclusions in U2OS cells.
(a) qRT-PCR analysis of rRNA species in U2OS cells expressing wild type and mutant HMGB1 variants. rRNA levels are normalized against an RNAPII transcript (actin), and the values are normalized against the rRNA/actin level measured in the cells expressing wild type HMGB1. Data is shown as mean +/− SD, * p < 0.05, two-tailed Student’s t-test. (b) Representative images from Puromycylation experiments with U2OS cells ectopically expressing EGFP-tagged WT or mutant HMGB1 proteins with (Puro +) and without (Puro -) Puromycin pulse labeling. Scale bar = 20 µm. (c) Histograms depicting % of cells and their normalized puromycin intensities from EGFP+ and EGFP- cells ectopically expressing WT or Mutant full length HMGB1 combined from three independent puromycylation experiments. (d) (top) Scheme of the viability experiment. (bottom) Representative mages of U2OS cells at the end of viability experiments (Fig. 3j). Scale bar = 50 µm. (e) Representative live cell imaging of U2OS cells with doxycycline inducible overexpression of EGFP-HMGB1 variants. Dashed lines show nuclear area defined by Hoechst staining. Scale bar = 10 µm. (f) Quantification of nuclear inclusions as the standard deviation (SD) of nuclear EGFP signal normalized to the mean nuclear EGFP signal intensity. **** P < 2.2 x 10⁻¹⁶, two-tailed Welch’s t-test, n = number of nuclei examined for each condition. (g) Relative fluorescence intensity of EGFP-HMGB1 before and after photobleaching with identical laser settings in cells described in (panels e-f). Data displayed as mean ± SD. (h) Representative images of EGFP-HMGB1 within live U2OS cell nuclei before and after photobleaching with identical laser settings, FRAP recovery quantified in (panel g). Scale bar = 2 µm. (i) (top) Scheme for experiments testing the viability of U2OS cells with Doxycycline-inducible expression of HMGB1 variants. (bottom) representative images from viability experiments 48h after sorting for GFP+ cells. Scale bar = 100 µm. (j) Quantification of viability of cells expressing the indicated HMGB1 proteins. Mean relative light units (RLU) displayed as individual points from independent biological replicate experiments (n = 5 for WT and Mutant, 4 for “Patchless”). Bar charts show the mean ± SD. p-values are from one-way ANOVA.
Extended Data Fig. 7
Extended Data Fig. 7. Characterization of genetic variants in C-terminal IDRs.
(a) Scheme of the IDR catalog identification algorithm. (b) Summary of all variants identified in C-terminal IDRs. (c) Frameshift variants are enriched for pathogenic variants. (d) Gene Ontology (GO) term enrichment analysis of (left) genes that contain at least one ‘stop gained’ (i.e. truncating) mutation in the catalog; (middle) genes that contain at least one frameshift (≥20 amino acids) in the catalog; (right) genes that contain at least one frameshift (≥20 amino acids) that creates a sequence consisting of at least 15% arginines. (e) pLI score distributions for indicated gene sets. Disease genes: genes that have at least one “pathogenic”, “likely pathogenic”, or “conflicting interpretations” entry in ClinVar. (f) Word cloud plot of diseases associated with ‘stop gained’ (i.e. truncating) variants. Font size of words correlates with frequency of occurrence. (g) Word cloud plot of diseases associated with frameshift variants that create an at least 20 amino acid long sequence. Font size of words correlates with frequency of occurrence. (h) Word cloud plot of diseases associated with frameshift variants that create an at least 20 amino acid long sequence that consists of at least 15% arginines. Font size of words correlates with frequency of occurrence.
Extended Data Fig. 8
Extended Data Fig. 8. Sequences of candidate proteins.
Sequences of the thirteen wild type and mutant HMGB3, FOXC1, FOXF1, MYOD1, RAX, RUNX1, PHOX2B, CALR, FOXL2, SOX2, SQSTM1, MEN1 and DVL1 proteins. In the wild type variants, only the sequences replaced by the frameshift variants are shown underlined. The sequences created by the frameshift variants are colored red and are underlined.
Extended Data Fig. 9
Extended Data Fig. 9. Disorder and charge analyses of proteins created by frameshifts in candidate proteins.
(a, c) Disorder analysis of HMGB1, HMGB3, FOXC1, FOXF1, MYOD1, RAX, RUNX1, CALR, FOXL2, PHOX2B, SOX2 and SQSTM1 wild type and frameshift mutant sequences using the PONDR algorithm. The PONDR scores for the wild type sequences are plotted with grey dashed line, the PONDR scores for the mutant sequences are plotted in red. The positions of the DNA binding domains (DBD) are highlighted with black bars and frameshift position is highlighted with red arrow. (b, d) Charge plots of wild type and mutant sequences. Note the increased positive charge in C-terminus of frameshift variants. Isoelectric points (pI) for the protein sequence following the frameshift position in wild type and mutant sequences are shown beside the charge plots. (e) Quantification of nucleolar enrichment of the indicated proteins in the FIB1-RFP co-expression experiments. Median is shown as a line within the boxplot, which spans from 25th to 75th percentiles. Whiskers depict a 1.5x interquartile range. *** P <10−3, **** P < 10−4 from two-tailed Welch’s t-test, n = number of nuclei examined per condition. (f) Representative images of U2OS cells co-expressing RFP-Fibrillarin and EGFP-tagged DVL1 proteins. Scale bar = 10 µm. (g) Relative fluorescence intensity of bleached EGFP-tagged DVL1 in U2OS cells before and after photobleaching with identical laser settings. Line: mean, lighter shade: ± SD. (h) Representative images of hiPSCs co-expressing RFP-Fibrillarin and EGFP-tagged DVL1 proteins. Note the nucleolar signal in the cells expressing Mutant EGFP-DVL1. Scale bar = 10 µm. (i) Quantification of nucleolar enrichment of DVL1 in the FIB1-RFP co-expression experiments in hiPSCs. Median is shown as a line within the boxplot, which spans from 25th to 75th percentiles. Whiskers depict a 1.5x interquartile range, **** P < 10−4, two-tailed Welch’s t-test, n = number of nuclei examined per condition.
Extended Data Fig. 10
Extended Data Fig. 10. Nucleolar mispartitioning and dysfunction in cells expressing mutant proteins with disease-associated frameshifts.
(a) Cavitation of the nuclear inclusion formed by frameshift mutant FOXC1, FOXF1, RAX, HMGB3, PHOX2B and SOX2. Representative images of U2OS cells co-expressing RFP-Fibrillarin and EGFP-tagged mutant proteins are shown. Scale bar = 5 µm. Right: fluorescence intensity profiles of EGFP (green) and RFP (purple) quantified from the region highlighted with yellow a dashed line on images on the left. (b) Relative fluorescence intensity of bleached EGFP-tagged proteins before and after photobleaching with identical laser settings. Data displayed as mean ± SD. (c) qRT-PCR analysis of rRNA species in U2OS cells expressing the indicated wild type and mutant proteins. rRNA levels are normalized against a control RNAPII transcript (GAPDH, actin, or Cyclophilin), and the values are normalized against the rRNA/control transcript level measured in the cells expressing wild type proteins. Data displayed as mean +/− SD. P-values are from two-tailed Student’s t-tests, n = 3 biologically independent experiments. (d) Actinomycin D control experiments for measuring rRNA levels. U2OS cells were treated with Actinomycin D (30 nM for 2 h), and rRNA levels were quantified using qRT-PCR. rRNA levels are normalized against a control RNAPII transcript (actin, GAPDH or Cyclophilin), and the values are normalized against the rRNA/control transcript level measured in the control (i.e. untreated) cells. Data displayed as mean +/− SD. P-values are from two-tailed Welch’s t-test, n = 3 biologically independent experiments. On the right, light microscopy images of control and Actinomycin D-treated cells are shown. Note the dimming of the dark spots in the nucleus (corresponding to nucleoli).

Similar articles

Cited by

References

    1. Claussnitzer M, et al. A brief history of human disease genetics. Nature. 2020;577:179–189. doi: 10.1038/s41586-019-1879-7. - DOI - PMC - PubMed
    1. Tsang B, Pritisanac I, Scherer SW, Moses AM, Forman-Kay JD. Phase separation as a missing mechanism for interpretation of disease mutations. Cell. 2020;183:1742–1756. doi: 10.1016/j.cell.2020.11.050. - DOI - PubMed
    1. Dyson HJ, Wright PE. Intrinsically unstructured proteins and their functions. Nat. Rev. Mol. Cell Biol. 2005;6:197–208. doi: 10.1038/nrm1589. - DOI - PubMed
    1. Banani SF, Lee HO, Hyman AA, Rosen MK. Biomolecular condensates: organizers of cellular biochemistry. Nat. Rev. Mol. Cell Biol. 2017;18:285–298. doi: 10.1038/nrm.2017.7. - DOI - PMC - PubMed
    1. Shin Y, Brangwynne CP. Liquid phase condensation in cell physiology and disease. Science. 2017;357:eaaf4382. doi: 10.1126/science.aaf4382. - DOI - PubMed

Publication types

MeSH terms

Supplementary concepts