. 2023 Mar;615(7951):315-322.
doi: 10.1038/s41586-022-05692-z. Epub 2023 Feb 8.

TET2 guards against unchecked BATF3-induced CAR T cell expansion

Affiliations

TET2 guards against unchecked BATF3-induced CAR T cell expansion

Nayan Jain et al. Nature. 2023 Mar.

Abstract

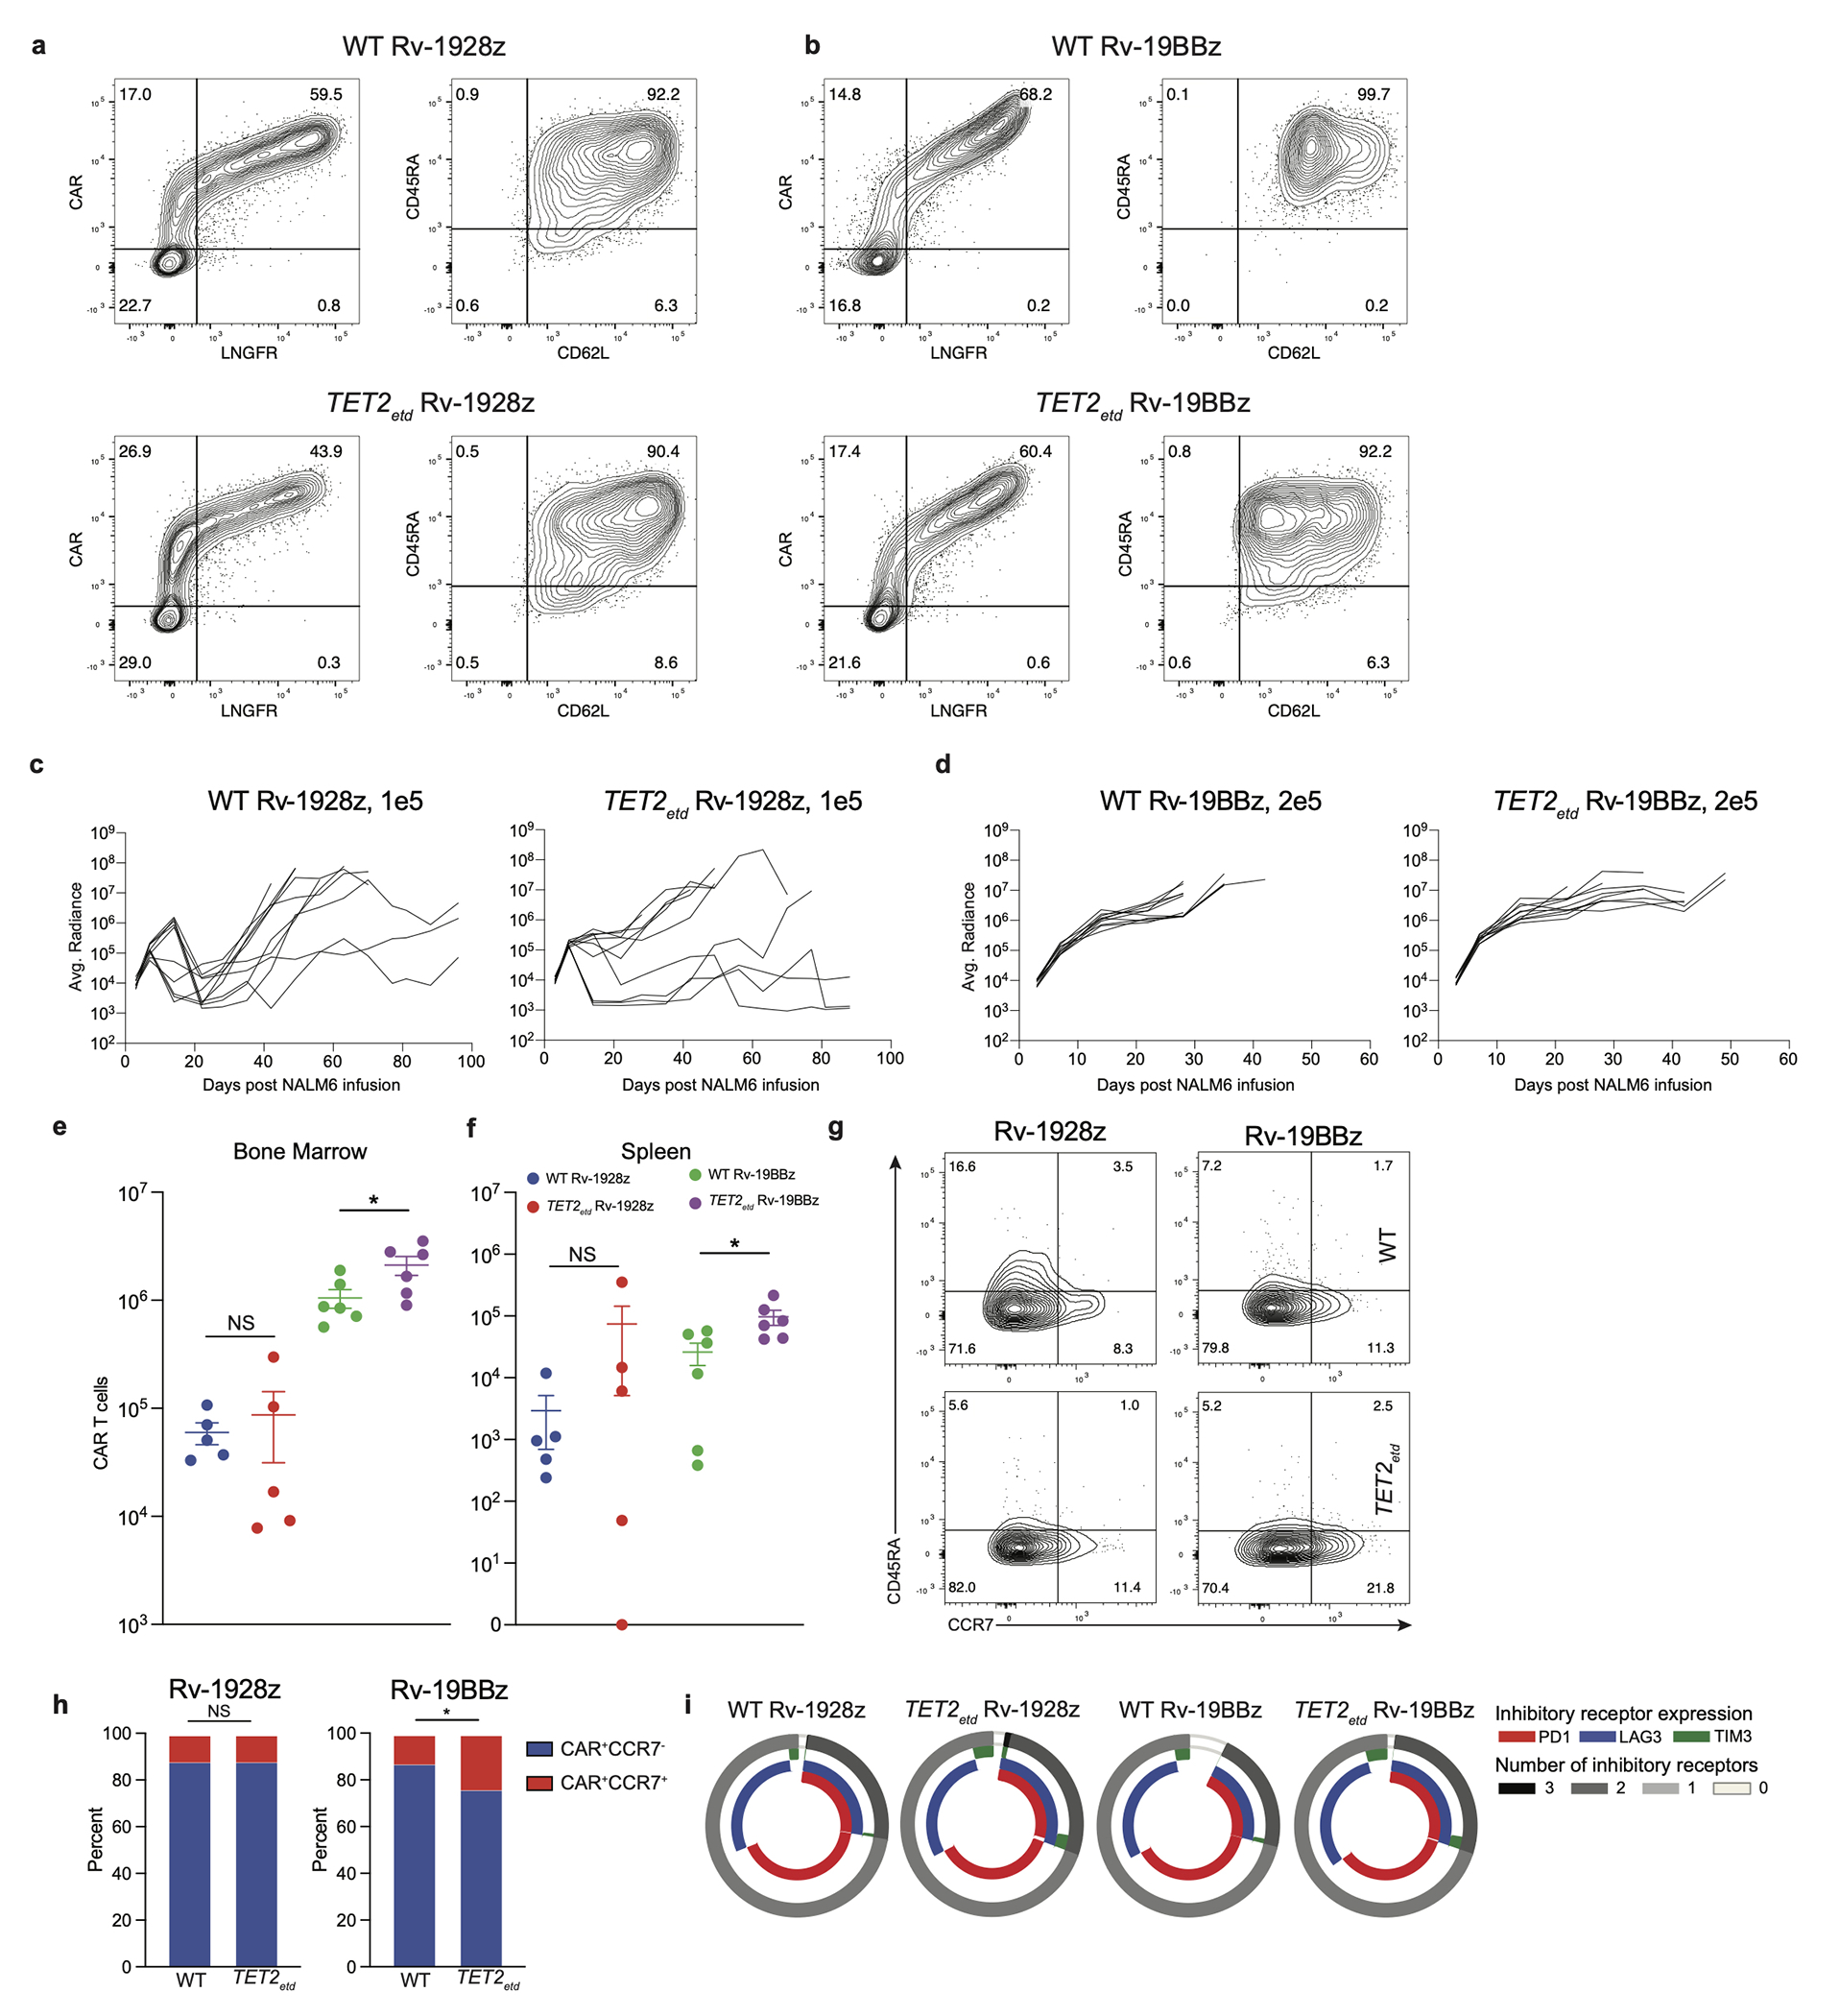
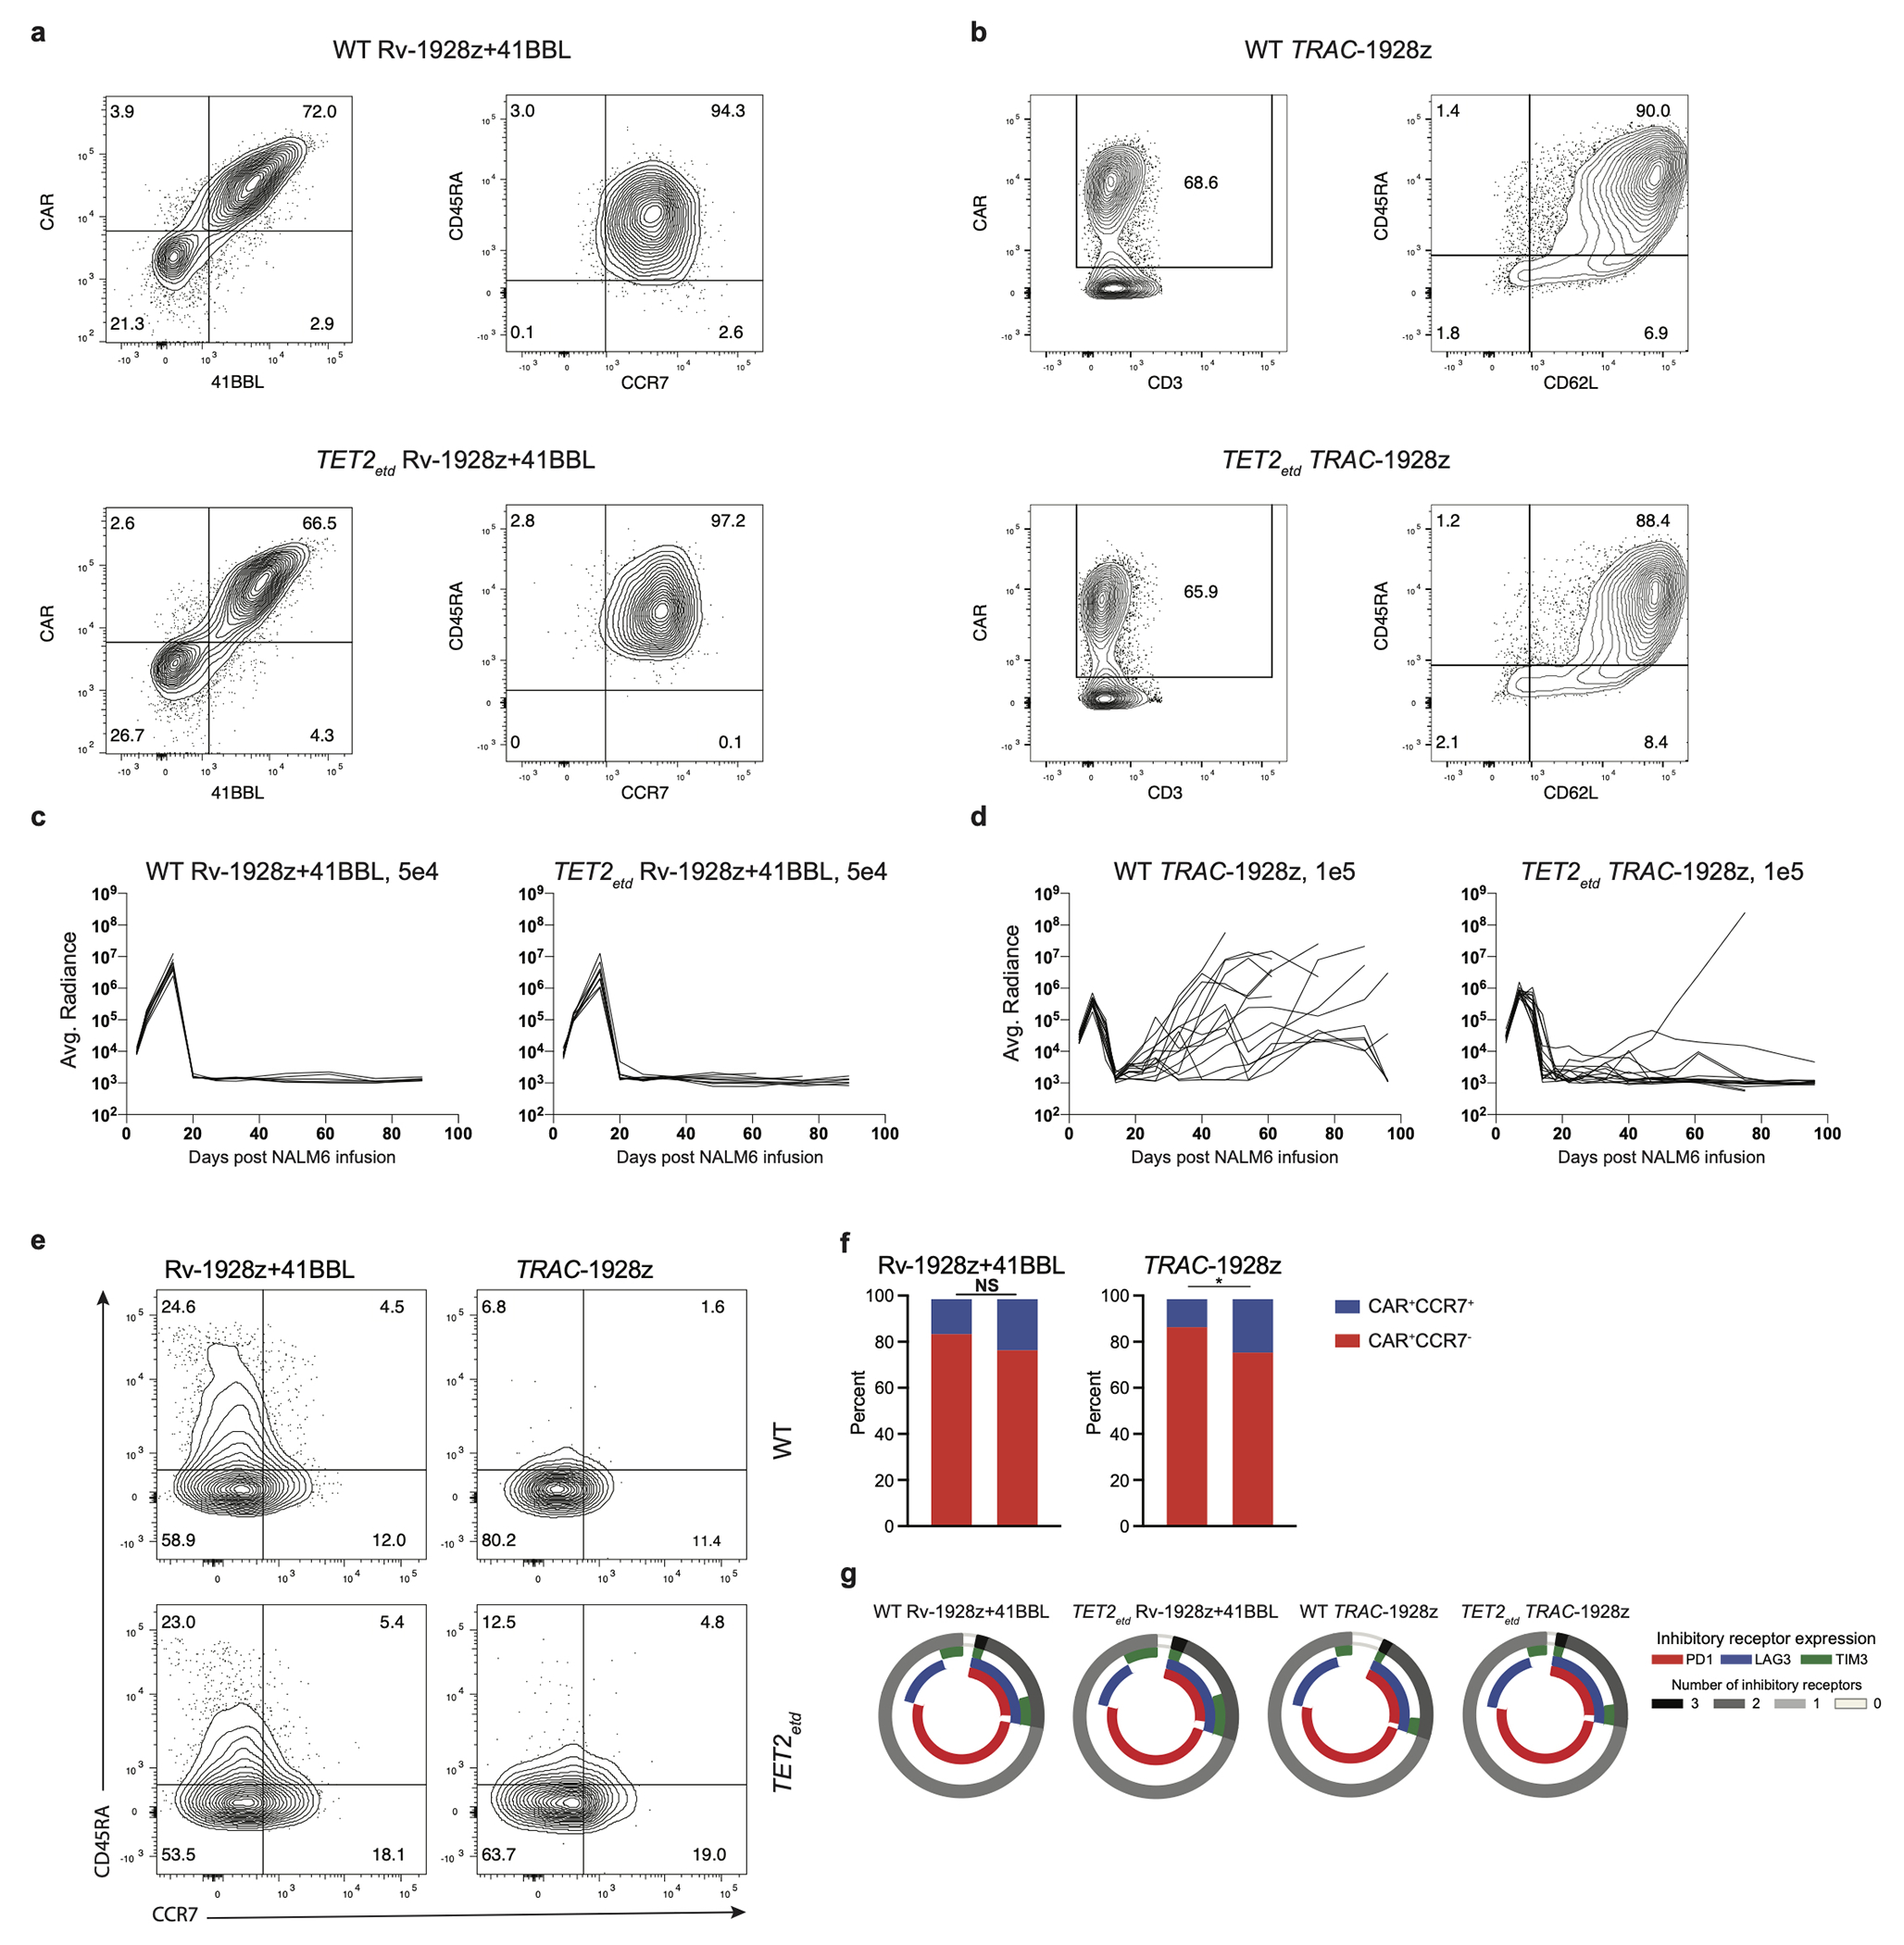
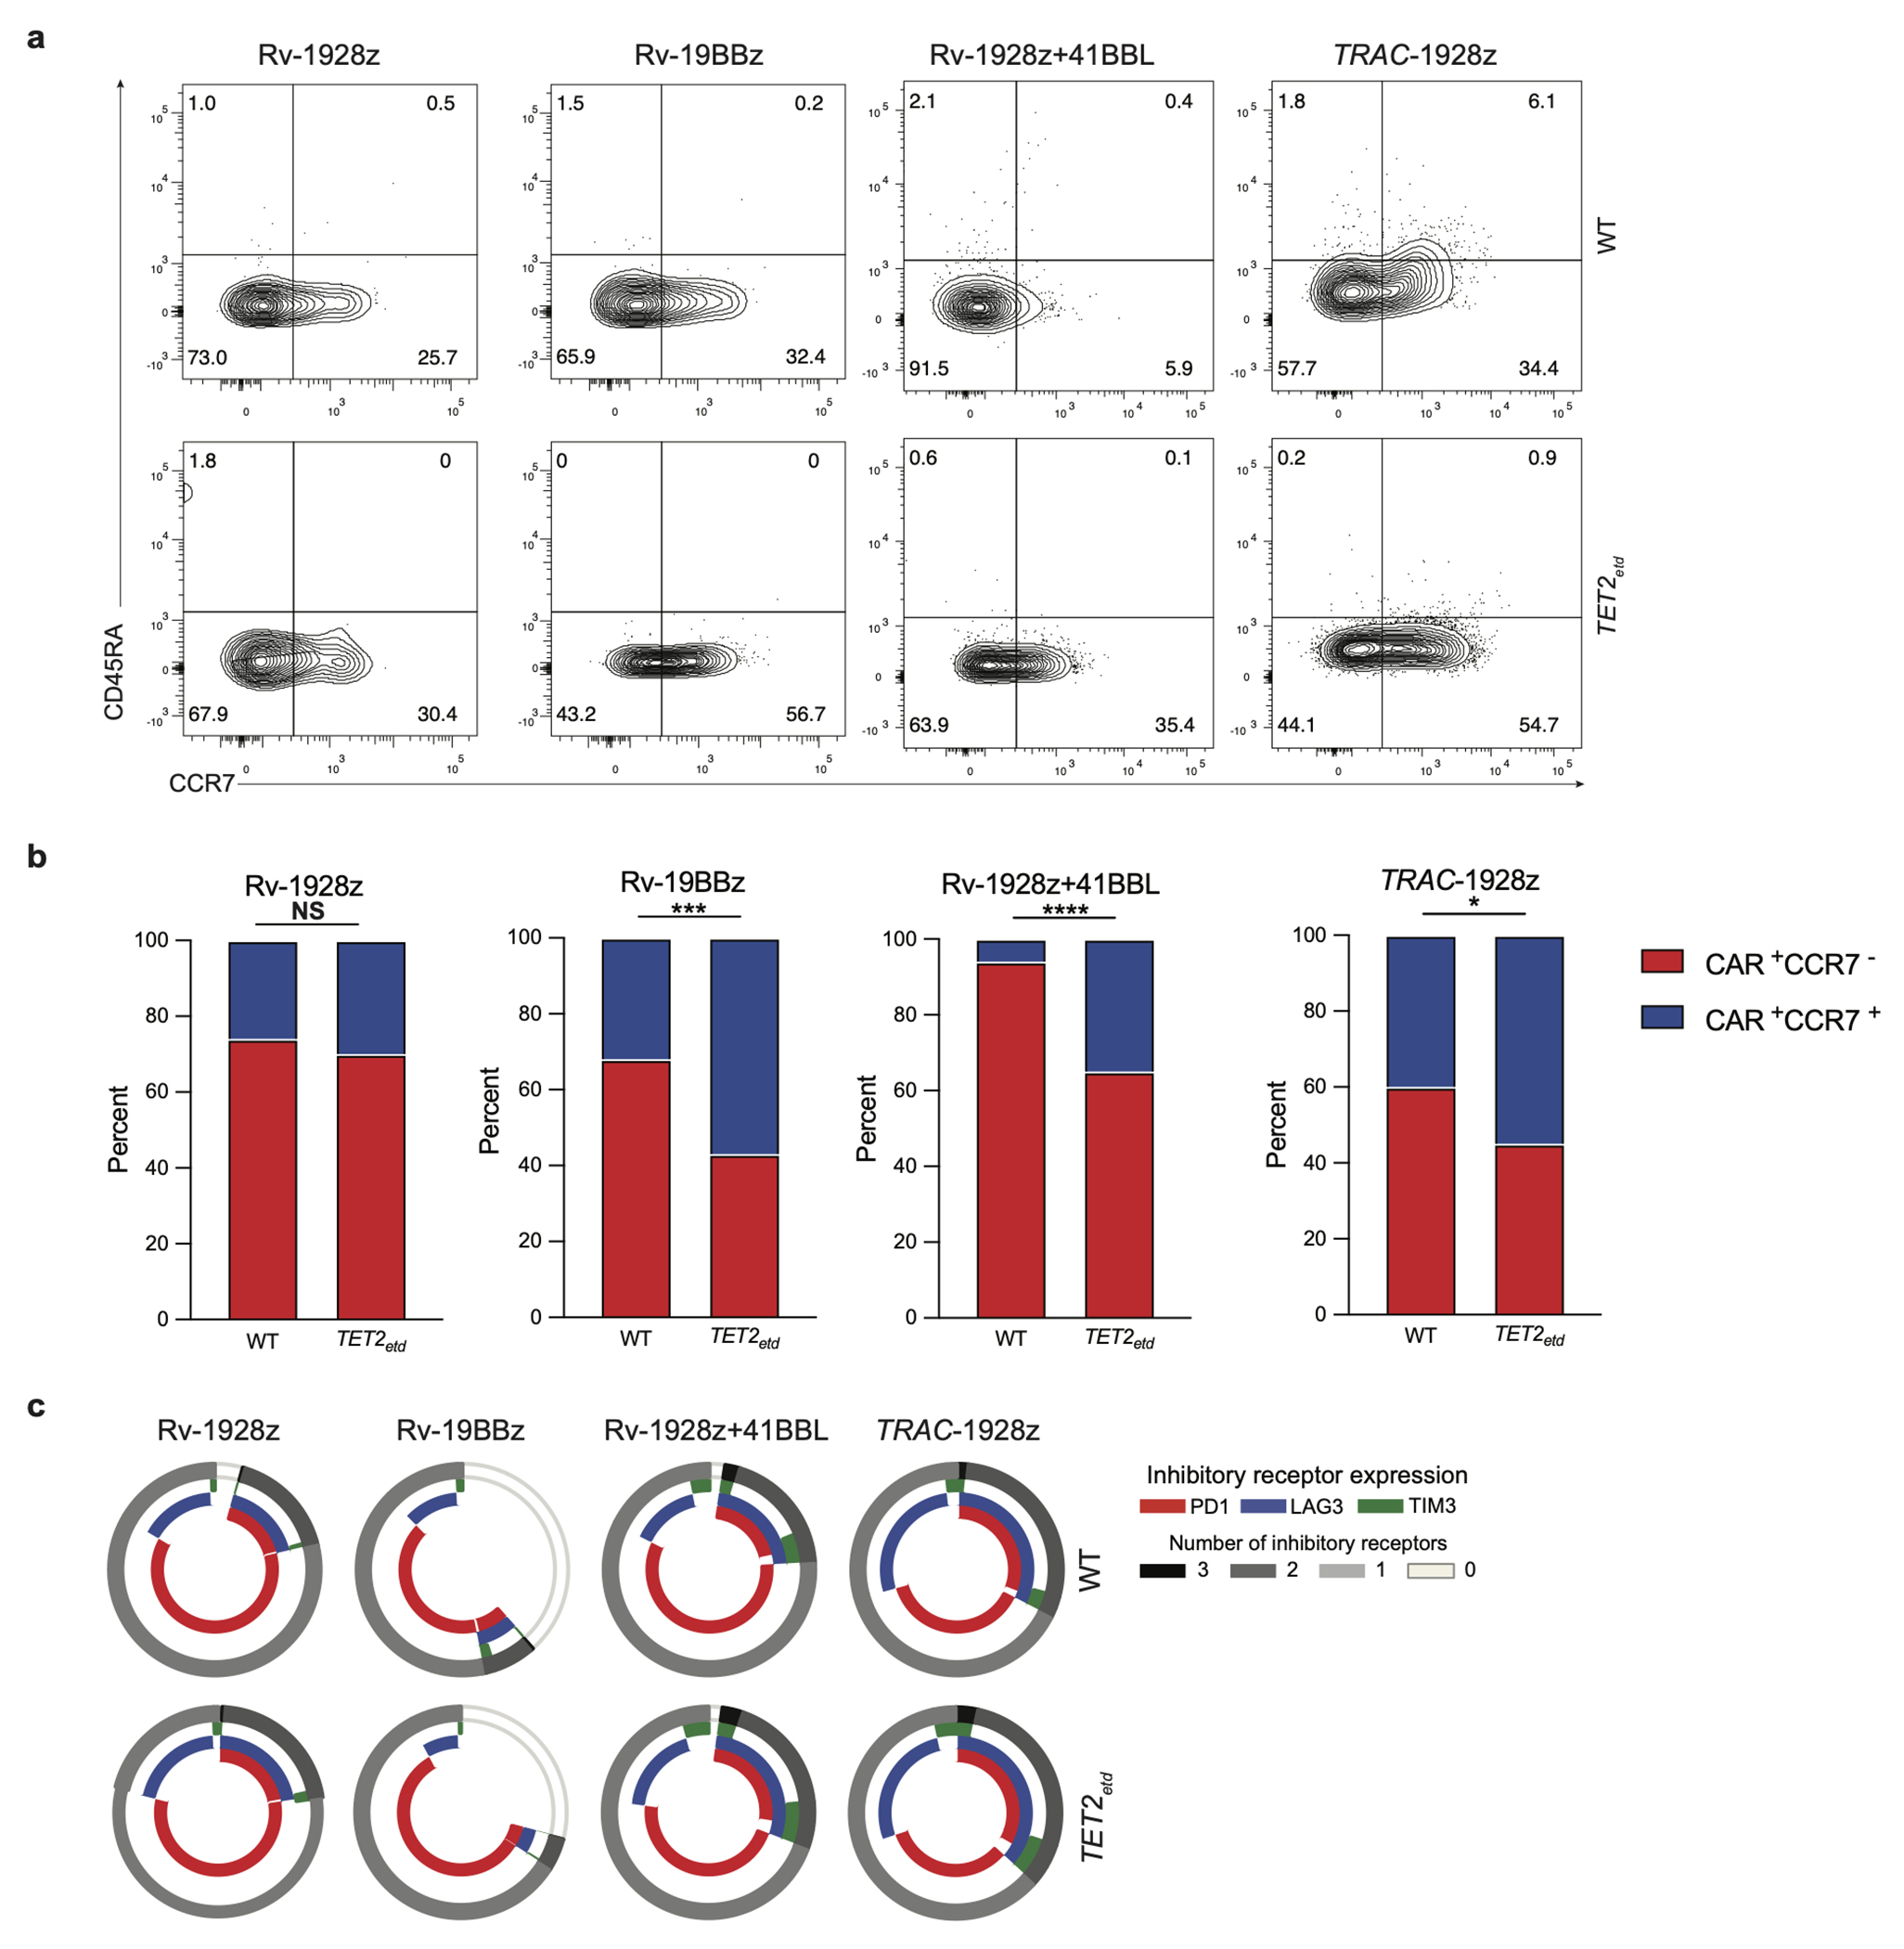
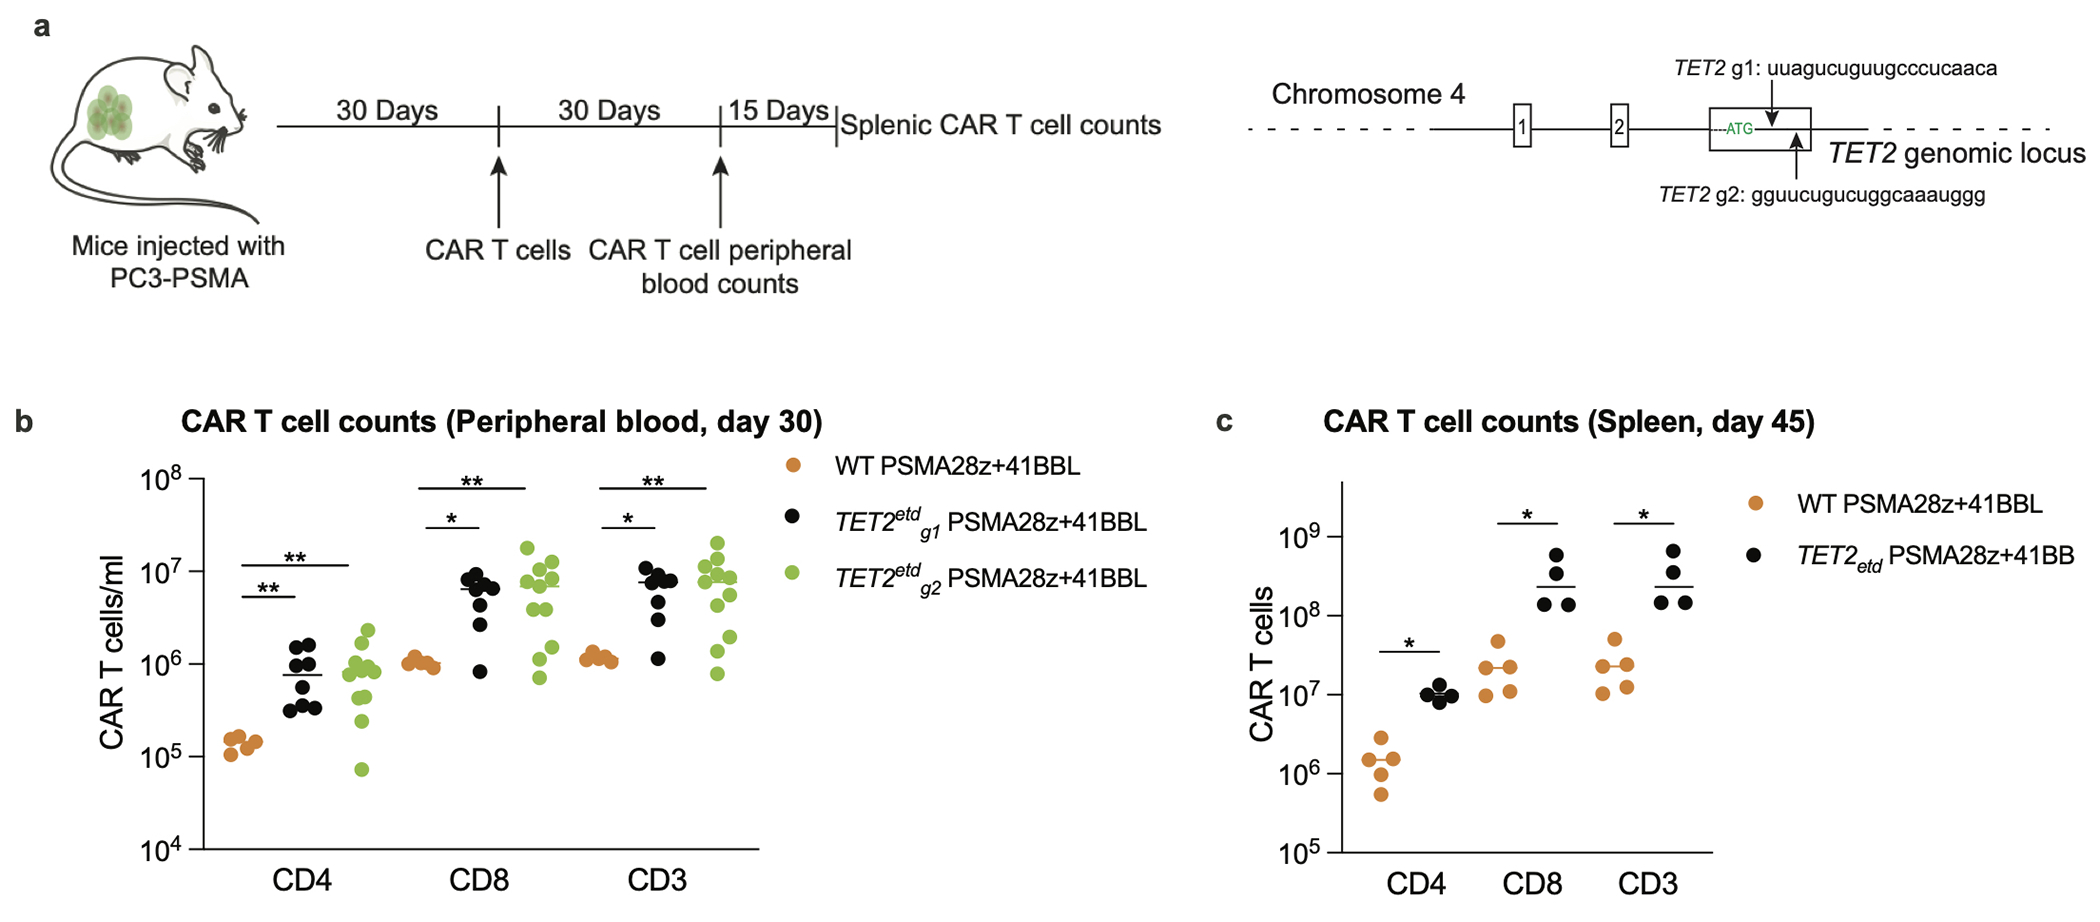
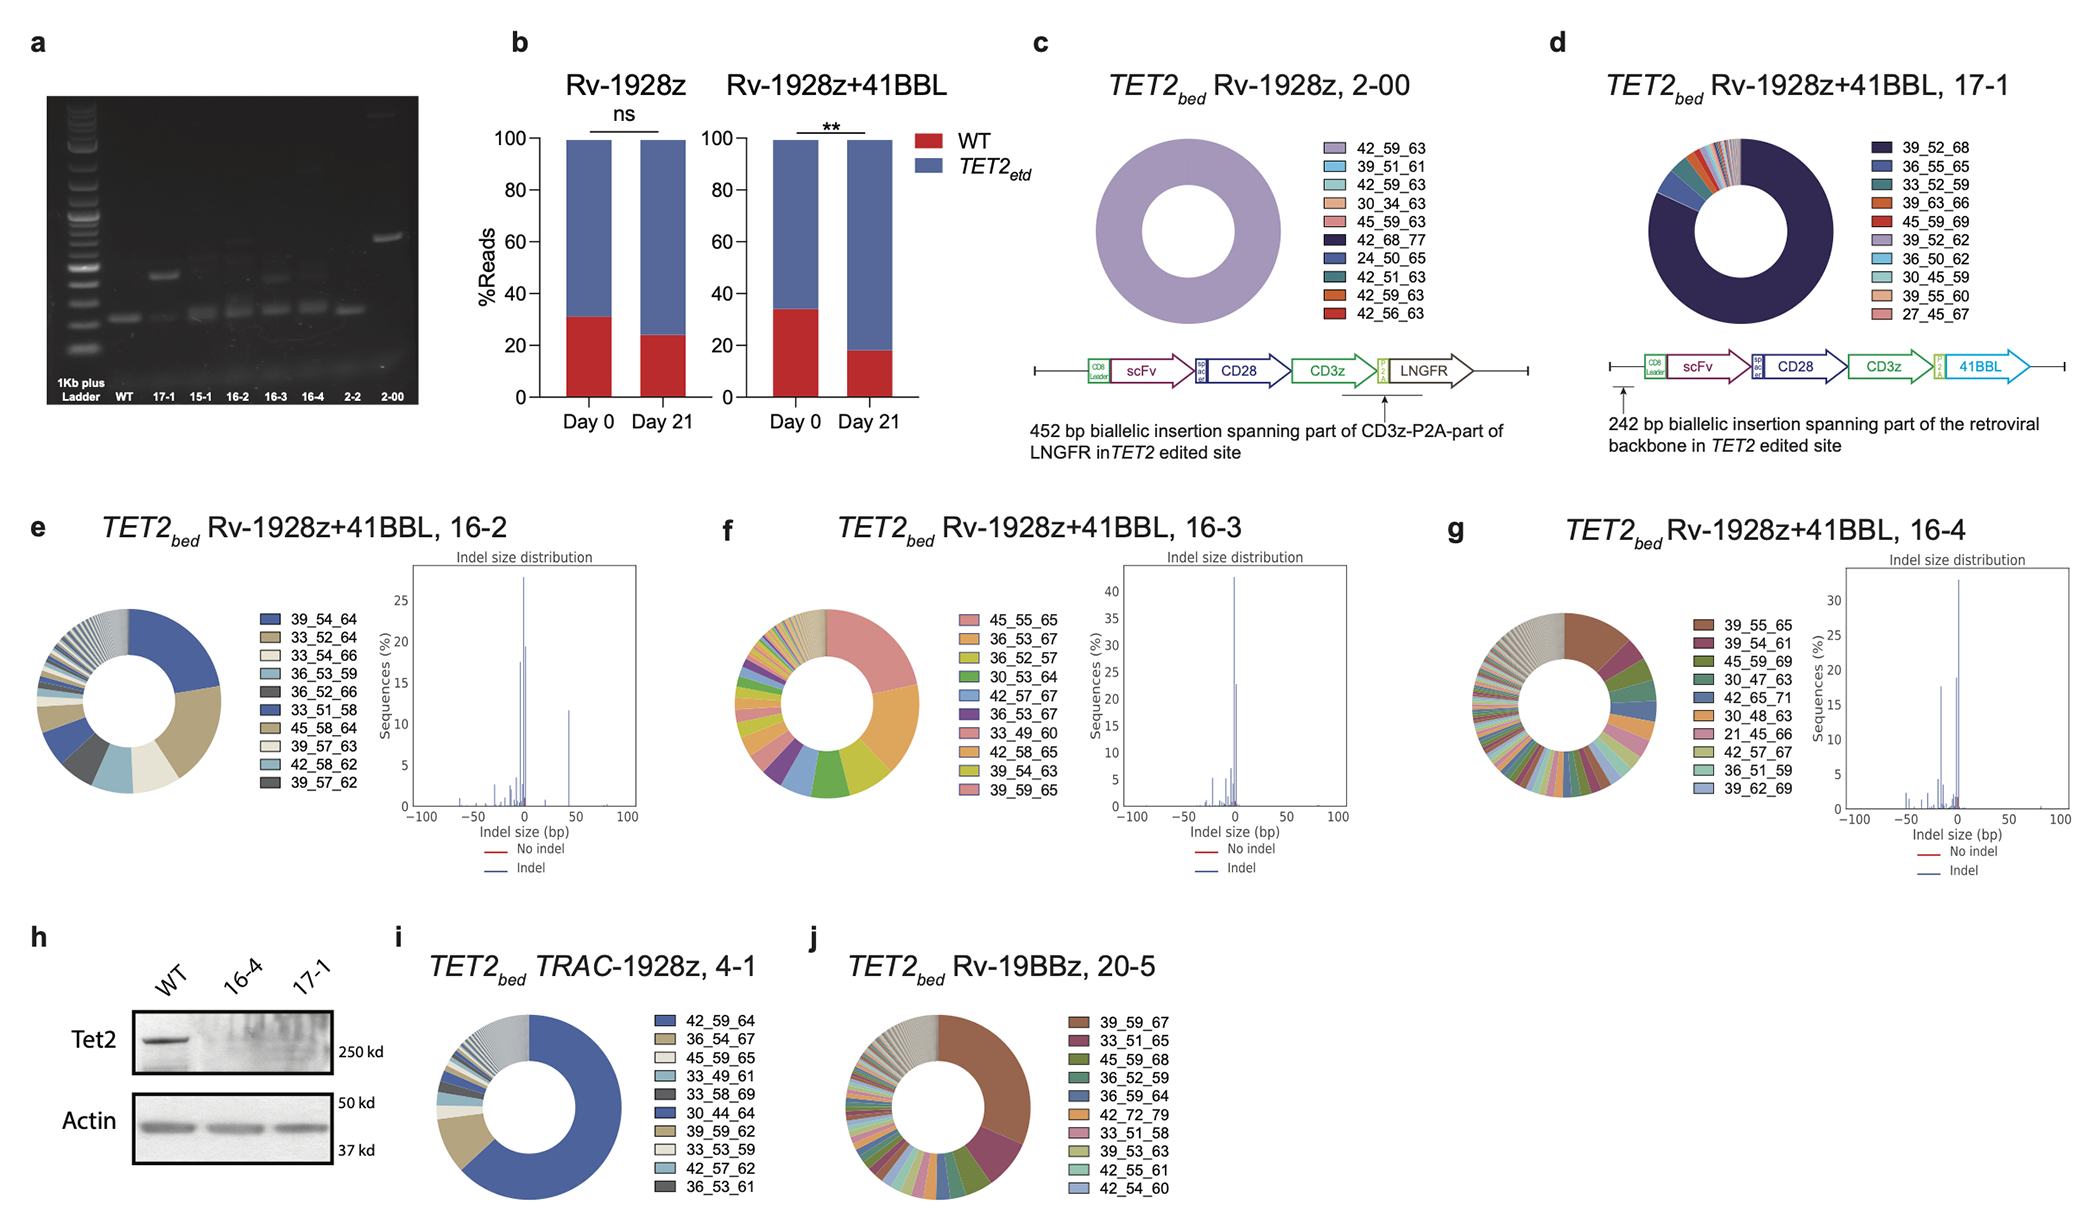
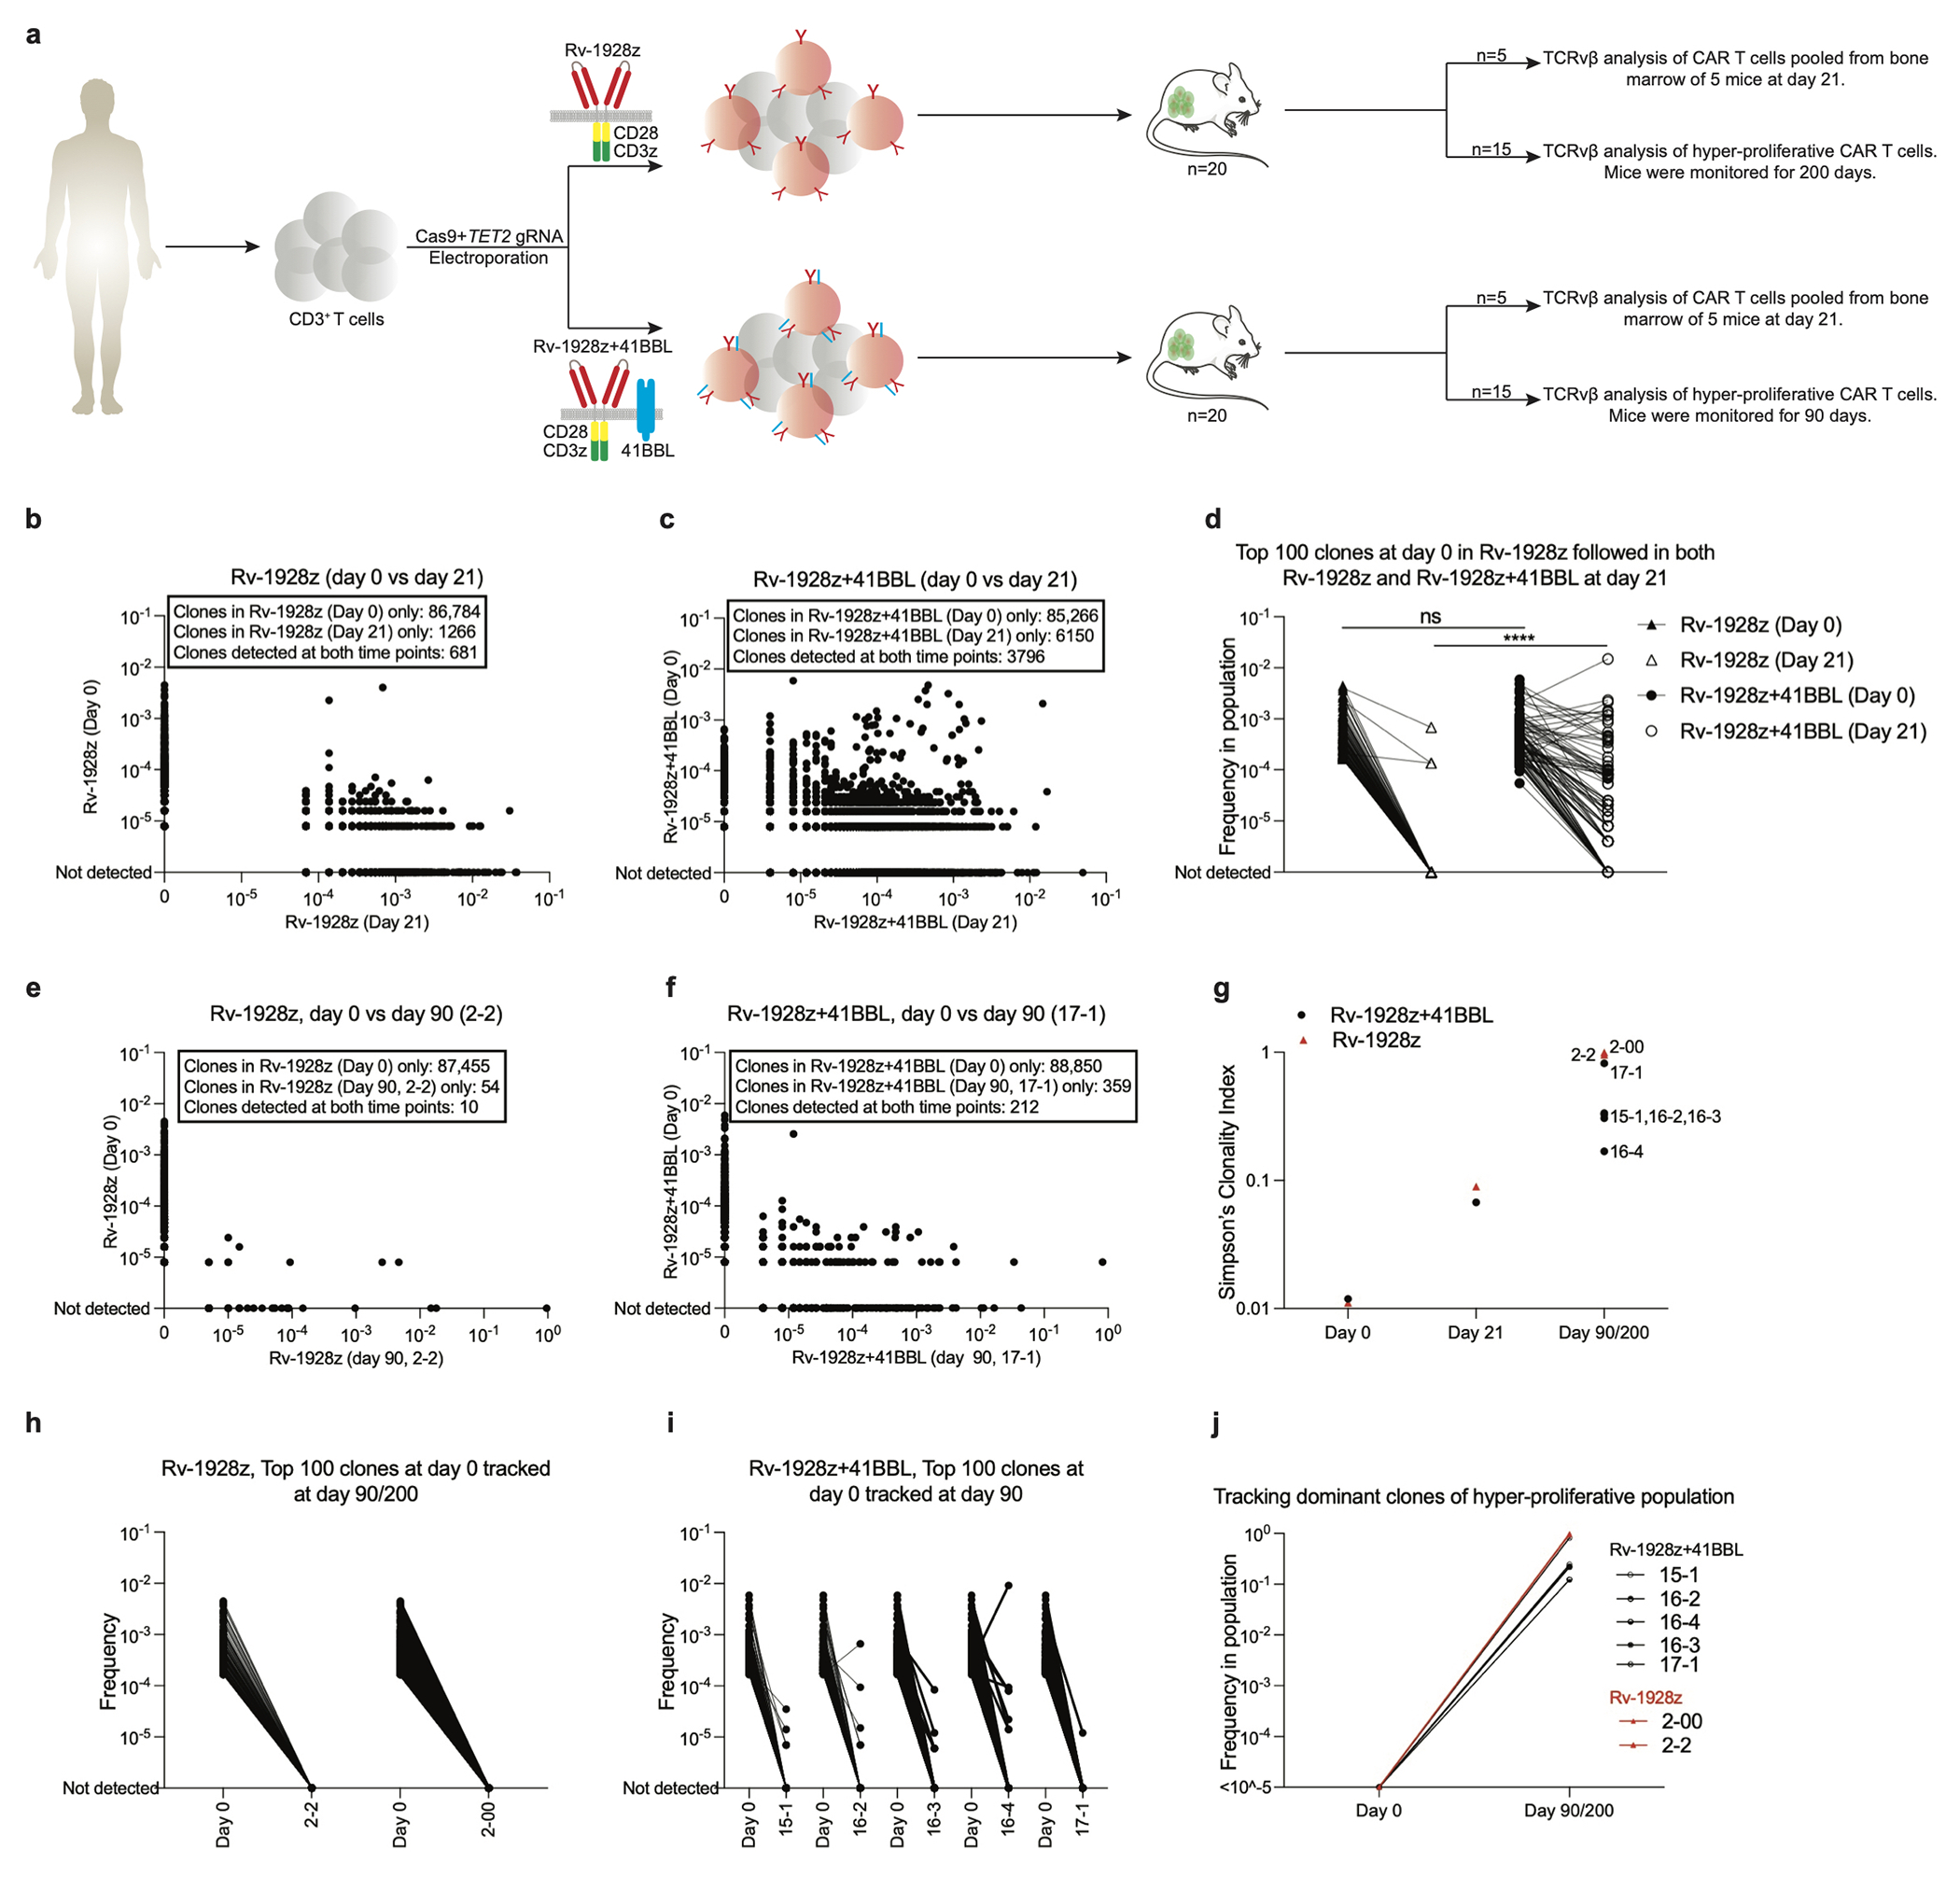
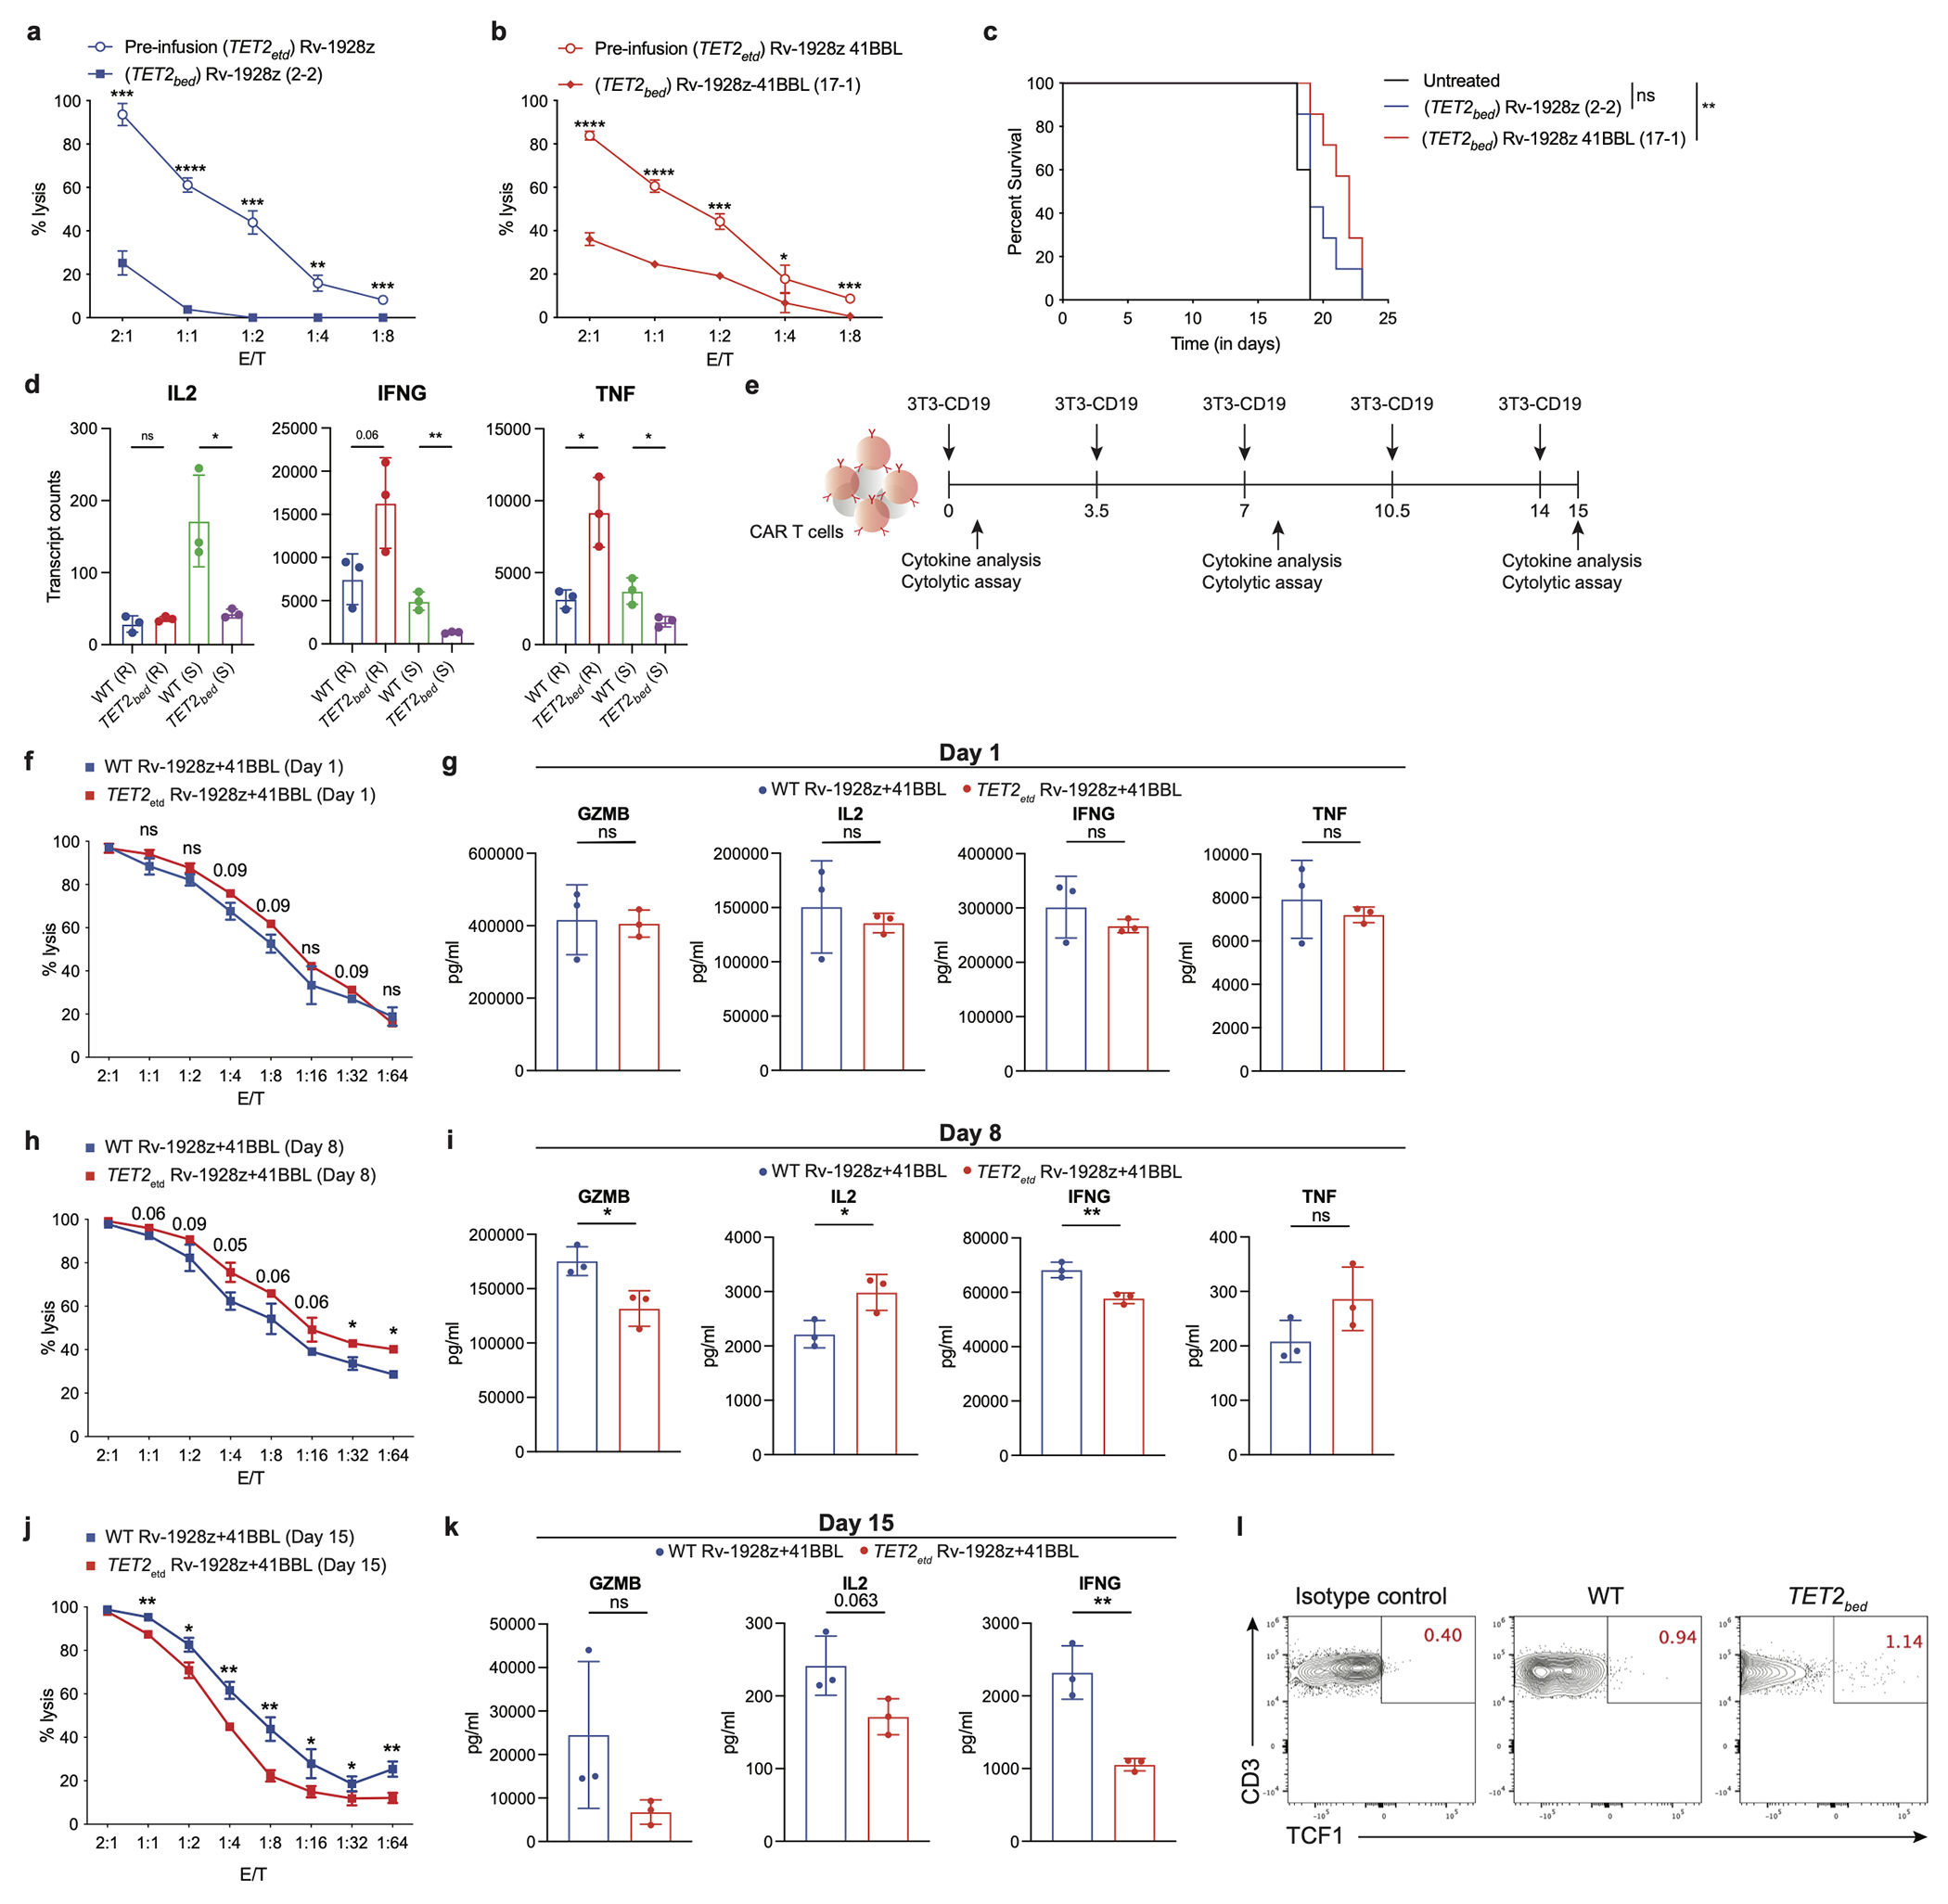
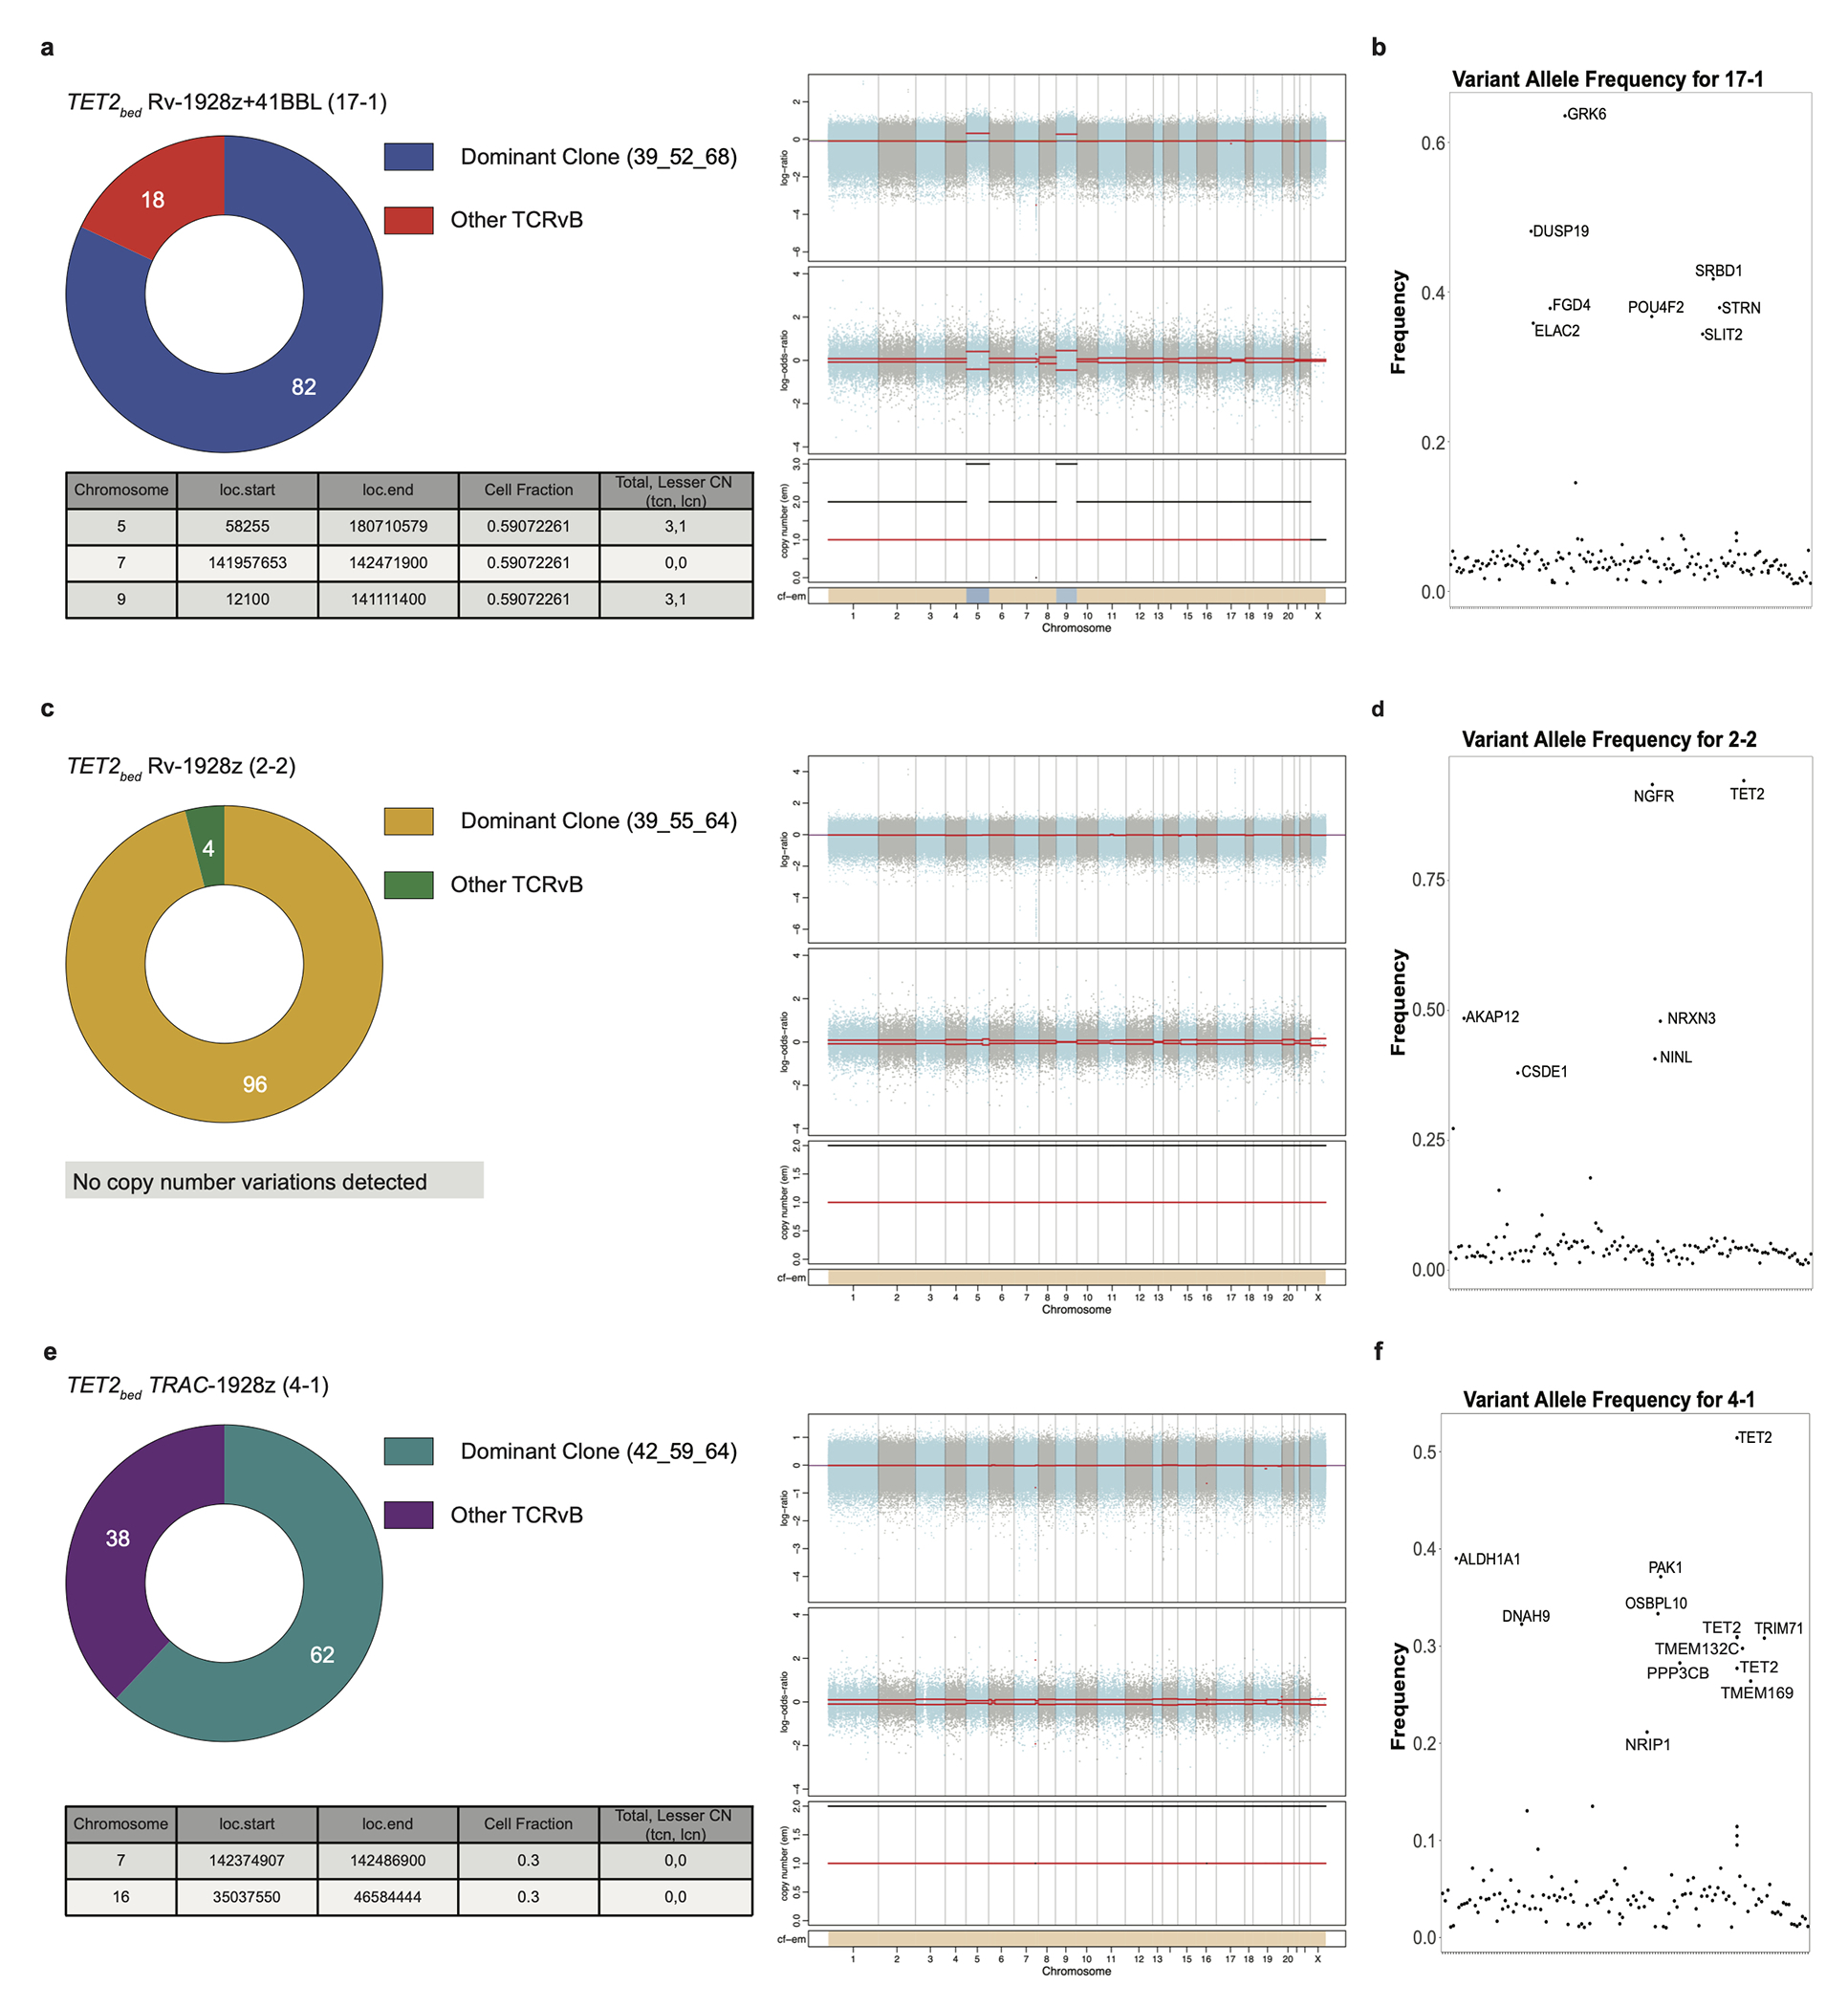
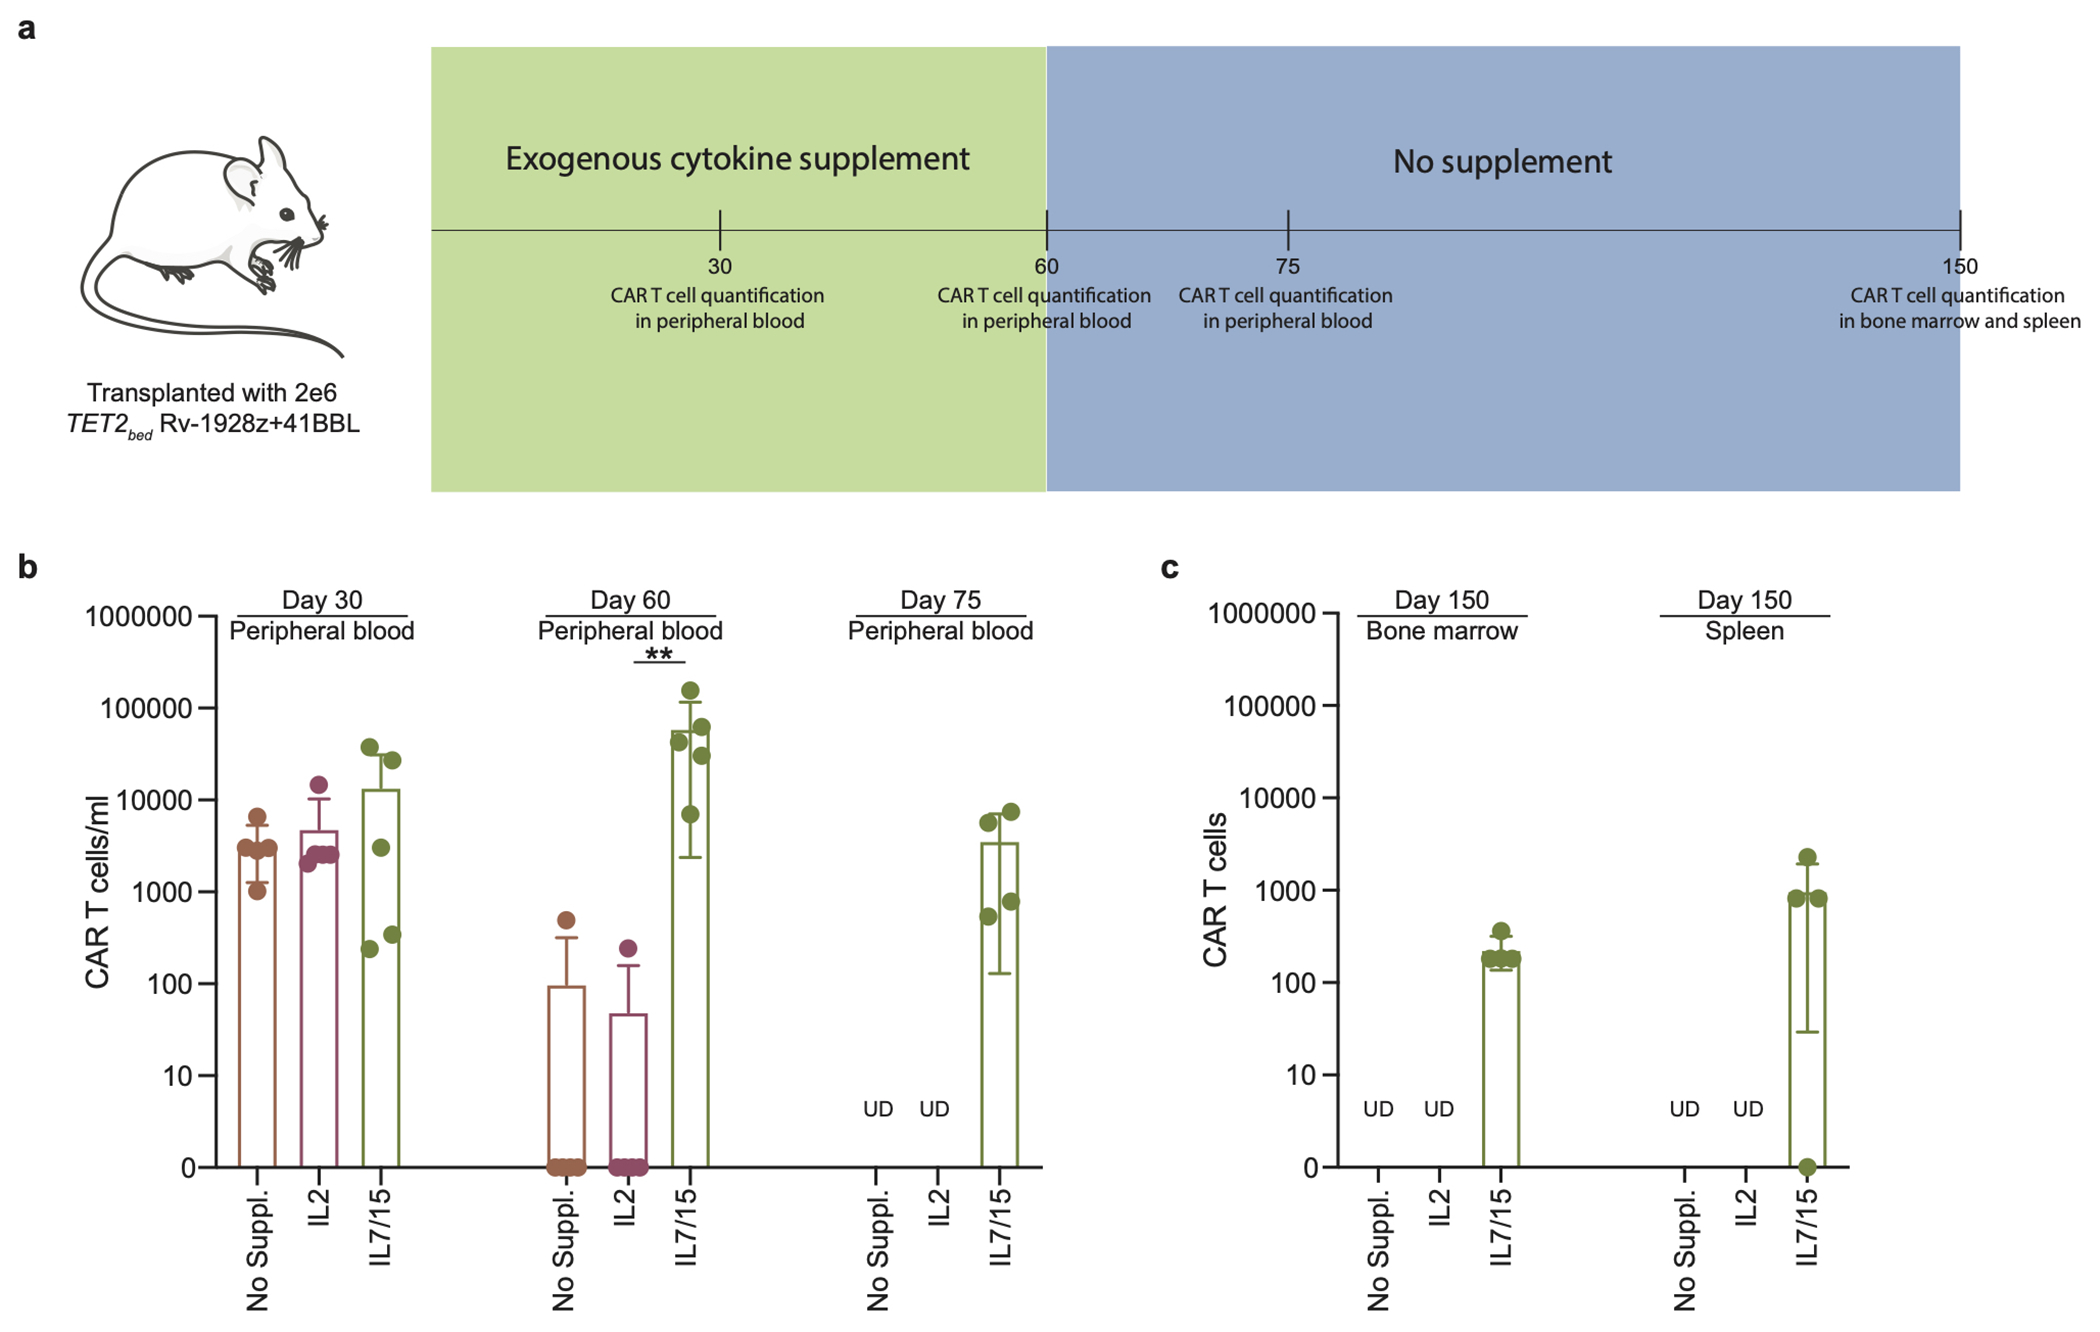
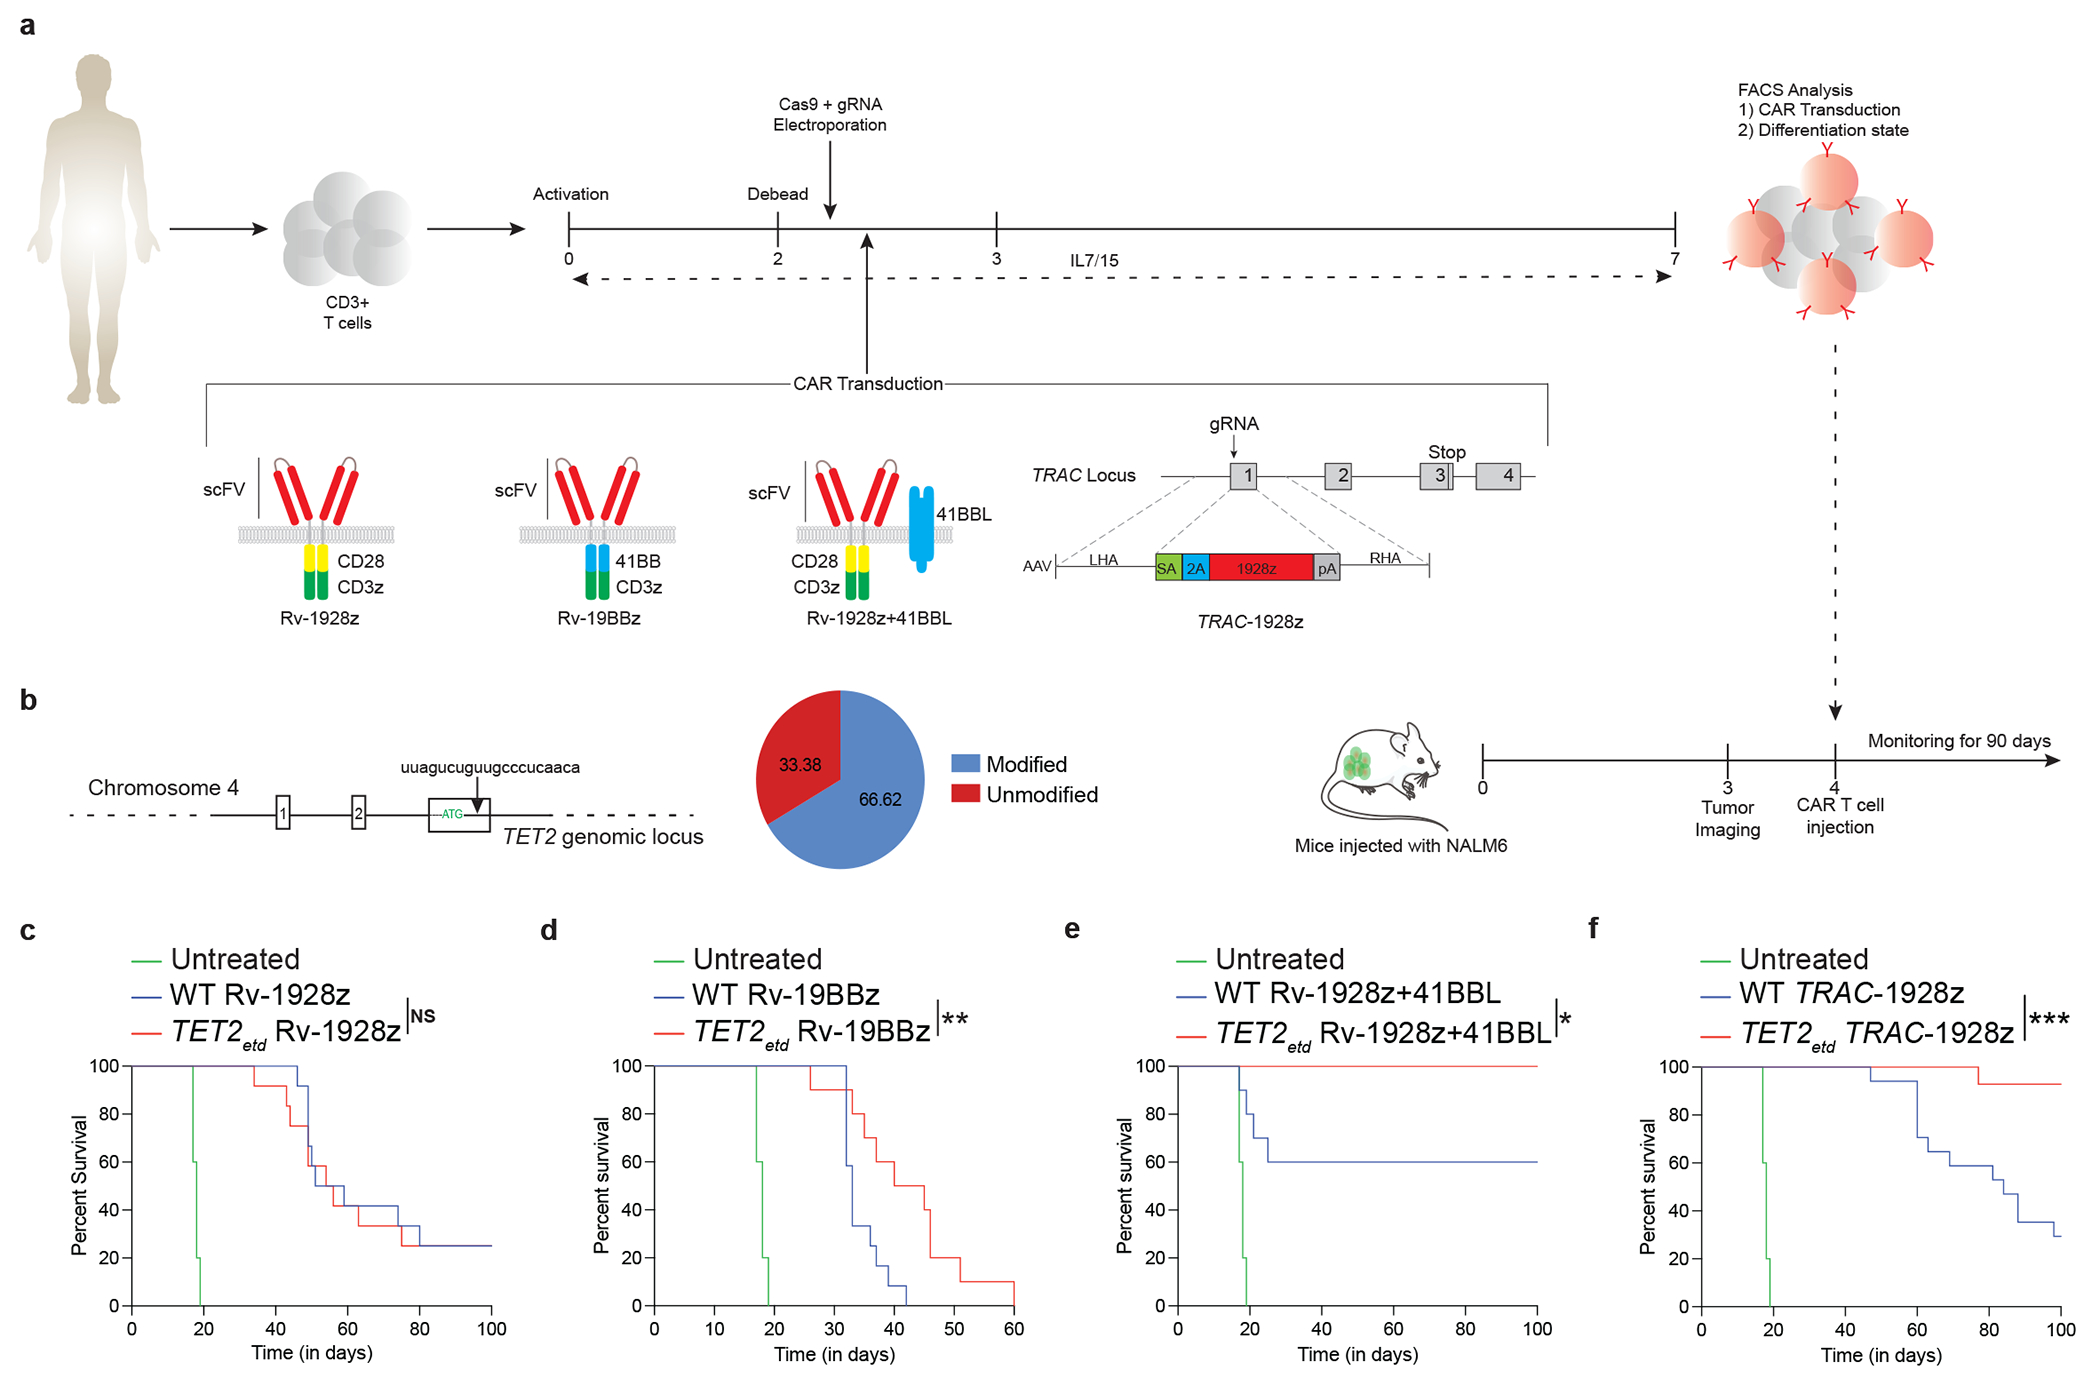
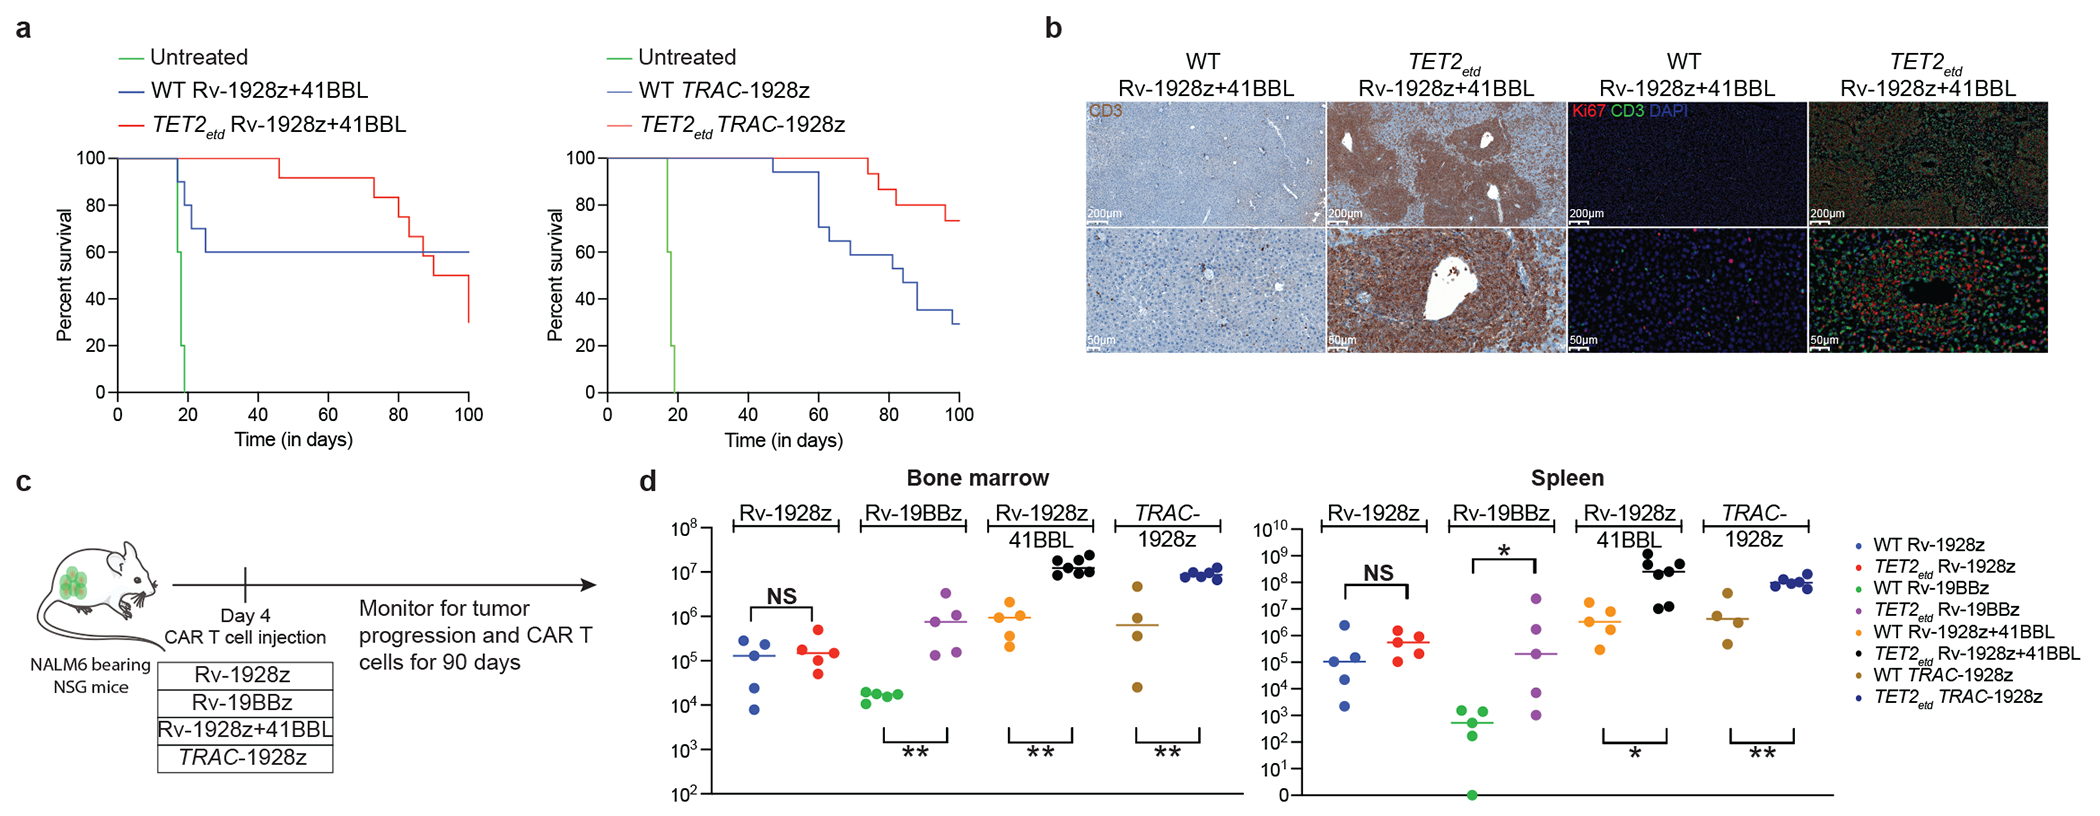
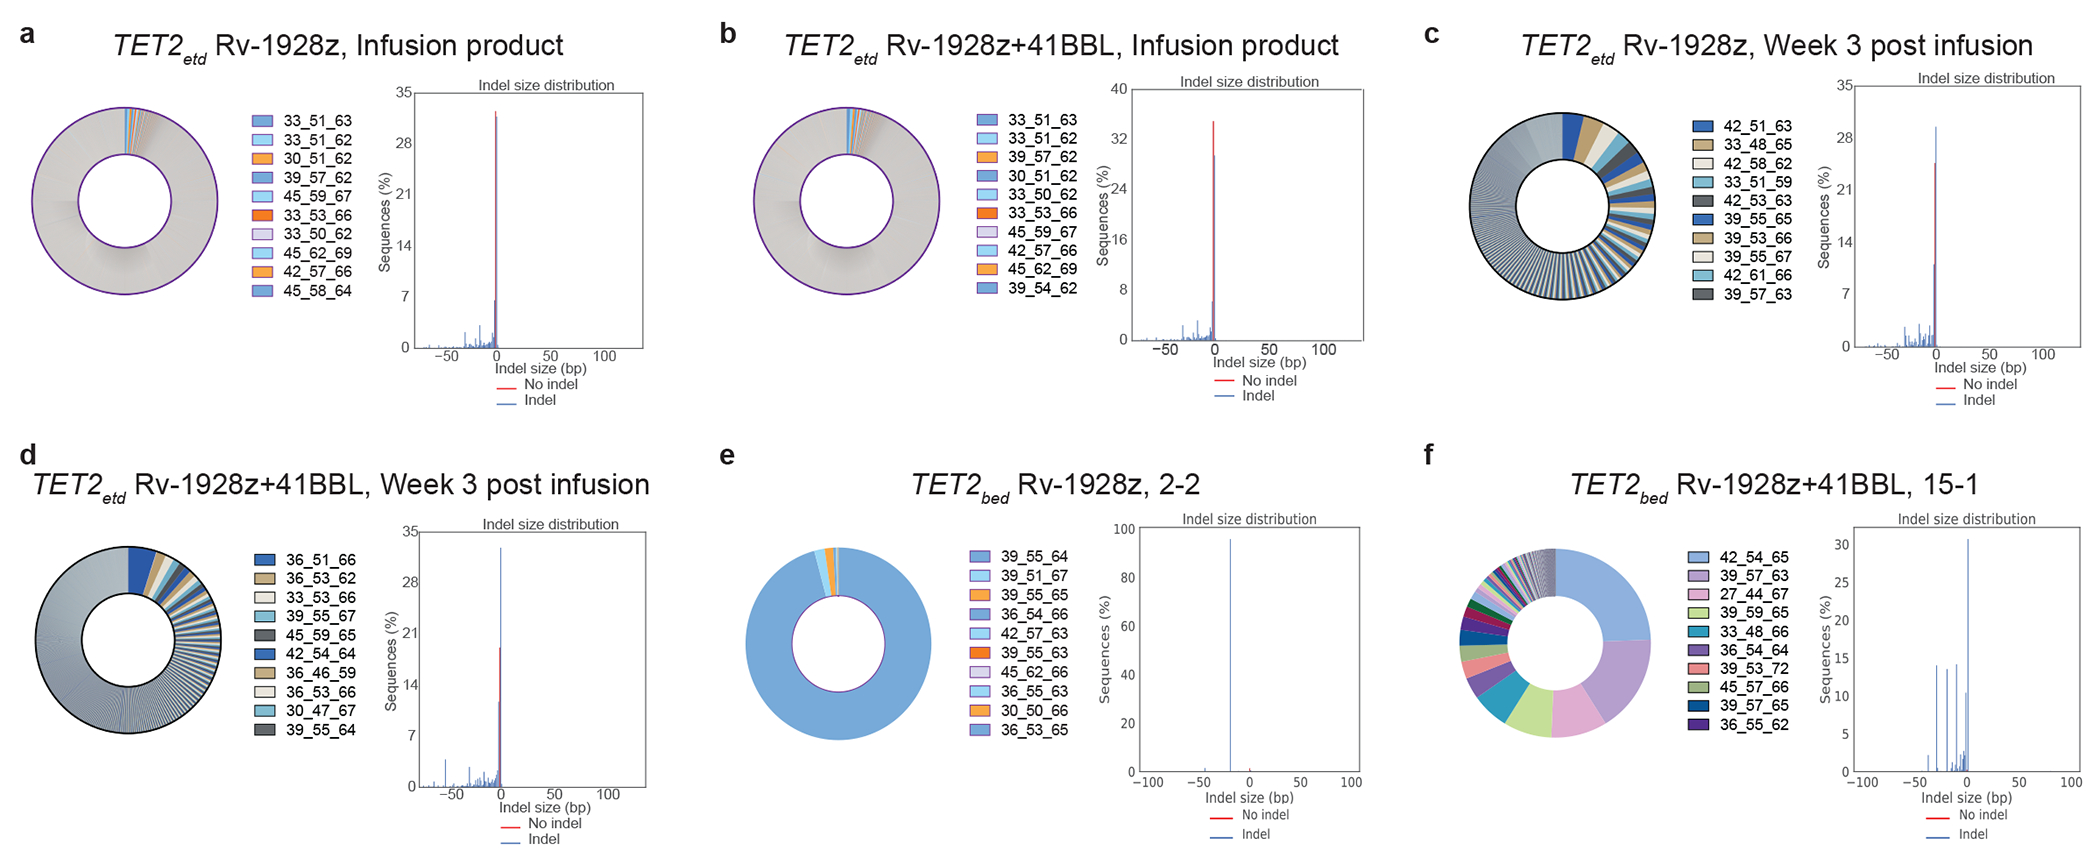
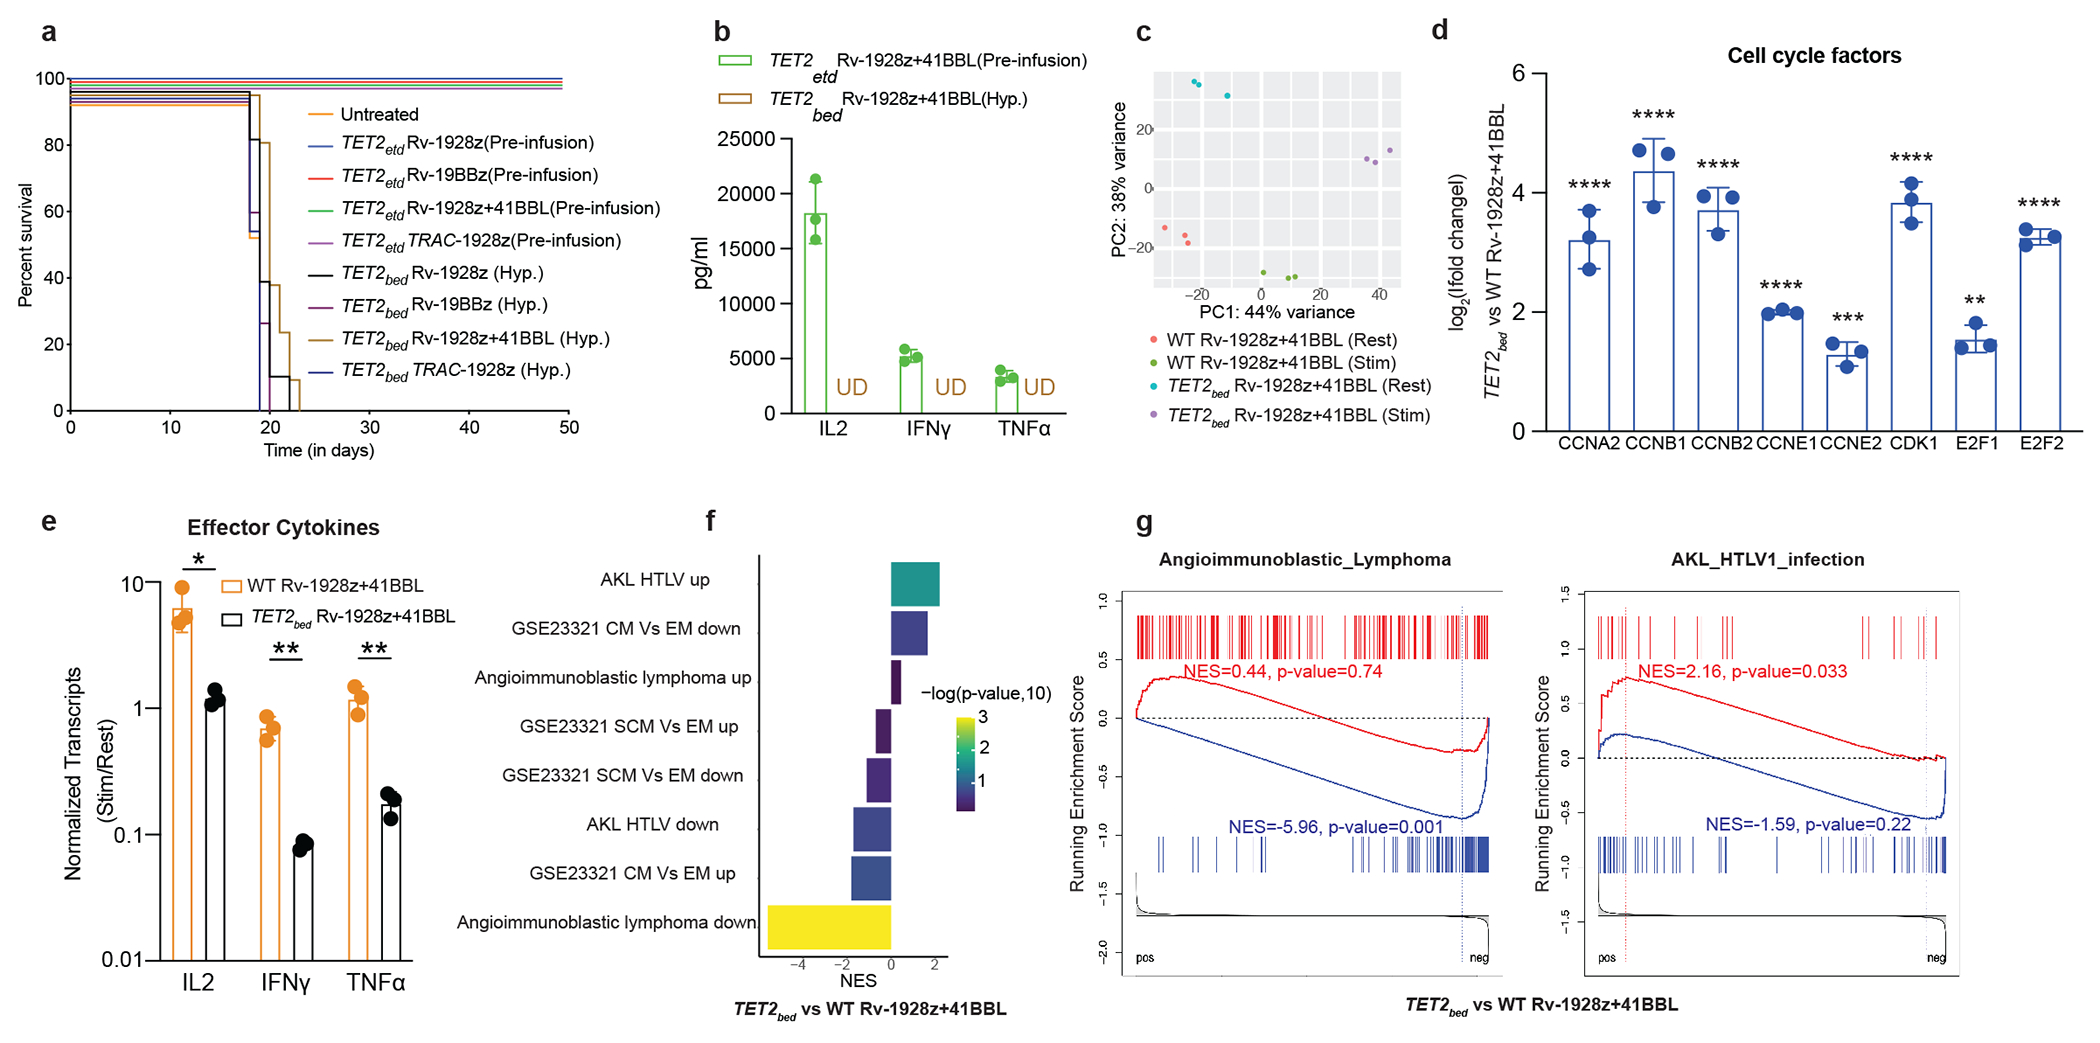
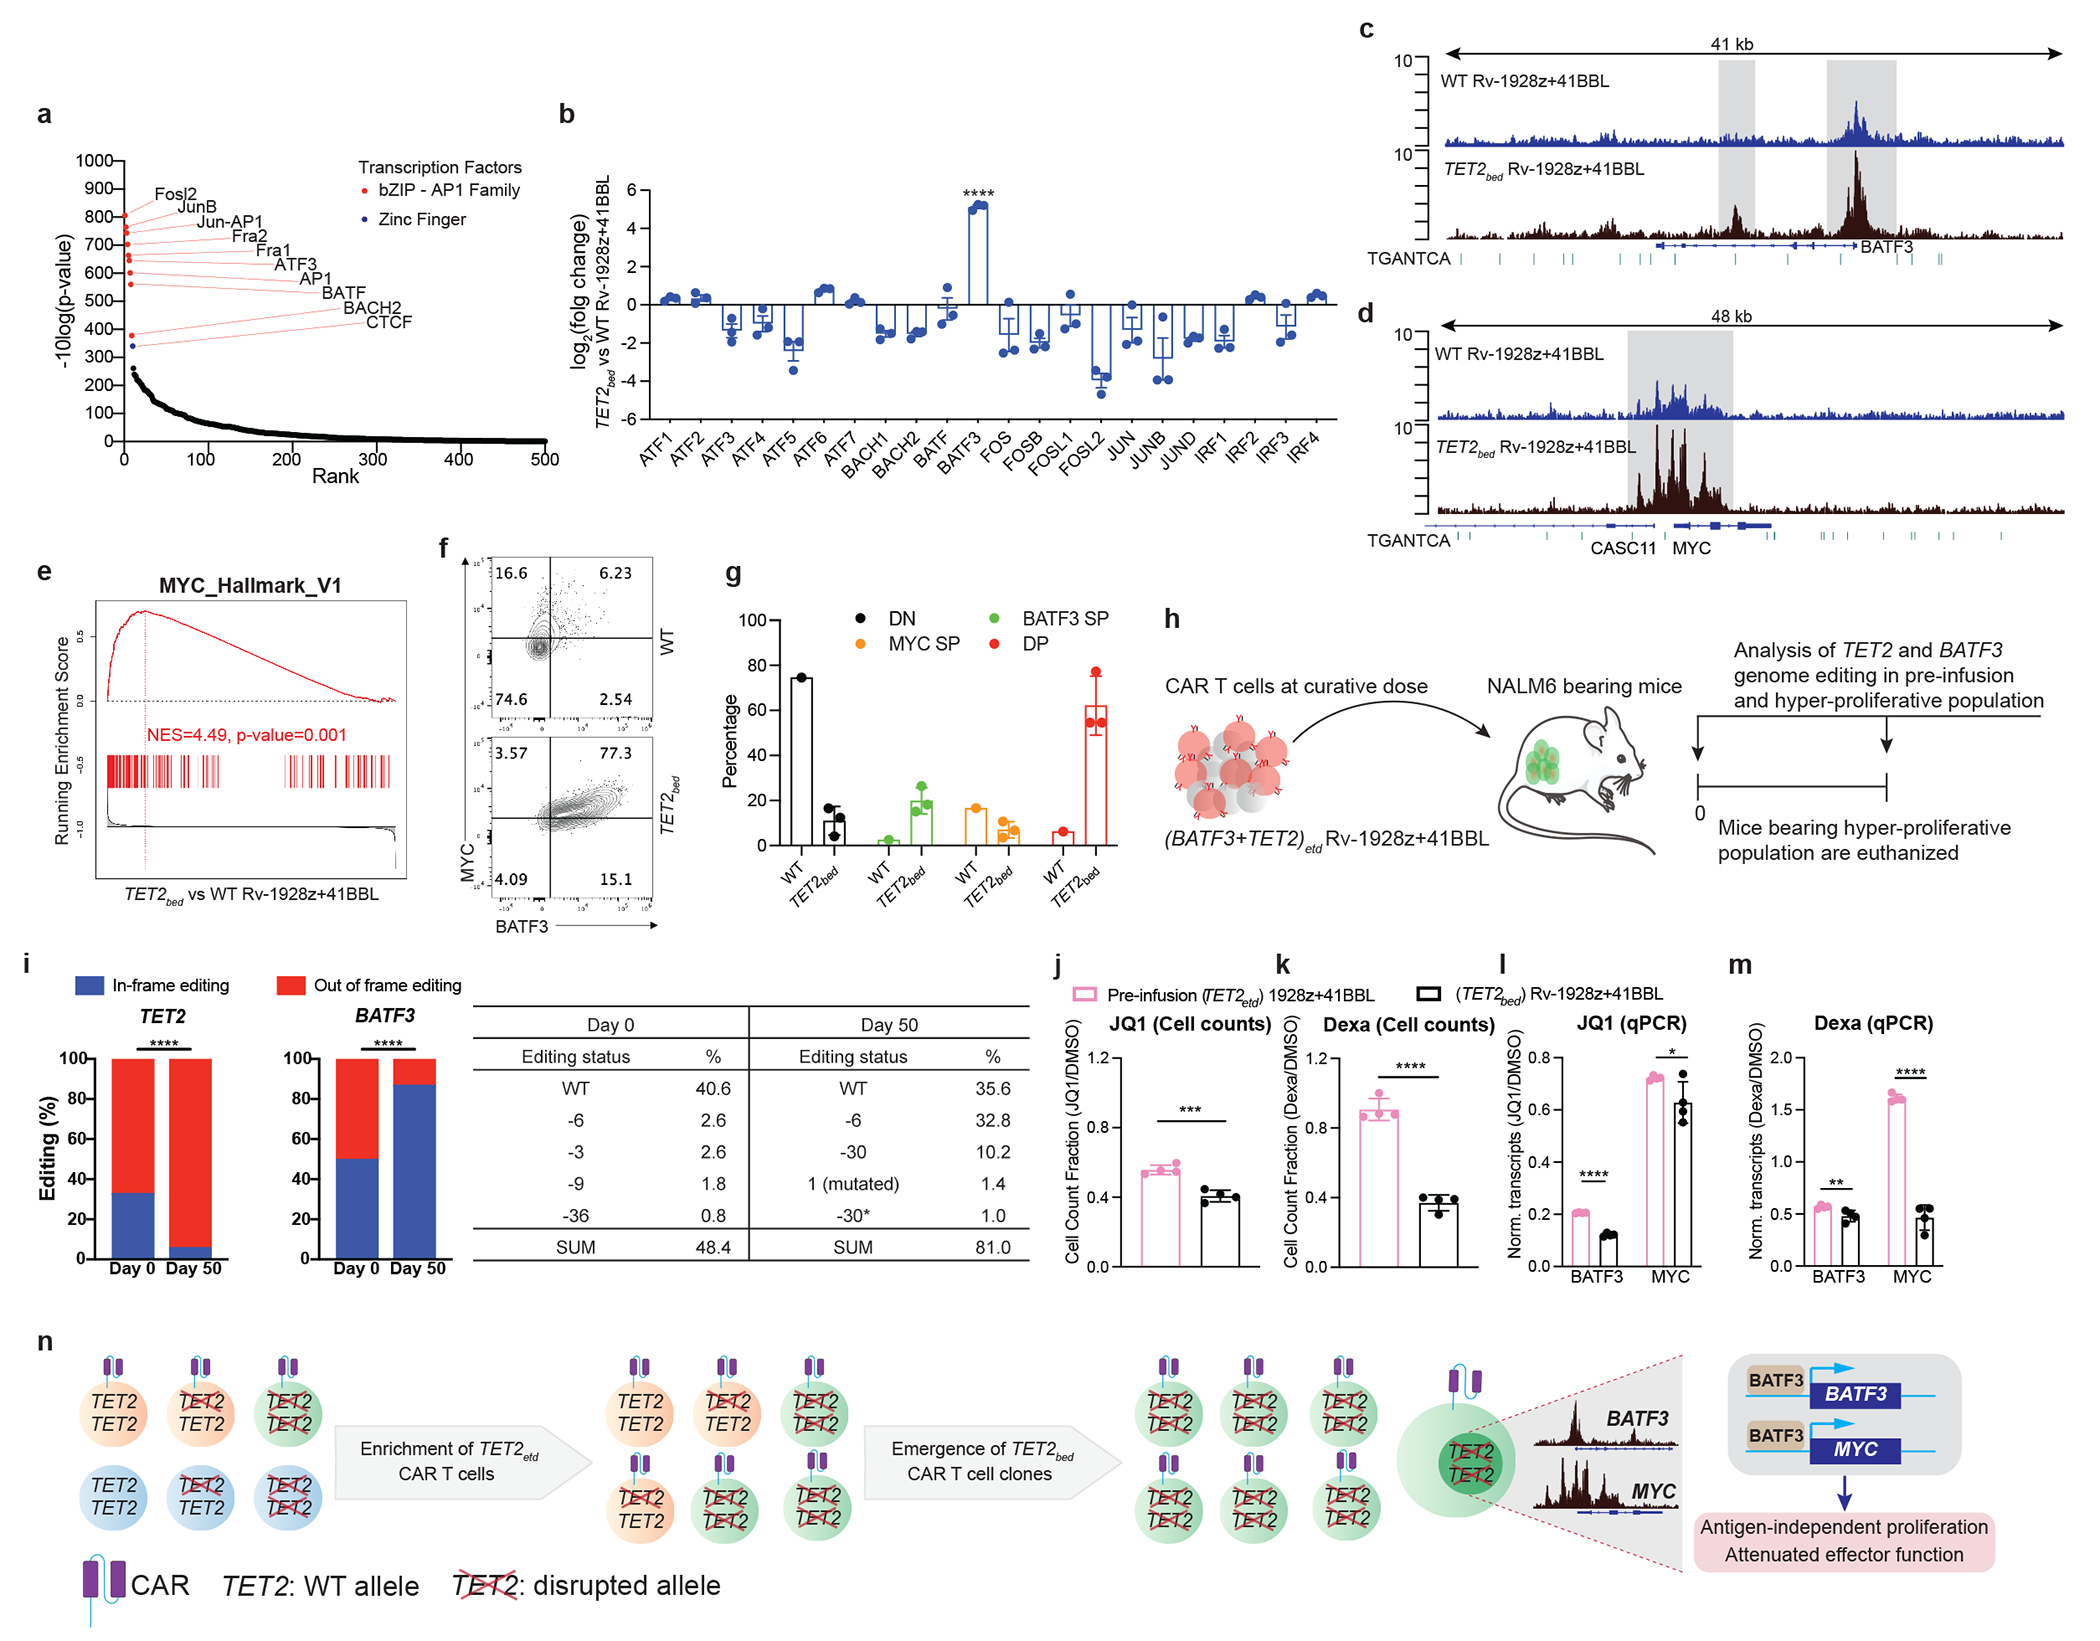
Further advances in cell engineering are needed to increase the efficacy of chimeric antigen receptor (CAR) and other T cell-based therapies1-5. As T cell differentiation and functional states are associated with distinct epigenetic profiles6,7, we hypothesized that epigenetic programming may provide a means to improve CAR T cell performance. Targeting the gene that encodes the epigenetic regulator ten-eleven translocation 2 (TET2)8 presents an interesting opportunity as its loss may enhance T cell memory9,10, albeit not cause malignancy9,11,12. Here we show that disruption of TET2 enhances T cell-mediated tumour rejection in leukaemia and prostate cancer models. However, loss of TET2 also enables antigen-independent CAR T cell clonal expansions that may eventually result in prominent systemic tissue infiltration. These clonal proliferations require biallelic TET2 disruption and sustained expression of the AP-1 factor BATF3 to drive a MYC-dependent proliferative program. This proliferative state is associated with reduced effector function that differs from both canonical T cell memory13,14 and exhaustion15,16 states, and is prone to the acquisition of secondary somatic mutations, establishing TET2 as a guardian against BATF3-induced CAR T cell proliferation and ensuing genomic instability. Our findings illustrate the potential of epigenetic programming to enhance T cell immunity but highlight the risk of unleashing unchecked proliferative responses.


Conflict of interest statement

DECLARATION OF INTERESTS

The authors declare no competing interests.

Figures

Extended Data Fig. 1:
Extended Data Fig. 1:. Rv-1928z and Rv-19BBz pre-infusion and in vivo CAR T cell phenotyping.
a,b, Pre-infusion transduction efficiency and phenotyping by flow cytometry of Rv-1928z (a) and Rv-19BBz (b) CAR T cells. c,d, Tumour monitoring of NALM6 bearing mice treated with Rv-1928z (c) and Rv-19BBz (d) CAR T cells. e,f, Bone marrow (e) and Splenic (f) CAR T cell quantification at 3 weeks post infusion. Data is represented as mean±SE [n=5 (Rv-1928z), n=6 (Rv-19BBz)]. g,h Differentiation phenotyping of pooled bone marrow CAR T cells at week 3 post infusion. Data from another experiment included in supplementary information. i, CAR T cell inhibitory receptor expression at week 3 post infusion from mouse bone marrow (n=3). p values were determined by two-sided Mann–Whitney test (e,f) and two-sided χ2 test (h). p<0.05 was considered statistically significant. p values are denoted: p>0.05, not significant, NS; *, p<0.05. Replicate information for g,i are available in SI Table 3. Exact p values are available in SI Table 4.
Extended Data Fig. 2:
Extended Data Fig. 2:. Rv-1928z+41BBL and TRAC-1928z pre-infusion and in vivo CAR T cell phenotyping.
a,b, Pre-infusion transduction efficiency and phenotyping by flow cytometry of Rv-1928z+ 41BBL (a) and TRAC-1928z (b) CAR T cells. c,d, Tumour monitoring of NALM6 bearing mice treated with Rv-1928z+41BBL (c) and TRAC-1928z (d) CAR T cells. e,f, Differentiation phenotyping of pooled bone marrow CAR T cells at week 3 post infusion. Data from another experiment included in supplementary information. g, CAR T cell inhibitory receptor expression at week 3 post infusion from mouse bone marrow (n=3). p values were determined by two-sided χ2 test (f). p<0.05 was considered statistically significant. p values are denoted: p>0.05, not significant, NS; *, p<0.05. Replicate information for e,g are available in SI Table 3.
Extended Data Fig. 3:
Extended Data Fig. 3:. Long-term CAR T cell phenotypes upon CRISPR/Cas9 editing of TET2 locus.
a,b, Differentiation phenotyping of retrovirally encoded CAR T cells (day 90) and TRAC-1928z CAR T cells (day 75) isolated from the bone marrow. c, Inhibitory receptor expression of bone marrow Rv-1928z, Rv-19BBz, Rv-1928z+41BBL (day 90) and TRAC-1928z (day 75) CAR T cells. p values were determined by two-sided χ2 test (b). p<0.05 was considered statistically significant. p values are denoted: p>0.05, not significant, NS; *, p<0.05; **, p< 0.01; ***, p<0.001; ****, p<0.0001. Replicate information for a,c are available in SI Table 3.
Extended Data Fig. 4:
Extended Data Fig. 4:. Effect of TET2 editing on CAR T cell accumulation in a prostate cancer model.
a, Schematics of the prostate cancer experimental design. TET2 was edited with the previously discussed gRNA (g1) and an alternative gRNA (g2). PSMA28z+41BBL (PSMA targeted, CD28 costimulated CAR that expresses 41BBL ligand) was used in this study (Dose: 2e5). b, CAR T cell counts in the peripheral blood 30 days post infusion of T cells. Bars show median values. c, Mice with the top 4 CAR T cell peripheral counts at day 30 across both TET2 targeting gRNA (g1, n=2. g2, n=2) were euthanized at day 45 along with 5 scrambled gRNA treated PSMA28z+41BBL mice and their splenic CAR T cell numbers were quantified. p values were determined by two-sided Mann-Whitney (b, c) [n=5 (WT PSMA28z+41BBL), n=8 (TET2etdg1 PSMA29z+41BBL), n=11 (TET2etdg1PSMA29z+41BBL)]. p<0.05 was considered statistically significant. p values are denoted: *, p<0.05; **, p< 0.01. Exact p values are available in SI Table 4.
Extended Data Fig. 5:
Extended Data Fig. 5:. Clonal expansion in all 4 hyper-proliferative CAR T cell populations.
a, Gel image of PCR product for WT CAR T cells and hyper-proliferative TET2-edited CAR T cells. The PCR is designed to amplify the site of gRNA editing. b, Enrichment of TET2-editing from pre-infusion (day 0) in mice to day 21 in Rv-1928z and Rv-1928z+41BBL CAR T cells. p values were determined by two-sided χ2 test. c,d, TCRvβ sequencing reveals hyper-proliferative populations that are dominant for a single clone in TET2bed Rv-1928z (c) and Rv-1928z+41BBL (d). Part of the retroviral vector that was inserted in the TET2 alleles of these clones is highlighted in the figures. e-g, Examples of hyper-proliferative Rv-1928z+41BBL CAR T cell populations that are oligoclonal (left panel) with biallelic TET2 editing (right panel). h, Western blot showing total loss of TET2 at protein level in different hyper-proliferative populations. i,j, Examples of oligoclonality in TET2bed TRAC-1928z (i) and Rv-19BBz (j). p<0.05 was considered statistically significant. p values are denoted: p>0.05, not significant, NS; *, p<0.05; **, p< 0.01.
Extended Data Fig. 6:
Extended Data Fig. 6:. TCR is dispensable for emergence of hyper-proliferative phenotype in TET2-edited Rv-1928z+41BBL CAR T cells.
a,b, Differentiation phenotyping of TCR+TET2ETD RV-1928z+41BBL (a) and TCRTET2ETD RV-1928z+41BBL (b) CAR T cells. c, Summary of emergence of hyper-proliferative phenotype post CAR T cell infusion in mice for different donors. Mice were monitored for 90 days. 2e5 CAR T cells were used for both the groups.
Extended Data Fig. 7:
Extended Data Fig. 7:. Properties of the chimeric antigen receptor design determine composition of TET2bed hyper-proliferative populations.
a, Rv-1928z or Rv-1928z+41BBL CAR T cells were generated from the same donor to assess the effect of CAR design on clonal persistence. 5 Mice were euthanized at day 21 to assess clonal diversity post tumour clearance. 15 mice were followed for emergence of a hyper-proliferative phenotype. b,c, Pair-wise analysis of Rv-1928z (b) and Rv-1928z+41BBL (c) at day 0 and day 21. d, Top 100 Rv-1928z clones at infusion were mapped in the Rv-1928z+41BBL infusion product. These clones were then assessed at day 21 for both the CAR receptors. p values were determined by two-tailed Mann-Whitney test. e,f, Pair-wise analysis (day 0 vs day 90) of the lone hyper-proliferative population found at day 90 for Rv-1928z CAR receptor (e). Representative pair-wise analysis (day 0 vs day 90) of a Rv-1928z+41BBL hyper-proliferative population (f). g, Changes in clonality index over time in Rv-1928z and Rv-1928z+41BBL CAR T cells. h,i, Tracking the fate of the 100 most abundant pre-infusion clones in the hyper-proliferative populations of Rv-1928z (h) and Rv-1928z+41BBL (i). (j) Retro-tracking late-stage dominant clones in the infusion product (Day 0). All dominant clones were isolated at day 90 except for 2-00 which was isolated at day 200. p<0.05 was considered statistically significant. p values are denoted: p>0.05, not significant, NS; *, p<0.05; **, p< 0.01; ***, p<0.001; ****, p<0.0001.
Extended Data Fig. 8:
Extended Data Fig. 8:. In vitro and in vivo effector function assessment of TET2-edited and hyper-proliferative TET2bed CAR T cells.
a,b, In vitro cytolytic activity assessment upon co-culture with NALM6 for 16-hrs as determined by luciferase activity for pre-infusion TET2-edited Rv-1928z (n=3) and hyper-proliferative TET2bed Rv-1928z (2-2) (n=3) (a) and pre-infusion TET2-edited Rv-1928z+41BBL (n=3) and hyper-proliferative TET2bed Rv-1928z+41BBL (17-1) (n=3) (b). Data is represented as mean±SD. c, NALM6 bearing NSG mice were treated with 2e6 hyper-proliferative TET2bed Rv-1928z (n=7) or TET2bed Rv-1928z+41BBL (n=7) CAR T cells to assess their in vivo anti-tumour efficacy. d, Normalized transcript counts of WT Rv-1928z+41BBL and TET2bed Rv-1928z+41BBLCAR T cells isolated from mice at day 90. R=Rest (Transcript counts at isolation). S= Stimulated (Transcript counts 24 hours post CD3/28 stimulation). Data is represented as mean±SD (n=3). e, Schematic of in vitro repeated rechallenge assay for effector function analysis. f, g, Day 1 in vitro cytolytic activity assessment (f) and effector cytokine assessment (g). h, i, Day 8 in vitro cytolytic activity assessment (h) and effector cytokine assessment (i). j, k, Day 15 in vitro cytolytic activity assessment (j) and effector cytokine assessment (k). Data in f-k is represented as mean±SD (n=3). l, TCF1 staining of WT Rv-1928z+41BBL and TET2bed Rv-1928z+41BBL CAR T cells isolated from mice at day 90. WT samples were a pool of 5 mice. TCF1 staining of other hyper-proliferative TET2bed CAR T cells in SI Table 3. p values in a, b, f, h, j were determined by two-sided unpaired t-test corrected by BKY method. p values in c were determined by two-sided Mann-Whitney test. p values in d, g, i, k were determined by two-sided unpaired t-test. p<0.05 was considered statistically significant. p values are denoted: p>0.1, not significant, ns. p<0.1 are indicated. *, p<0.05. **, p<0.01.***, p<0.001.****, p<0.0001. Exact p values are available in SI Table 4.
Extended Data Fig. 9:
Extended Data Fig. 9:. No conserved secondary genetic mutation between different hyper-proliferative TET2bed CAR T populations dominant for a single clone.
a, (Right panel) Copy number changes in TET2bed Rv-1928z+41BBL (17-1). The top panel displays log (ratio) denoted by “(logR)” with chromosomes alternating in the blue and gray. The middle panel displays log (odds-ratio) denoted by “(logOR)”. Segment means are plotted in red lines. In the bottom panel total (black) and minor (red) copy number are plotted for each segment. The bottom bar shows the associated cellular fraction (cf). Dark blue indicates high cf. Light blue indicates low cf. Beige indicates a normal segment (total=2, minor=1). The table shows genetic events occurring at >0.1 cf. (Left panel) CAR T cell clonality as determined by vβ sequencing in TET2bed Rv-1928z+41BBL (17-1). b, Nonsynonymous acquired point mutations in TET2bed Rv-1928z+41BBL (17-1). Mutations that occur at a frequency > ((dominant TCRvβ frequency/2) −0.1) or >0.3 whichever is lower is annotated. c, (Right panel) Copy number changes in TET2bed Rv-1928z (2-2). (Left panel) CAR T cell clonality as determined by vβ sequencing in TET2bed Rv-1928z (2-2). d, Nonsynonymous acquired point mutations in TET2bed Rv-1928z (2-2). e, (Right panel) Copy number changes in TET2bed TRAC-1928z (4-1). (Left panel) CAR T cell clonality as determined by vβ sequencing in TET2bed TRAC-1928z (4-1). f, Nonsynonymous acquired point mutations in TET2bed TRAC-1928z (4-1).
Extended Data Fig. 10:
Extended Data Fig. 10:. Hyper-proliferative TET2bed Rv-1928z+41BBL do not achieve uncontrolled proliferative state upon secondary transplant.
a, Schematics of secondary transplant of hyper-proliferative TET2bed Rv-1928z+41BBL cells. The exogenous cytokine supplement had to be stopped at day 60 due to deteriorating mice condition in response to frequent injections. b, CAR T cell quantification in peripheral blood under different exogenous supplementation at day 30, day 60 and day 75. Each dot represents a mouse. UD: undetected. Data is represented as mean±SD (n=5). c, CAR T cell quantification in bone marrow and spleen at day 150 post CAR T cell infusion. Data is represented as mean±SD (n=5 for no supplement, and IL2. n=4 for IL7/15). p values were determined by two-sided Mann–Whitney test (b). p<0.05 was considered statistically significant. p values are denoted: p>0.05, not significant, NS; *, p<0.05; **, p< 0.01.(b). Exact p values are available in SI Table 4.
Fig. 1:
Fig. 1:. Effect of TET2 disruption on CAR T cell therapeutic efficacy is dependent on CAR design.
a,b, Schematics of in vitro CAR T cell generation and murine NALM6 model (a). TET2 targeting gRNA and editing efficiency (b). c,d, Mice survival under Rv-1928z (dose: 1e5, n=12) (c) and Rv-19BBz (dose: 2e5, n=12) (d) CAR T cell treatments. e,f, Cancer free survival of mice treated with Rv-1928z+41BBL (dose: 5e4, n=10) (e) and TRAC-1928z (dose: 1e5, n=15) (f) CAR T cells. Data collated from 2 donors. Untreated (n=5). log-rank Mantel–Cox test, p<0.05 was considered statistically significant. p values are denoted: p>0.05, not significant, NS; *, p<0.05; **, p< 0.01; ***, p<0.001 (c-f).
Fig. 2:
Fig. 2:. Effect of CAR design on long term T cell accumulation upon CRISPR/Cas9 editing of TET2 locus.
a, Overall survival of NALM6-bearing mice treated with Rv-1928z+41BBL (n=10) and TRAC-1928z (n=15). b, Immunohistochemistry (IHC) and Immunofluorescence (IF) staining of a liver section of mice treated with WT Rv-1928z+41BBL and TET2etd Rv-1928z+41BBL at day 90. Across 4 CARs, IHC and IF were performed for 15 mice treated with WT CAR T cells and 20 mice treated with TET2etd CAR T cells. c, Schematics of long-term CAR T cell and tumor monitoring. Rv-1928z were used at 4e5, Rv-19BBz were used at 5e5, Rv-1928z+ 41BBL were used at 2e5 and TRAC-1928z CAR T cells were used at 4e5 dose. d, CAR T cell quantification in the bone marrow (left panel) and spleen (right panel). Bars show median values. Two-sided Mann-Whitney test [n=5 (Rv-1928z), n=5 (Rv-19BBz), n=5 (WT Rv-1928z+41BBL), n=7 (TET2etd Rv-1928z+41BBL), n=4 (WT TRAC-1928z), n=5 (TET2etd TRAC-1928z)]. p<0.05 was considered statistically significant. p values are denoted: p>0.05, not significant, NS; *, p<0.05; **, p< 0.01. Exact p values are available in SI Table 4 (d).
Fig 3:
Fig 3:. Hyper-proliferative TET2-edited CAR T populations are oligoclonal and biallelically edited for TET2.
a,b, Pre-infusion TCRvβ sequencing (left panel) and TET2 status (right panel) of Rv-1928z (a) and Rv-1928z+41BBL (b). CAR T cells were generated from the same donor. c,d, TCRvβ sequencing (left panel) and TET2 status (right panel) of Rv-1928z (c) and Rv-1928z+41BBL (d). CAR T cells isolated at week 3 post infusion in mice. e,f, TCRvβ sequencing (left panel) and TET2 status (right panel) of hyper-proliferative Rv-1928z (e) and Rv-1928z+41BBL (f). CAR T cell population reveals multiple clones from the pre-infusion population can become hyper-proliferative but they require biallelic TET2 editing. Hyper-proliferative CAR T cells were isolated at day 90.
Fig. 4:
Fig. 4:. Loss of effector function in hyper-proliferative TET2bed CAR T cells.
a, NALM6 bearing NSG mice were either treated with 5e5 hyper-proliferative TET2bed Rv-1928z (n=7), Rv-19BBz (n=3), Rv-1928z+41BBL (n=7) and TRAC-1928z (n=5) CAR T cells or pre-infusion TET2-edited Rv-1928z (dose: 4e5), Rv-19BBz (dose: 5e5), Rv-1928z+41BBL (dose: 2e5) and TRAC-1928z (dose: 4e5) (n=5 for all pre-infusion TET2-edited CAR T cells). b, Effector cytokine secretion upon activation of pre-infusion TET2-edited and hyper-proliferative Rv-1928z+41BBL population. Data is represented as mean±SD (n=3). c, Principal component analysis of resting and stimulated (24-hrs post co-culture with CD3/28 beads at 1:1 bead to cell ratio) of WT Rv-1928z+41BBL and TET2bed Rv-1928z+41BBL. d, Elevated levels of cell cycle factors in TET2bed Rv-1928z+41BBL as compared to WT Rv-1928z+41BBL. Data is represented as mean±SD (n=3). p values were determined by Wald test with FDR correction (two-sided). e, Reduced induction of effector cytokines in response to CD3/28 bead stimulation in TET2bed Rv-1928z+41BBL as compared to WT Rv-1928z+41BBL. Data is represented as mean±SD (n=3). p values were determined by two-sided t-test with FDR correction. f,g, Geneset enrichment analysis (GSEA) reveals no enrichment in central memory (CM) and stem cell memory (SCM) compartments for TET2bed Rv-1928z+41BBL as compared to WT Rv-1928z+41BBL (f). Enrichment in Angioimmun-oblastic Lymphoma (AITL) and HTLV-1 driven Adult T cell lymphoma/leukemia genesets of TET2bed Rv-1928z+41BBL (g). p values in f, g were corrected for multiple comparisons by BKY method. p<0.05 was considered statistically significant. p values are denoted: p>0.05, not significant, NS; *, p<0.05; **, p< 0.01; ***, p<0.001; ****, p<0.0001. Exact p values are available in SI Table 4.
Fig. 5:
Fig. 5:. BATF3/MYC axis drives hyper-proliferation of TET2bed CAR T cells.
a, AP1 binding motif was most significantly enriched in open chromatin region of TET2bed Rv-1928z+41BBL. b, RNA expression of AP1-family transcriptional factors in TET2bed Rv-1928z+41BBL and WT Rv-1928z+41BBL. Data is represented as mean±SD (n=3). p values were determined by Wald test with FDR correction (two-sided). c,d, Increased genomic accessibility (Highlighted by grey background) in promoter and gene body regions of BATF3 (c) and MYC (d). AP1 binding motif marked by green dashes. e, Geneset enrichment analysis reveals increased MYC signaling in TET2bed Rv-1928z+41BBL as compared to WT Rv-1928z+41BBL. p values were corrected for multiple comparisions by BKY method. f,g, Flow cytometry for BATF3 and MYC in WT and TET2bed Rv-1928z+41BBL CAR T cells at day 90 (f). WT sample was pooled from 10 mice. TET2bed sample is representative population from one mouse in (f). Data in g is summary of 3 mice and is presented as mean±SD. h, Schematics of TET2 and BATF3 dual editing study. i,TET2 and BATF3 editing outcomes were determined at pre-infusion and hyper-proliferation. p-values were determined by two-sided χ2 test (i). j,k, Cells were either treated with DMSO, JQ1 (500nM) or dexamethasone (dexa, 1μm). DMSO normalized cell counts for JQ1 (j) and dexa (k). Data is represented as mean±SD (n=4). p values were determined by two-sided unpaired t-test. l,m, qPCR study for BATF3 and MYC under JQ1 and dexa treatment. Transcripts were normalized to B2M. DMSO normalized BATF3 and MYC levels under JQ1 treatment (l) and dexa (m). Data is represented as mean±SD (n=4). p values were determined by two-sided multiple unpaired t-tests corrected by BKY method. n, Graphical model summarizing the results. p<0.05 was considered statistically significant. p values are denoted: p>0.05, not significant, NS; *, p<0.05; **, p< 0.01; ***, p<0.001; ****, p<0.0001. Exact p values are available in SI Table 4.

Comment in

References

    1. Kakarla S & Gottschalk S CAR T cells for solid tumors: armed and ready to go? Cancer J 20, 151–155 (2014). 10.1097/PPO.0000000000000032 - DOI - PMC - PubMed
    1. Sadelain M, Riviere I & Riddell S Therapeutic T cell engineering. Nature 545, 423–431 (2017). 10.1038/nature22395 - DOI - PMC - PubMed
    1. June CH & Sadelain M Chimeric Antigen Receptor Therapy. N Engl J Med 379, 64–73 (2018). 10.1056/NEJMra1706169 - DOI - PMC - PubMed
    1. Guedan S, Calderon H, Posey AD Jr. & Maus MV Engineering and Design of Chimeric Antigen Receptors. Mol Ther Methods Clin Dev 12, 145–156 (2019). 10.1016/j.omtm.2018.12.009 - DOI - PMC - PubMed
    1. Globerson Levin A, Riviere I, Eshhar Z & Sadelain M CAR T cells: Building on the CD19 paradigm. Eur J Immunol 51, 2151–2163 (2021). 10.1002/eji.202049064 - DOI - PMC - PubMed

Methods Reference

    1. Riviere I, Brose K & Mulligan RC Effects of retroviral vector design on expression of human adenosine deaminase in murine bone marrow transplant recipients engrafted with genetically modified cells. Proc Natl Acad Sci U S A 92, 6733–6737, doi:10.1073/pnas.92.15.6733 (1995). - DOI - PMC - PubMed
    1. Gallardo HF, Tan C, Ory D & Sadelain M Recombinant retroviruses pseudotyped with the vesicular stomatitis virus G glycoprotein mediate both stable gene transfer and pseudotransduction in human peripheral blood lymphocytes. Blood 90, 952–957 (1997). - PubMed
    1. Brentjens RJ et al. Eradication of systemic B-cell tumors by genetically targeted human T lymphocytes co-stimulated by CD80 and interleukin-15. Nat Med 9, 279–286, doi:10.1038/nm827 (2003). - DOI - PubMed
    1. Brentjens RJ et al. Genetically targeted T cells eradicate systemic acute lymphoblastic leukemia xenografts. Clin Cancer Res 13, 5426–5435, doi:10.1158/1078-0432.CCR-07-0674 (2007). - DOI - PubMed
    1. Gong MC et al. Cancer patient T cells genetically targeted to prostate-specific membrane antigen specifically lyse prostate cancer cells and release cytokines in response to prostate-specific membrane antigen. Neoplasia 1, 123–127, doi:10.1038/sj.neo.7900018 (1999). - DOI - PMC - PubMed

Publication types

MeSH terms