. 2023 Feb;614(7949):725-731.
doi: 10.1038/s41586-023-05705-5. Epub 2023 Feb 8.

The cellular coding of temperature in the mammalian cortex

Affiliations

The cellular coding of temperature in the mammalian cortex

M Vestergaard et al. Nature. 2023 Feb.

Abstract

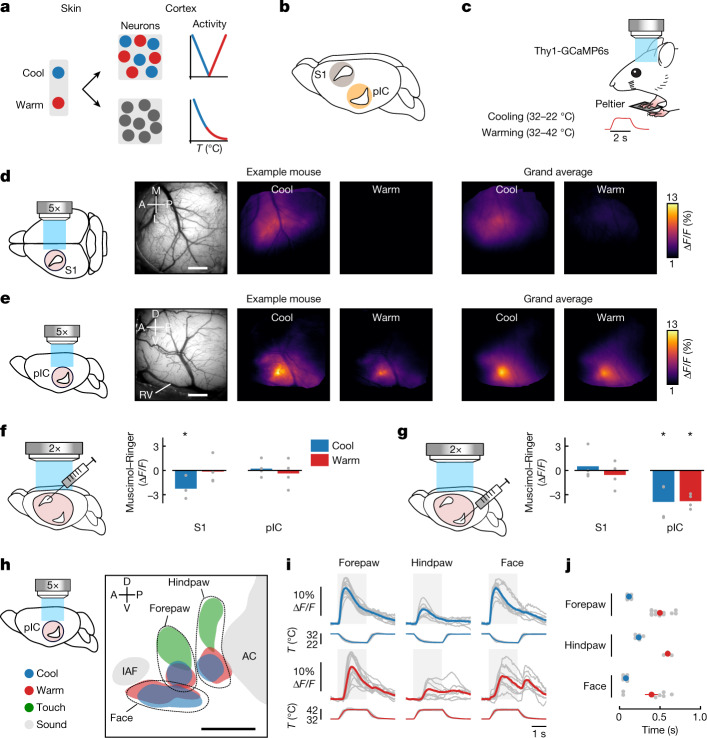
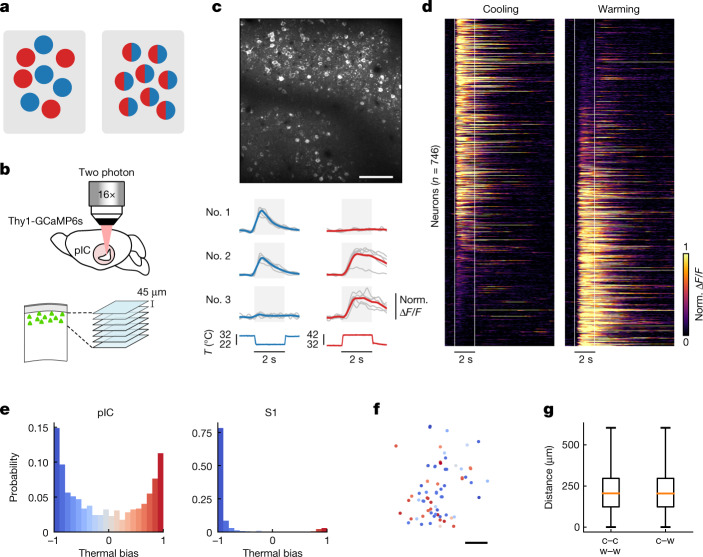
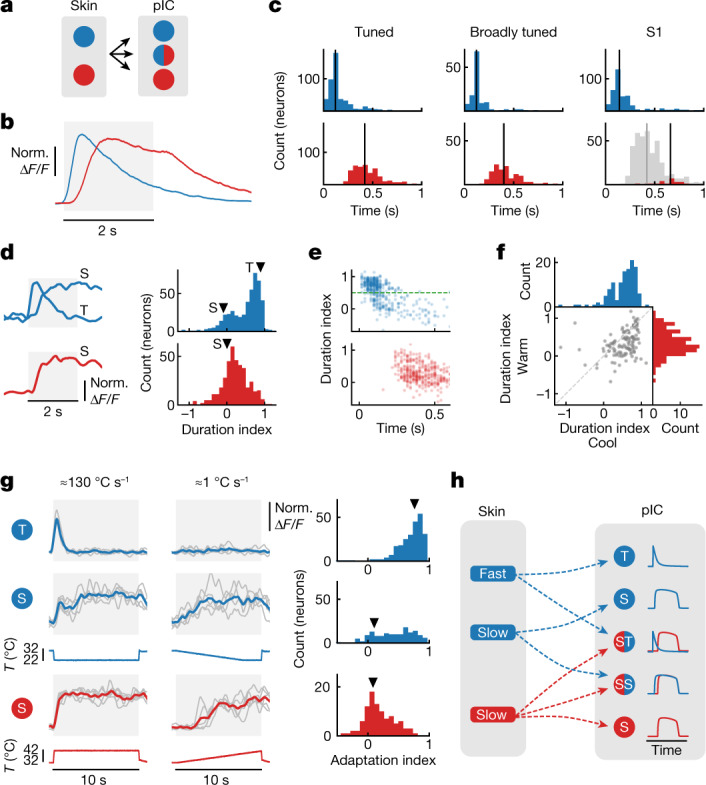
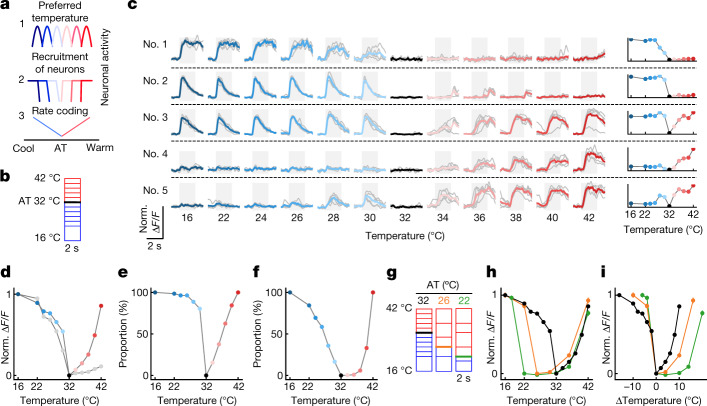
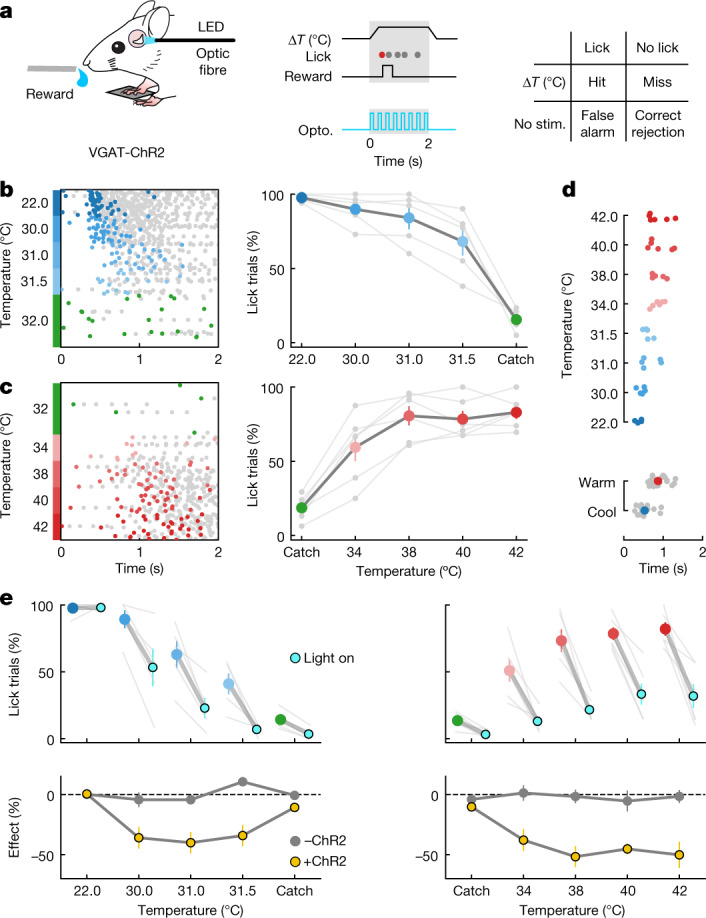
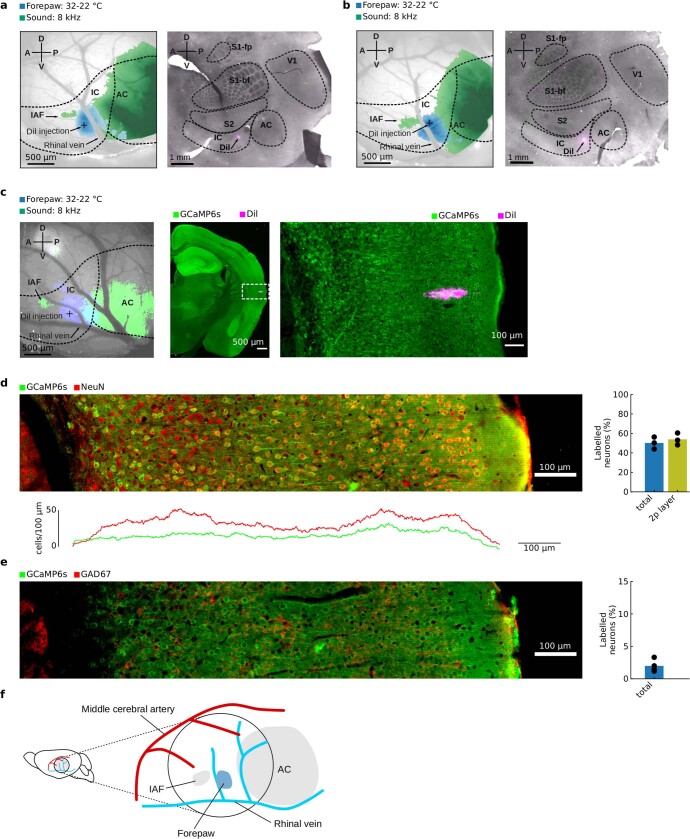
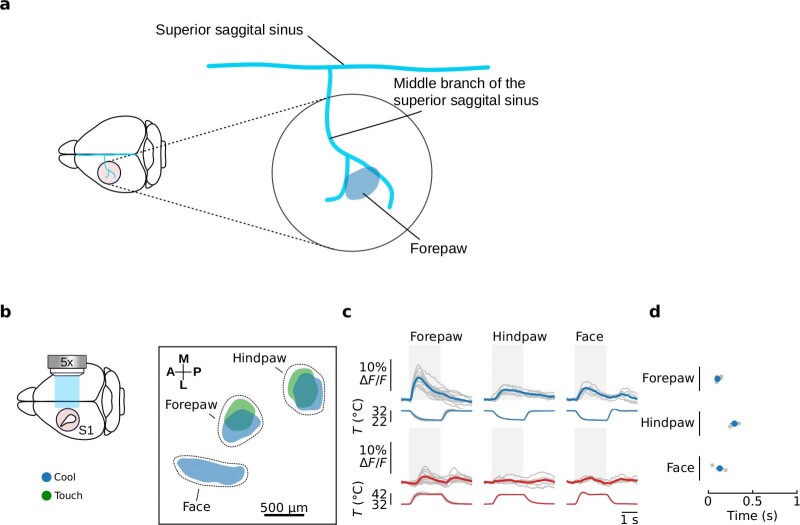
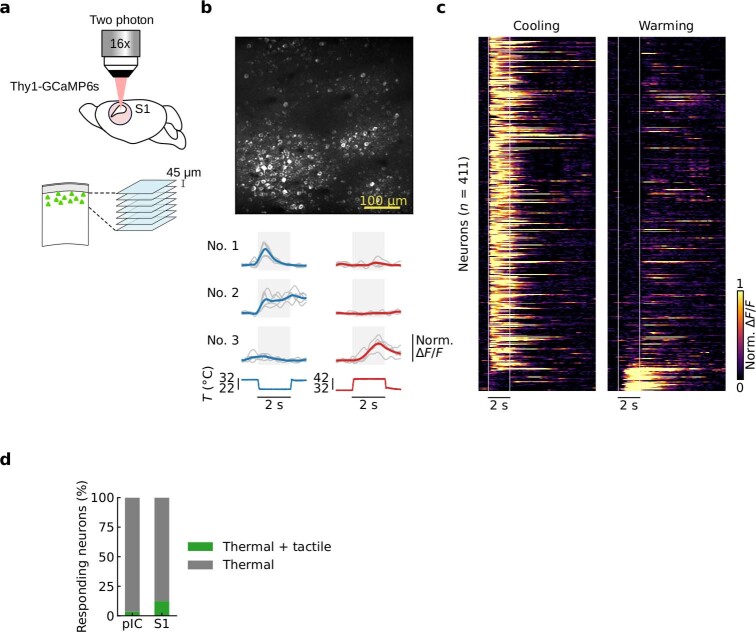
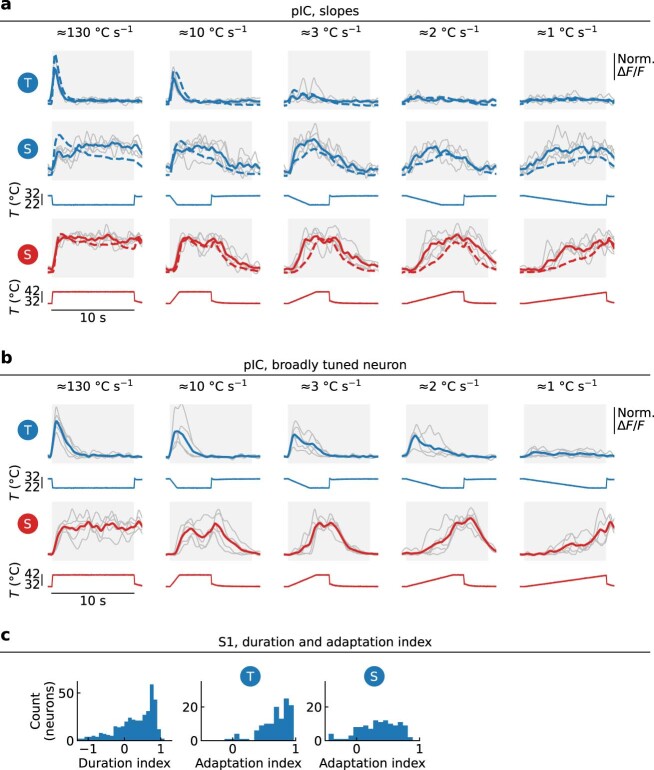
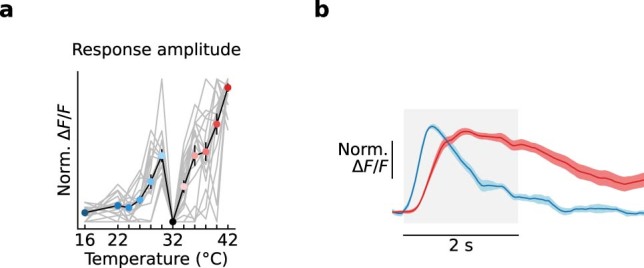
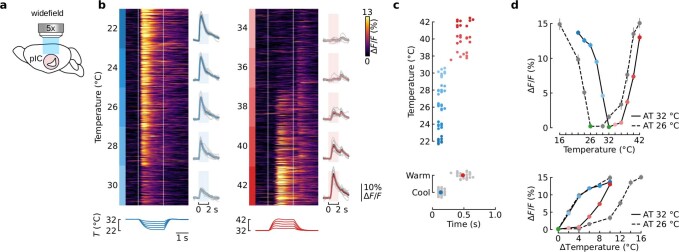
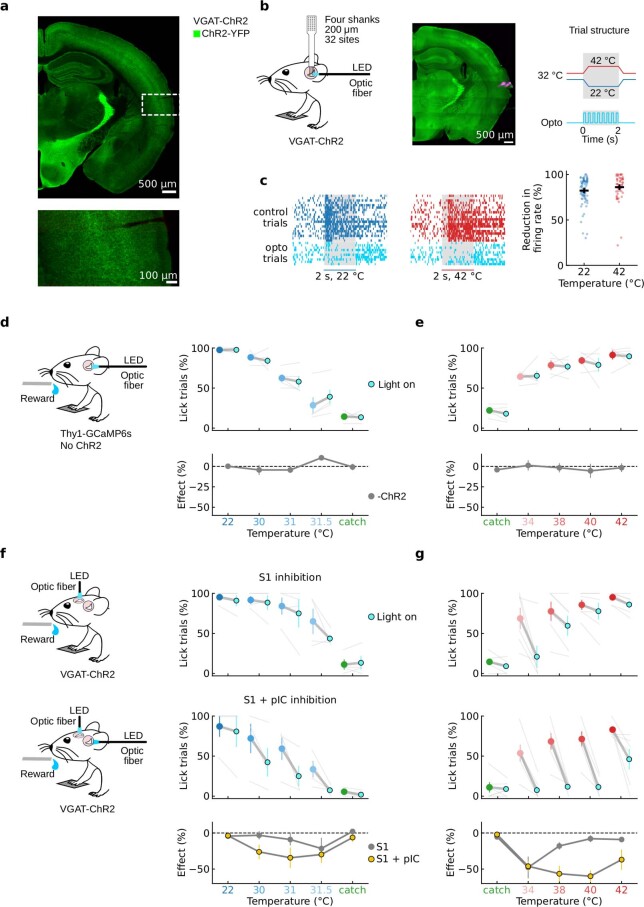
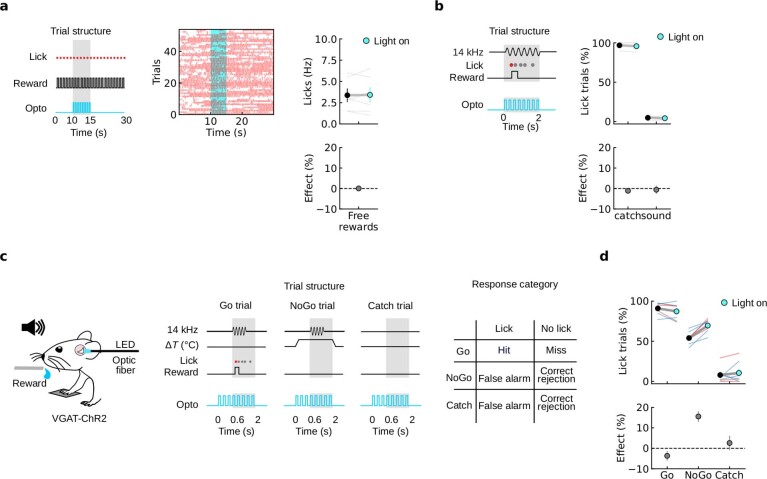
Temperature is a fundamental sensory modality separate from touch, with dedicated receptor channels and primary afferent neurons for cool and warm1-3. Unlike for other modalities, however, the cortical encoding of temperature remains unknown, with very few cortical neurons reported that respond to non-painful temperature, and the presence of a 'thermal cortex' is debated4-8. Here, using widefield and two-photon calcium imaging in the mouse forepaw system, we identify cortical neurons that respond to cooling and/or warming with distinct spatial and temporal response properties. We observed a representation of cool, but not warm, in the primary somatosensory cortex, but cool and warm in the posterior insular cortex (pIC). The representation of thermal information in pIC is robust and somatotopically arranged, and reversible manipulations show a profound impact on thermal perception. Despite being positioned along the same one-dimensional sensory axis, the encoding of cool and that of warm are distinct, both in highly and broadly tuned neurons. Together, our results show that pIC contains the primary cortical representation of skin temperature and may help explain how the thermal system generates sensations of cool and warm.


Conflict of interest statement

The authors declare no competing interests.

Figures

Fig. 1
Fig. 1. Cortical representation of cool and warm.
a, Schematic showing segregated (top) and integrated (bottom) models of cortical thermal encoding. T, temperature. b, Mouse brain showing candidate locations of thermal cortex in primary somatosensory cortex (S1) or pIC. c, Schematic of an awake Thy1-GCaMP6s mouse with right forepaw on a Peltier element during widefield calcium imaging; inset shows temporal dynamics of warming stimulus. d, From left to right: schematic of glass window on S1 (pink circle); in vivo image of cortical surface; averaged widefield response to 10 °C cooling (32–22 °C) or warming (32–42 °C) of the forepaw in an example mouse; grand average across mice (n = 348 cool and 346 warm trials, 12 mice). M, medial; A, anterior; L, lateral; P, posterior. Scale bar, 500 μm. e, Same as d, but for mice with glass window implanted over pIC (n = 360 cool and 352 warm trials, 14 mice). RV, rhinal vein; D, dorsal; V, ventral. Scale bar, 500 μm. f, From left to right: schematic illustrating injection site into S1 during widefield imaging through a clear skull preparation with simultaneous imaging of S1 and pIC (pink shows field of view); bar graphs show difference in response amplitude following muscimol versus Ringer’s injection. Bars indicate mean and grey filled circles indicate individual mice (n = 4). An asterisk indicates significant difference in S1 response following muscimol versus Ringer’s injection (P < 0.05, two-sided paired t-test, see Methods for exact values). g, Same as f but showing a reduction in pIC response to thermal stimuli after pIC inactivation and no change in the S1 response (n = 4 mice). h, Somatotopic map of response locations to thermal (10 °C cool and warm), tactile (100 Hz) and acoustic (8 kHz) stimulation. Coloured area indicates peak population response averaged across mice (see Methods, n = 14 mice thermal forepaw, 7 thermal hindpaw, 9 thermal face, 9 touch forepaw, 6 touch hindpaw, 13 sound). Data from individual mice are aligned to peak activity of the thermal forepaw response. IAF, insular auditory field; AC, auditory cortex. Scale bar, 500 μm. i, Widefield responses to thermal stimulation of different body parts from the same dataset as in h. Grey lines show mean responses from individual mice (n is same as in h), coloured lines show population mean, and grey area indicates time from start of stimulus to end of plateau phase. j, Grey filled circles show response latencies from individual mice (n is same as in h, see Methods); coloured filled circles show mean ± s.e.m. Source data
Fig. 2
Fig. 2. Heterogeneous arrangement of thermally tuned neurons in the pIC.
a, Schematic showing tuned (left) versus broadly tuned (right) cortical neurons. Blue indicates cool; red indicates warm. b, Schematic showing two-photon calcium imaging of pIC. Imaging started at 100 μm from the pial surface of a Thy1-GCaMP6s mouse; 7 optical sections were acquired with intervals of 45 μm. Norm., normalized. c, Top, example in vivo two-photon image from pIC. Scale bar, 100 μm. Bottom, example responses of single pIC neurons during 10 °C cooling (blue) or 10 °C warming (red) stimuli from an AT of 32 °C (n = 5 trials each). Here, and for all two-photon data figures, grey lines show single-trial responses, coloured lines show average, and background grey box indicates time from start of stimulus to end of plateau phase. Below, corresponding stimulus traces. d, Single-cell pIC calcium responses to cooling (left) and warming (right) stimuli. Each line represents a single neuron; responses are normalized to the peak and sorted on the basis of the thermal bias index with vertical white lines showing the onset and the end of the plateau phase of thermal stimuli (n = 746 neurons, 7 mice, 16 sessions). e, Histograms showing the distribution of thermal bias for all responsive cells in pIC (left; n is same as in d) and S1 (right; n = 411 neurons, 4 mice, 9 sessions). f, Spatial map of neurons colour coded with their thermal bias for the representative mouse shown in c. Scale bar, 100 μm. g, No significant difference in the distance between pairs of neurons with similar bias (cold to cold (c–c) or warm to warm (w–w)) and distance between pairs of neurons with opposite bias (cold to warm (c–w)) indicates no thermotopy for strongly biased neurons (n is same as in d) (difference of medians confidence interval (−2 µm, 5 µm), 95%, bootstrapped). Box plots show median and interquartile range. Whiskers show minimum and maximum values. Source data
Fig. 3
Fig. 3. Distinct temporal dynamics of cool and warm encoding.
a, Schematic showing transition from cool- and warm-selective skin spots to tuned and broadly tuned pIC neurons. Blue indicates cool; red indicates warm. b, Grand average responses (mean ± s.e.m.) to 10 °C cooling and warming responses from AT of 32 °C (n = 470 cool neurons (blue line), 401 warm neurons (red line) (see Methods); these neurons are also used in cf). c, Histograms of the response latency for 10 °C cooling (top) and 10 °C warming (bottom), in (left to right) tuned neurons (n is as in b), broadly tuned neurons (n = 125 neurons) and S1 neurons (n = 387 cool neurons, 25 warm neurons; grey bars show comparison to tuned warm latency histogram in pIC). Vertical line represents the median. d, Three different example neurons (average of 5 trials) with transient (T) or sustained (S) responses to 10 °C cooling (top) or warming (bottom); histograms of duration index for cooling and warming stimuli. Arrowheads indicate the duration index of example neurons. e, Duration index of cool (top) and warm (bottom) responses plotted against the response latency. Green dashed line at duration index 0.5 highlights the separation between T and S neurons. f, Duration index of warm versus cool in broadly tuned neurons (n is as in c broadly tuned). g, Left: example traces of cool (T and S) and warm (S) neurons responding to ≈10-s stimulus at fast onset speed (left, about 130 °C s−1) or at slower rate (right, about 1 °C s−1) (n = 5 trials). Below, corresponding stimulus traces. Right: histograms of adaptation index for T and S neurons separated accordingly to 0.5 duration index as in e (n = 241 cool transient neurons, 147 cool sustained neurons, 98 warm sustained neurons, 6 mice, 11 sessions). Arrowheads indicate example neurons. h, Schematic model of how different channels of afferent input could drive cortical dynamics. Source data
Fig. 4
Fig. 4. Relative versus absolute encoding of cooling and warming.
a, Schematic showing three possible cortical thermal coding schemes. Line colours indicate neuronal activity in response to cooling (blue) and warming (red). b, Schematic of stimulus protocol from AT of 32 °C. c, Left: traces of example pIC neurons responding to cooling and warming from AT 32 °C; grey lines show individual trials (5 trials per temperature), and coloured lines show mean response. Right: peak response amplitude plotted as a function of the thermal stimulus for the example neurons on the left. d, Summary of response amplitude plotted as a function of the thermal stimulus for entire population of neurons (n = 746 neurons, 16 sessions, 7 mice). Coloured filled circles (pIC) and grey filled circles (S1) show mean ± s.e.m. at AT 32 °C. e, Same data as in d, but showing the proportion of recruited pIC neurons (>20% of response amplitude). f, Same data as in d, but showing the proportion of pIC neurons reaching maximum response (>80% of response amplitude). g, Schematic of stimulus protocols used to test impact of AT on thermal encoding. h, Graphs as in d, but for pIC neurons at all ATs studied (AT 32 °C, n is same as d; AT 26 °C, n = 401 neurons, 9 sessions, 5 mice; AT 22 °C, n = 448 neurons, 10 sessions, 6 mice). i, Same data as h, but plotted against change in stimulus amplitude. Source data
Fig. 5
Fig. 5. Thermal perception is mediated by pIC.
a, Left: schematic of thermal detection task and placement of optic fibre. LED, light-emitting diode. Middle: example trial structure showing timing of reward window (grey) and the timing of the optical stimulus during trials with optogenetic (opto.) manipulation (blue). Filled circles show licks; first rewarded lick is coloured. Right: response categories of task. stim., stimulation. b, Left: raster plot of licks in all trials (n = 300) from an example mouse trained for cooling sorted by stimulus amplitude; green filled circles show false alarms. Right: summary of behavioural performance showing proportion of trials with at least one lick in reward window (n = 5 mice). Grey lines show individual mice; coloured filled circles show mean ± s.e.m. c, Same as in b, but for warming (raster n = 239 trials, graph n = 6 mice). d, Top: latency of first lick is longer in response to warming than to cooling at different amplitudes. Filled circles show data from individual mice in b,c. Bottom: data from all amplitudes, with filled coloured circles showing mean ± s.e.m. e, Top left: proportion of trials with licks in VGAT-ChR2 mice (n = 5 mice) during optical stimulation (cyan) trials versus without optical stimulation (blue) for different cool stimulus amplitudes. Thin grey lines show individual mice; coloured filled circles joined by thick grey lines show mean ± s.e.m. Bottom left: the effect of light stimulus (change in percentage of trials with licks, mean ± s.e.m.) in VGAT-ChR2 mice (yellow), and in mice not expressing ChR2 (grey, see Extended Data Fig. 7). Right, same as at left, but for warm stimulation (n = 6 mice). Source data
Extended Data Fig. 1
Extended Data Fig. 1. Functional and histological localization of pIC.
a, Functional and histological localization of the thermal zone of forepaw pIC in 2 example mice. Left, in vivo image of cortical surface of a Thy1-GCaMP6s mouse with superimposed, coloured areas showing the widefield responses to cool (blue, 32-22 °C) and sound (green, 8 kHz). Glass pipette painted with Dil (5 mg/ml) was inserted in the center of the cool response area (black cross). Right, cytochrome oxidase staining of a flattened cortex preparation from the same mouse on left with site of Dil injection (magenta). Areal borders were manually delineated based on CO intensity reaction, parcellation followed. b, Second example mouse as in a. c, Left, in vivo image of cortical surface of a Thy1-GCaMP6s mouse with superimposed, coloured areas showing the widefield responses to cool (blue, 32-22 °C) and sound (green, 8 kHz). Center, coronal section of the same mouse on the left containing the site of Dil injection (magenta). GCaMP6s signal was amplified with immunohistochemistry with anti-GFP antibody. Right, zoom of the injection site. Example mouse is the same presented in Fig. 2c. Similar results were found in other two mice. d, Top, example of epifluorescence image of pIC from a Thy1-GCaMP6s mouse stained for GCaMP6s (labelled with anti-GFP antibody) and for the general neuronal marker NeuN. Bottom, cell density of NeuN- and GCaMP-positive neurons. Right, quantification of the percentage of NeuN-positive neurons that also expressing GCaMP6s in the imaged section across layers (total) and in the imaging layer (2p, 100–370 µm) (n = 3 mice, mean). Values are in line with previous data. Filled circles show data from different mice. e, Same as d, but with staining for GCaMP6s and with antibody for GABAergic neurons (GAD67). Right, percentage of GAD67-positive neurons among GCaMP6s-expressing neurons (n = 4 mice, mean). Values are in line with previous data. f, Cartoon schematic representing the position of the acoustic and forepaw cool responsive fields relative to major blood vessels. IAF, insular auditory field; AC, auditory cortex. Different terminology has been used for this region in previous studies, including pIC, parietal ventral area (PV) or S2/IC, highlighting the difficulties in discerning two neighboring cortical regions. In agreement with studies that have used functional mapping of sensory responses,,,, and because pIC is a region associated with thermal processing in human studies,,,,, here we use the term pIC. Source data
Extended Data Fig. 2
Extended Data Fig. 2. Somatotopic representation of temperature in S1.
a, Cartoon schematic showing the location of the forepaw cool responsive area (blue) relative to the major blood vessels. b, From left to right, cartoon schematic showing imaging setup; somatotopic map of responses locations to thermal (10 °C cool) and tactile. Coloured area indicates peak population response averaged across mice (see methods, n = 12 thermal forepaw, 5 thermal hindpaw, 4 thermal face, 12 touch forepaw, 5 touch hindpaw). Data from individual mice are aligned to peak activity of the thermal forepaw response. c, Widefield responses to thermal stimulation of different body parts from the same dataset as in b. Grey lines show mean responses from individual mice (n = same as b), coloured lines show population mean, grey area indicates time from start of stimulus to end of plateau phase. d, Grey filled circles show response latencies from individual mice, coloured filled circles show mean ± s.e.m., same data as in c. Source data
Extended Data Fig. 3
Extended Data Fig. 3. Cellular encoding of temperature in S1.
a, Cartoon schematic showing two-photon imaging of S1. Imaging started at 100 μm from the pial surface of a Thy1-GCaMP6s mouse, 7 optical sections were acquired with intervals of 45 μm. b, Top, example in vivo two photon image of GCaMP6 expressing neurons in S1. Bottom, responses of three example S1 neurons during 10 °C cooling (blue) or 10 °C warming (red) stimuli. Here and in all figures, grey lines show single trial responses, coloured lines show average, grey shaded box indicates time from start of stimulus to end of plateau phase. Below, corresponding thermal stimulus traces. c, Single neuron S1 calcium responses to cooling (left) and warming (right) stimuli. Each line represents a single neuron, responses are normalized to the peak and sorted based on the thermal bias index with white lines showing the onset and the end of the plateau phase of thermal stimuli (n = 411 neurons, 4 mice, 9 sessions). d, Bar graph showing the percentage of pIC and S1 neurons responding to thermal only and also to tactile stimulation (pIC, 506 neurons thermal only, 18 neurons thermal and tactile; S1, 345 neurons thermal only, 49 neurons thermal and tactile). The overall number and proportion of thermal and tactile neurons in S1 presented here differs from a previous report. This might depend on the body part studied, stimulus design and recording conditions. Source data
Extended Data Fig. 4
Extended Data Fig. 4. Dynamics of thermal responses to thermal stimuli with different stimulus onset speeds.
a, Responses of example transient and sustained cool (T and S) and sustained warm (S) neurons responding to stimuli with different onset speeds of approximately 130, 10, 3, 2, 1 °Cs−1. Example neurons are the same as presented in main Fig. 3g. Grey lines show individual trials, coloured lines show mean response. Dashed lines show mean response of the corresponding neuronal population. b, Responses of example pIC broadly tuned neuron responding to the same stimuli used in a. c, Duration and adaptation index for cool neurons in S1 (n = 122 cool transient neurons, 118 cool sustained neurons, 3 mice, 7 sessions). Source data
Extended Data Fig. 5
Extended Data Fig. 5. Thermometer neurons.
a, Two-photon calcium imaging response amplitude plotted as a function of the thermal stimulus for neurons with similar response profile to neuron #5 of Fig. 4c (n = 16 thermometer neurons from 411 warm neurons in Fig. 4; ~5%). Grey lines show data for individual neurons, coloured filled circles show mean ± s.e.m. at AT 32 °C. Most thermometer neurons are characterized by low threshold response to warming stimuli and had cool responses only for small amplitude cooling stimuli. b, Grand average responses (mean ± s.e.m.) of thermometer neurons to 2 °C cooling (32-30 °C, blue) or 10 °C warming (32–42 °C, red) from AT 32 °C. Thermometer neurons conserve the latency difference as seen for cool and warm responses in tightly tuned and broadly tuned neurons (Fig. 3b, c). The latency of thermal responses in these neurons indicate that they receive the same input as the tightly tuned and broadly tuned neurons. These neurons highlight complex thermal features possibly constructed by the pIC. One hypothesis is that the lack of responses to large cooling stimuli could be explain by disynaptic, feedback, inhibition driven by a secondary cool channel activated by high amplitude cooling stimuli (eg. 32-24 °C). Source data
Extended Data Fig. 6
Extended Data Fig. 6. Widefield imaging analysis of thermal amplitude encoding in pIC.
a, Left, schematic of widefield calcium imaging in a mouse implanted with a cranial window over pIC. b, Widefield responses of pIC to forepaw thermal stimulation with different amplitudes (n = 123–128 trials per temperature, 10 mice). Heat maps showing widefield responses to thermal stimuli with each line representing a single trial response and thermal stimuli below with white lines showing the onset and the end of the plateau phase of thermal stimuli; coloured lines to the right of heatmap show mean ± s.e.m. across trials from all mice and grey lines show mean response from individual mice; coloured shaded boxes indicate start of thermal stimulus and end of plateau phase. Right, same as left panels but for warm responses. c, Top, response latencies to different amplitudes of thermal stimuli from individual mice. Bottom, grey filled circles show data from all amplitudes (n = 10 mice). Filled circles show mean ± s.e.m. d, Top, peak population response to different amplitude stimuli from experiments presented in b. Coloured filled circles with connecting lines show data with AT of 32 °C. Grey filled circles with connecting dashed lines show data using AT of 26 °C (filled circles show mean ± s.e.m) (n = 6 mice). Green filled circles shows activity at AT. Bottom, same data as in top graph but showing population response amplitude plotted against thermal stimulus amplitude. Graph shows shift in warm response amplitude but not for cool when presented with a lower AT. Source data
Extended Data Fig. 7
Extended Data Fig. 7. Electrophysiological validation of optogenetic inhibition and behavioural controls on S1 optogenetic silencing.
a, Example coronal slices from VGAT-ChR2 mice co-labelled with anti-GFP antibody showing homogeneous expression across pIC. Similar results were found in two other mice. b, Left, schematic showing an awake VGAT-ChR2 mouse with right forepaw on a Peltier element during electrophysiological recording and optogenetic manipulation of left pIC. Center, example coronal section of a VGAT-ChR2 mouse showing 2 tracks of the 4 shanks electrode in magenta. Similar results were found in another mouse. Right, trial structure showing the timing of the optical stimulation stimulus relative to the thermal stimulus. c, Left, raster plot of example unit responses to 20 trials of cool (blue) or warm (red) stimulation and during thermal stimulation during optogenetic silencing of pIC (10 trials, cyan). Grey background box indicates timing of stimulus presentation for cool (blue) and warm (red). Pulsed LED on for the entire duration of the thermal stimulus. Thermal stimuli presentation was randomized. Trials with pIC optogenetic inhibition were also randomized, but are separated here for clarity. Right, shows graph of percentage reduction in firing rate of excitatory units during optogenetic stimulus trials in 4 mice, blue filed circles show 79 cold units and red shows 53 warm unit, black bars show mean ± s.e.m. d, Optical stimulation of the thermal zone of pIC in mice that do not express ChR2 (Thy1-GCaMP6s) does not affect cool perception. Behavioural task was identical to that presented in Fig. 5. Top graph shows number of trials with a lick during optical stimulation (cyan) vs. without optical stimulation (blue or red) at different thermal stimulus amplitudes, green shows catch trials. Grey thin lines show individual mice (n = 5), coloured filled circles connected by thick grey thick lines shows mean ± s.e.m. Lower panel shows the effect of light stimulus as the change in percentage of trials with licks, (mean ± s.e.m) corresponding to the stimulus amplitude above. e, same as in d but for warm. f, Top, proportion of trials with licks in VGAT-ChR2 mice (n = 4) during optical stimulation of S1 (cyan) vs. trials without optical stimulation (blue or red) for different cool stimulus amplitudes green shows catch trials. Grey lines show individual mice, coloured filled circles connected by thick grey lines show mean ± s.e.m. Middle, same as top but for simultaneous optogenetic inhibition of S1 and pIC. Bottom, shows the effect of light stimulus (change in percentage of trials with licks, mean ± s.e.m.) from mice with optogenetic inhibition of S1 alone (yellow filled circles) or from mice with optogenetic inhibition of both S1 and pIC simultaneously. g, Same as e, but for warm stimulation (n = 6 mice). S1 inactivation caused a smaller effect on cool perception in comparison to our previous report, however here we used a small diameter optical fiber for transient optogenetic inhibition, as compared to prior pharmacological inhibition. Source data
Extended Data Fig. 8
Extended Data Fig. 8. Behavioural control experiments.
a, Optogenetic inhibition of pIC using the VGAT-ChR2 mice does not affect spontaneous licking behaviour. Left, trial structure showing optical stimulation during free licking (grey bar). Middle, example raster plot of free licking rates in a VGAT-ChR2 mouse during optical stimulation. Right, mean lick rates in VGAT-ChR2 mice during optical stimulation Off (black; 2 s before light stimulus) vs. On (cyan; 2 s beginning of light stimulus) trials. Grey thin lines show individual mice (n = 6), coloured filled circles connected by thick grey lines show mean ± s.e.m . b, Auditory perception is not altered by optogenetic inhibition of pIC. Perception task design is same as thermal task but uses an acoustic stimulus (14 kHz, 65 dB SPL). Left, structure of optical stimulation trial. Right, mean lick rates in VGAT-ChR2 mice during trials with optical stimulation during the auditory stimuli (cyan) vs. trials without optical stimulation (black). Grey thin lines show individual mice (n = 4), coloured filled circles connected by thick grey thick lines shows mean ± s.e.m. c, Left, schematic of discrimination task and placement of the optic fiber. Middle, example trial structure showing timing of reward window (grey) and the timing of an optical stimulus during trials with optogenetic manipulation. Filled circles show licks, first lick coloured to show rewarded lick. VGAT-ChR2 mice were trained to discriminate a 14 kHz acoustic stimulus (Go trial) from the same stimulus presented 0.6 s after the beginning of a 2 s thermal stimulus (cooling or warming) (NoGo trial). Right, response categories of the task. Go trials were rewarded, NoGo and catch trials (no stimuli) were not rewarded. Training continued until Go trial hit rate > 70%, NoGo false alarm rate ~50% and false alarm rate < 30%. A criterion of ~50% for the NoGo false alarm rate was chosen to be able to observe an increase or decrease in lick rates during optogenetic inhibition. The amplitude of the thermal stimuli (cooling or warming) was adjusted from mouse to mouse to obtain this criterion. d, Top, proportion of trials with licks in VGAT-ChR2 mice during optical stimulation (cyan) trials vs. without optical stimulation (black). Blue and red lines show data from individual mice trained with either cooling (blue, n = 4) or warming (red, n = 3) stimuli. Coloured filled circles joined by grey thick lines show mean ± s.e.m. Bottom, shows the effect of light stimulus (change in percentage of trials with licks, mean ± s.e.m.). The increase, rather than decrease, in NoGo false alarm rate during optogenetic manipulation confirms the direct and selective involvement of pIC in thermosensory processing. Source data

References

    1. Blix M. Experimentela bidrag till lösning af frågan om hudnervernas specifika energi. Upsala Läkarefören. Förhandlin. 1882;18:87–102.
    1. Filingeri, D. in Comprehensive Physiology (ed. Terjung, R.) 1429–1491 (Wiley, 2016). - PubMed
    1. Vriens J, Nilius B, Voets T. Peripheral thermosensation in mammals. Nat. Rev. Neurosci. 2014;15:573–589. doi: 10.1038/nrn3784. - DOI - PubMed
    1. Bokiniec P, Zampieri N, Lewin GR, Poulet JFA. The neural circuits of thermal perception. Curr. Opin. Neurobiol. 2018;52:98–106. doi: 10.1016/j.conb.2018.04.006. - DOI - PMC - PubMed
    1. Craig AD, Chen K, Bandy D, Reiman EM. Thermosensory activation of insular cortex. Nat. Neurosci. 2000;3:184–190. doi: 10.1038/72131. - DOI - PubMed

Publication types

LinkOut - more resources