. 2023 Feb;614(7948):492-499.
doi: 10.1038/s41586-022-05684-z. Epub 2023 Feb 8.

Polygenic architecture of rare coding variation across 394,783 exomes

Affiliations

Polygenic architecture of rare coding variation across 394,783 exomes

Daniel J Weiner et al. Nature. 2023 Feb.

Abstract

Both common and rare genetic variants influence complex traits and common diseases. Genome-wide association studies have identified thousands of common-variant associations, and more recently, large-scale exome sequencing studies have identified rare-variant associations in hundreds of genes1-3. However, rare-variant genetic architecture is not well characterized, and the relationship between common-variant and rare-variant architecture is unclear4. Here we quantify the heritability explained by the gene-wise burden of rare coding variants across 22 common traits and diseases in 394,783 UK Biobank exomes5. Rare coding variants (allele frequency < 1 × 10⁻³) explain 1.3% (s.e. = 0.03%) of phenotypic variance on average-much less than common variants-and most burden heritability is explained by ultrarare loss-of-function variants (allele frequency < 1 × 10⁻⁵). Common and rare variants implicate the same cell types, with similar enrichments, and they have pleiotropic effects on the same pairs of traits, with similar genetic correlations. They partially colocalize at individual genes and loci, but not to the same extent: burden heritability is strongly concentrated in significant genes, while common-variant heritability is more polygenic, and burden heritability is also more strongly concentrated in constrained genes. Finally, we find that burden heritability for schizophrenia and bipolar disorder6,7 is approximately 2%. Our results indicate that rare coding variants will implicate a tractable number of large-effect genes, that common and rare associations are mechanistically convergent, and that rare coding variants will contribute only modestly to missing heritability and population risk stratification.


Figures

Extended Data Figure 1:
Extended Data Figure 1:. Performance of BHR in exome-scale simulations with no individual-level data
We performed an extended set of simulations to assess the performance of BHR. The MAF groups are < 1e-5 (group 1), 1e-5 - 1e-4 (group 2), 1e-4 - 1e-3 (group 3), and 1e-3 - 1e-4 (group 4), respectively; the gray and red boxplots indicate the distribution of estimates in null and non-null simulations (true burden h2 = 0%, 0.5% respectively). A minor difference in the way that BHR was applied to simulated vs. real data is that in simulated data, significant genes were identified without any attempt to correct for population stratification, whereas in our real-trait analyses, they were identified using SAIGE-GENE. We started with a realistic set of parameters (see Methods) and varied one simulation parameter in each simulation. (A) We increased the sample size from 5e5 to 2e6. This increase amplifies the uncorrected population stratification, causing false positive significant genes and upward bias in BHR (no bias is observed in estimates without significant genes). (B) We added overdispersion effects with the same distribution of effect sizes as the burden effects, i.e. with per-allele effect size variance drawn from a discrete mixture distribution (see Methods). This distribution differs from the BHR model, which assumes that overdispersion effects have a constant per-s.d. effect size variance, but this form of misspecification does not lead to bias. (C) We performed simulations with realistic parameters, including stratification and selection (see Methods and Figure 1C). (D) We decreased the sample size from 5e5 to 1e5. (E) We increased the strength of population stratification (including the minor-allele biased stratification) by a factor of 10, from a per-s.d. effect size mean of 1e-7 and a variance of 1e-5 to a mean of 1e-6 and a variance of 1e-4. (F) We increased the strength of selection, from mean Ns=1 to mean Ns=10. There were extremely few variants with allele frequency greater than 1e-3, so MAF group 4 estimates are not shown. Numerical results are contained in Supplementary Table 4. Boxplots denote median, quartiles and range of distribution (excepting outliers).
Extended Data Figure 2:
Extended Data Figure 2:. Comparison of BHR and GCTA in null simulations with individual-level genotypes and phenotypes, and different patterns of population stratification
There are four demographic models: no stratification; north-south stratification; north-south stratification with smaller population size in the northern deme; and local stratification with very small population size in one deme (see Methods). Under each model, we performed simulations with and without selection, mimicking pLoF and synonymous variants respectively. (a) BHR burden heritability estimates with no correction for minor allele-biased stratification. (b) GCTA heritability estimates with no correction for ancestry. (c) BHR burden heritability estimates, correcting for minor allele-biased stratification. (d) GCTA heritability estimates, correcting for ancestry by providing the deme from which each individual was sampled as a covariate. Boxplots denote median, quartiles and range of distribution (excluding outliers).
Extended Data Figure 3:
Extended Data Figure 3:. Genome-wide mean minor allele effect sizes
We define the “mean effect” as the effect size of the genome-wide burden, summing all minor alleles across genes within a category, on the phenotype. For synonymous variants, a nonzero mean effect is interpreted as evidence of minor-allele biased population stratification, and this type of stratification produces upward bias in BHR heritability estimates (see Methods). (a-c) Mean effect of synonymous variants vs. mean effect of missense benign, missense other, and pLoF variants respectively. The lack of correlation in (c) suggests that for pLoFs, the nonzero mean effect is mostly biological. (d) Mean effect of synonymous variants vs. the resulting bias in heritability estimates, for synonymous variants (left y axis) or for pLoFs (right y axis). These differ by a constant factor due to the larger number of synonymous variants than pLoFs. (e) Mean effect of pLoF variants vs. the contribution of these effects to burden heritability. These estimates are a small fraction of the total pLoF burden heritability. Error bars represent standard errors, which are computed by assuming independence across genes.
Extended Data Figure 4:
Extended Data Figure 4:. Burden heritability estimates with effect-allele-permuted burden statistics
We assessed the potential for confounding in our results by repeating our analyses with ultra-rare pLoF burden statistics whose effect alleles were randomly permuted. This permutation is expected to eliminate the burden heritability while not affecting any form of confounding that is symmetrical with respect to the minor vs. major allele. Boxplots indicate the distribution of burden heritability estimates before and after the permutation (non-null and null, respectively), with median, quartiles and range (excepting outliers).
Extended Data Figure 5:
Extended Data Figure 5:. Proportion of common variant heritability explained by LD-independent blocks with significant heritability
For each trait, we used HESS to identify which of the 1651 LD-independent blocks from Berisa have Bonferroni-significant heritability, and then computed the proportion of the overall HESS heritability mediated by each block. Although these blocks aggregate over many variants in many genes, the proportion of heritability explained by individual significant blocks is still less than the proportion of burden heritability explained by individual significant genes in BHR (Extended Data Figure 4).
Extended Data Figure 6:
Extended Data Figure 6:. Comparison of burden versus common variant heritability explained by exome-wide significant genes
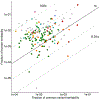
Each point represents a trait-gene significant burden association from the Genebass dataset. X axis values are the fraction of common variant heritability (estimated with HESS) explained by the LD-independent block containing that gene. Y axis values are the fraction of burden heritability (estimated with BHR) explained by the significant gene.
Extended Data Figure 7:
Extended Data Figure 7:. Absolute mean minor allele effect size of ultra-rare pLoF variants genome wide, vs. the constrained gene enrichment of each trait
(+) and (−) denote the sign of the mean minor allele effects. For numerical results, see Supplementary Tables 7, 16, and 17.
Extended Data Figure 8:
Extended Data Figure 8:. Genetic correlation estimates across 37 traits, for common variants (upper triangle) and rare coding variants (lower)
Asterisks indicate nominally significant genetic correlation estimates (two-tailed p < 0.05). Gray boxes not on the diagonal indicate cross-trait LDSC point estimates that are outside of [−1.25, 1.25], which cross-trait LDSC does not report by default. For numerical results, see Supplementary Table 19.
Extended Data Figure 9:
Extended Data Figure 9:. Comparison of common coding vs. common whole-genome genetic correlations
(a) We evaluated whether common coding variants, similar to rare coding variants, have stronger genetic correlations than common variants overall. The fit line indicates the Deming regression slope, which allows for uncertainty in both the X and Y axis values. (b-c) To assess the stability of the Deming regression slope, we separately analyzed chromosomes 1-8 and chromosomes 9-22. (d-e) We also assessed the stability of the Deming regression slope for the burden genetic correlation vs. the common-variant genetic correlation on chromosomes 1-8 and chromosomes 9-22.
Extended Data Figure 10:
Extended Data Figure 10:. Burden heritability enrichments of drug target gene sets
We used BHR to estimate the ultra-rare loss-of-function burden heritability enrichment in sets of manually curated drug target genes from a previous publication. For all panels, error bars are standard errors, and bars are shaded in blue if the enrichment is significantly greater than 1. (A) Burden heritability enrichment in n = 14 blood pressure drug target genes (union of diastolic and systolic blood pressure gene sets from reference publication). (B) Burden heritability enrichment in n = 8 bone mineral density drug target genes. (C) Burden heritability enrichment in n = 6 calcium drug target genes. (D) Burden heritability enrichment in n = 10 lipid drug target genes (union of LDL and triglyceride gene sets from reference publication). (E) Burden heritability enrichment in n = 6 red blood cell drug target genes. (F) Burden heritability enrichment in n = 7 type 2 diabetes drug target genes.
Figure 1:
Figure 1:. Overview of Burden Heritability Regression (BHR)
(A) The burden heritability of a gene is determined by its mean minor-allele effect size (dashed lines) and its “burden score,” which is approximately the combined allele frequency. (B) BHR regresses gene burden statistics on gene burden scores, and the burden heritability estimate is proportional to the regression slope. We plot the mean burden statistic within burden score bins for ultra-rare pLoF/synonymous variants and LDL cholesterol levels (Supplementary Tables 1-2). (C) Performance of BHR in simulations. We started with approximately realistic simulations and varied the sample size, the allele frequency of the variants, and the strength of negative selection. The boxplots are the distribution of BHR h2 estimates across 100 simulation runs, denoting median, quartiles, and range (excepting outliers)
Figure 2:
Figure 2:. Burden heritability of 22 complex traits and common diseases in UK Biobank
(A) Proportions of coding variants by allele frequency and functional consequence in Genebass. Missense variants are categorized as either “benign” or as “possibly damaging/probably damaging” using PolyPhen2. Ultra-rare is defined as AF < 1e-5. Rare is defined as 1e-5 ≤ AF < 1e-3. Common is defined as AF > 0.05. (B) Estimates of burden heritability across frequency bins and functional categories. Boxplots show the distribution of heritability estimates across 22 complex traits and common diseases, denoting median, quartiles and range (excepting outliers). Numerical results are contained in Supplementary Table 7. (C) Comparison of the total burden heritability (ultra-rare + rare) with the common-variant heritability of each trait (estimated using LDSC). Error bars are standard errors. Numerical results for each trait are contained in Supplementary Tables 8 and 10. (D) Comparison of test statistic inflation between ultra-rare pLoF (red) and synonymous variants (gray) across the 22 traits. Lambda GC is the median burden χ2 statistic divided by 0.454.
Figure 3:
Figure 3:. Burden heritability explained by significant genes
(A) Fraction of burden heritability explained by exome-wide significant genes from Genebass. Each box represents the fraction of burden heritability explained by one significant gene. For numerical results, see Supplementary Table 12. (B) Fraction of common variant heritability explained by genome-wide significant loci. Each box represents the fraction of common variant heritability explained by one significant locus. For numerical results, see Supplementary Table 14. (C) The fraction of common variant heritability mediated by exome-wide significant genes, estimated using AMM, compared with the fraction of burden heritability explained by the same genes, for traits with at least 5 exome-wide significant genes. For numerical results, see Supplementary Tables 12 and 16. (D) Common- vs. rare-variant cancer heritability mediated by cancer genes. The blue bars are the BHR estimates, and the grey bars are the AMM estimates. For numerical results, see Supplementary Table 16-17. Error bars in A-D are standard errors.
Figure 4:
Figure 4:. Common- and rare-variant heritability enrichments
(A) Common and rare variant enrichments across cell type differentially expressed gene sets for selected trait-cell type pairs (see Supplementary Tables 16-17 for numerical results). Error bars are standard errors. (B) Common and rare variant enrichments in constrained genes in the bottom quintile of observed/expected pLoF alleles in gnomAD. Error bars are standard errors. (C) Common and rare variant enrichments for 22 traits across quintiles of constraint. Boxplots denote median, quartiles and range (excepting outliers).
Figure 5:
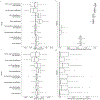
Figure 5:. Burden genetic correlations between variant classes and traits
(A) Burden genetic correlations between ultra-rare pLoF and damaging missense variants, across 9 traits that have nominally significant burden heritability for both. The dashed line indicates the mean correlation across all 22 traits, computed as a ratio of averages. Error bars denote standard errors. For numerical results, see Supplementary Table 18. (B) Clustered heatmap of genetic correlations estimated with BHR from ultra-rare pLoF variants (lower triangle) and genetic correlations estimated with LD Score Regression (upper triangle). * nominal significance (two-tailed p < 0.05). For numerical results, see Supplementary Table 19. (C) Comparison of common and burden genetic correlations across trait pairs. The dashed line indicates the least squares regression fit (slope = 1.6).
Figure 6:
Figure 6:. Burden heritability of schizophrenia and bipolar disorder
(A) Burden heritability of ultra-rare pLoF variants, ultra-rare missense variants with MPC > 2, and ultra-rare synonymous variants. Gray violin plots show the distribution of burden heritability estimates in 22 UK Biobank traits (Figure 2B). (B) Constrained gene enrichment of ultra-rare pLoF vs. common variant heritability. Error bars denote standard errors. For numerical results, see Supplementary Table 20.

Comment in

References

Main Text References

    1. Sun BB et al. Genetic associations of protein-coding variants in human disease. Nature 603, 95–102 (2022). - PMC - PubMed
    1. Wang Q et al. Rare variant contribution to human disease in 281,104 UK Biobank exomes. Nature 597, 527–532 (2021). - PMC - PubMed
    1. Backman JD et al. Exome sequencing and analysis of 454,787 UK Biobank participants. Nature 599, 628–634 (2021). - PMC - PubMed
    1. Claussnitzer M et al. A brief history of human disease genetics. Nature 577, 179–189 (2020). - PMC - PubMed
    1. Karczewski KJ et al. Systematic single-variant and gene-based association testing of thousands of phenotypes in 394,841 UK Biobank exomes. Cell Genomics 2, 100168 (2022). - PMC - PubMed

Methods References

    1. 1000 Genomes Project Consortium et al. A global reference for human genetic variation. Nature 526, 68–74 (2015). - PMC - PubMed
    1. Berisa T & Pickrell JK Approximately independent linkage disequilibrium blocks in human populations. Bioinformatics 32, 283–285 (2016). - PMC - PubMed
    1. Schoech AP et al. Quantification of frequency-dependent genetic architectures in 25 UK Biobank traits reveals action of negative selection. Nat. Commun 10, 790 (2019). - PMC - PubMed
    1. Zhou W et al. Scalable generalized linear mixed model for region-based association tests in large biobanks and cohorts. Nat. Genet 52, 634–639 (2020). - PMC - PubMed
    1. Grotzinger AD et al. Genomic structural equation modelling provides insights into the multivariate genetic architecture of complex traits. Nat. Hum. Behav 3, 513–525 (2019). - PMC - PubMed

Publication types