. 2023 Feb 8;13(1):2236.
doi: 10.1038/s41598-022-26294-9.

Using machine learning on clinical data to identify unexpected patterns in groups of COVID-19 patients

Affiliations

Using machine learning on clinical data to identify unexpected patterns in groups of COVID-19 patients

Hannah Paris Cowley et al. Sci Rep. .

Abstract

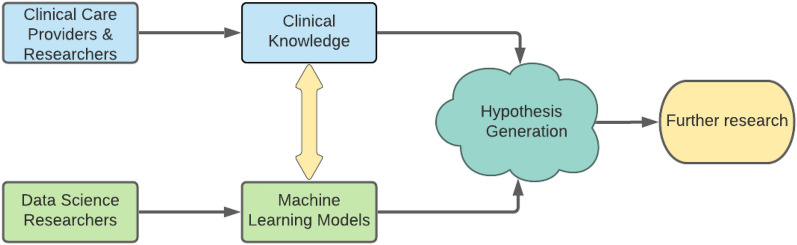
As clinicians are faced with a deluge of clinical data, data science can play an important role in highlighting key features driving patient outcomes, aiding in the development of new clinical hypotheses. Insight derived from machine learning can serve as a clinical support tool by connecting care providers with reliable results from big data analysis that identify previously undetected clinical patterns. In this work, we show an example of collaboration between clinicians and data scientists during the COVID-19 pandemic, identifying sub-groups of COVID-19 patients with unanticipated outcomes or who are high-risk for severe disease or death. We apply a random forest classifier model to predict adverse patient outcomes early in the disease course, and we connect our classification results to unsupervised clustering of patient features that may underpin patient risk. The paradigm for using data science for hypothesis generation and clinical decision support, as well as our triaged classification approach and unsupervised clustering methods to determine patient cohorts, are applicable to driving rapid hypothesis generation and iteration in a variety of clinical challenges, including future public health crises.


Conflict of interest statement

Dr. Garibaldi is a member of the FDA Pulmonary-Asthma Drug Advisory Committee and has received consulting fees from Janssen Research and Development, LLC, Gilead Sciences, Inc and Atea Pharmaceuticals, Inc. All other authors declare no competing interests.

Figures

Figure 1
Figure 1
Clinical knowledge and data science modeling work in tandem to drive hypothesis generation. In our approach, we combine machine learning methods with clinical knowledge to generate hypothesized patient sub-groups and factors that affect patient outcomes. The collaboration between clinical insight and machine learning modeling informs the generation of new hypotheses which may then be tested in further research. The yellow arrow indicates the critical interplay between clinical knowledge and machine learning modeling: clinical knowledge informs the construction of models and the results of models are checked against clinical knowledge.
Figure 2
Figure 2
Triaged Prediction Approach. The goal of the triaged prediction approach was to use the most minimal set of data possible to predict a given patient’s outcome and identify potential patient sub-groups based off of prediction patterns. At each epoch of analysis, a classifier was trained and predictions were made using 10-fold cross-validation. Subsequently, patients were classified as either having a mild, severe disease and/or death, or indeterminate 14-day outcome. Patients who achieved an outcome during the epoch were removed from further analysis. After prediction, Kullback-Leibler (KL) divergence was used to identify features that distinguished true positive from false negative predictions and the proportion of errors in each unsupervised cluster were calculated.
Figure 3
Figure 3
Unsupervised Clustering Approach. Clustering analysis was performed using the first epoch of triaged prediction data. The goal of this complementary model was to find sub-groups of patients at the time of hospital admission. Data were preprocessed using min-max scaling and UMAP embedding to two dimensions. Hierarchical clustering using Ward’s linkage was then applied to generate patient sub-groups. After clustering, the association of cluster membership with patient features and predictions from the triaged prediction model were analyzed towards the goal of further identifying patient sub-groups, hypothesis generation, and assessing the reliability of the triaged prediction approach per sub-group.
Figure 4
Figure 4
Feature differences among clusters. (a) Cluster-wise symmetric KL Divergences, sorted by information gain. Taller bars indicate that the feature is more important for distinguishing between unsupervised clusters. (b) Heatmaps from top 20 KL divergences for binary features (comorbidities, symptoms), sorted by KL divergence values. Plotted values are proportions of present features for a given cluster, ranging from 0 to 100%. Proportion of patients per cluster with particular demographic attributes are also plotted for reference. Clusters are sorted by the proportion of patients with severe disease/death outcomes within the cluster (bottom row). (c) Boxplots for age, BMI, GFR, and hemoglobin values per cluster. These data are presented as boxplots instead of in the heatmap fashion in subplot (b) given the continuous nature of the data.
Figure 5
Figure 5
Triaged classification results by unsupervised cluster. The cluster membership of patients was cross-referenced with the final prediction result obtained, connecting the patient presentation within the first epoch of analysis with the final prediction outcome. Sizes of circles represent the proportion of patients within the cluster with the specified classification results. Blue circles in the “Indeterminate” column indicate that less than 30% of patients still had an indeterminate classification after 48 hours of the triaged prediction approach. Boxes indicate clusters within which more than 5% of patients had a false negative prediction result. Visualizing the data in this manner aids in finding sub-groups of patients who are particularly well-suited for the triaged classification approach and drives discussion about factors potentially influencing classification results.

References

    1. Meiring C, et al. Optimal intensive care outcome prediction over time using machine learning. PLoS ONE. 2018;13:e0206862. doi: 10.1371/journal.pone.0206862. - DOI - PMC - PubMed
    1. Kwon J, Lee Y, Lee Y, Lee S, Park J. An algorithm based on deep learning for predicting in-hospital cardiac arrest. J. Am. Heart Assoc. 2018 doi: 10.1161/JAHA.118.008678. - DOI - PMC - PubMed
    1. Komorowski M, Celi LA, Badawi O, Gordon AC, Faisal AA. The Artificial Intelligence Clinician learns optimal treatment strategies for sepsis in intensive care. Nat. Med. 2018;24:1716–1720. doi: 10.1038/s41591-018-0213-5. - DOI - PubMed
    1. Prosperi MCF, et al. Investigation of expert rule bases, logistic regression, and non-linear machine learning techniques for predicting response to antiretroviral treatment. Antivir. Ther. 2009;14:433–442. doi: 10.1177/135965350901400315. - DOI - PubMed
    1. Burdick H, et al. Prediction of respiratory decompensation in Covid-19 patients using machine learning: The READY trial. Comput. Biol. Med. 2020;124:103949. doi: 10.1016/j.compbiomed.2020.103949. - DOI - PMC - PubMed

Publication types