. 2023 Apr;10(12):e2207152.
doi: 10.1002/advs.202207152. Epub 2023 Feb 8.

Human RSPO1 Mutation Represses Beige Adipocyte Thermogenesis and Contributes to Diet-Induced Adiposity

Affiliations

Human RSPO1 Mutation Represses Beige Adipocyte Thermogenesis and Contributes to Diet-Induced Adiposity

Yingkai Sun et al. Adv Sci (Weinh). 2023 Apr.

Abstract

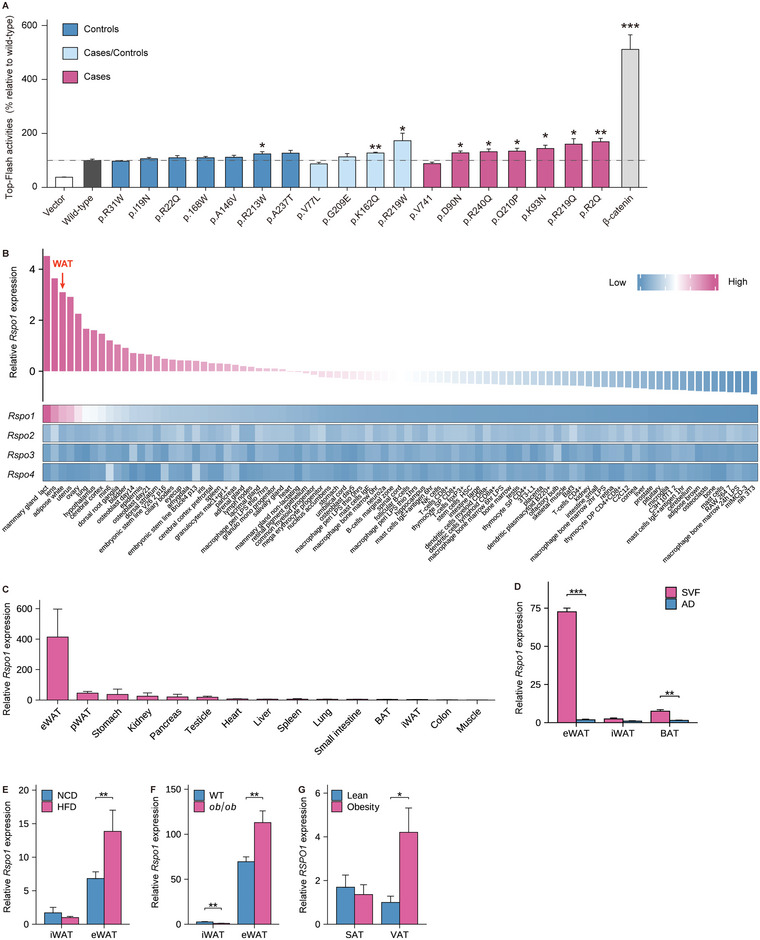
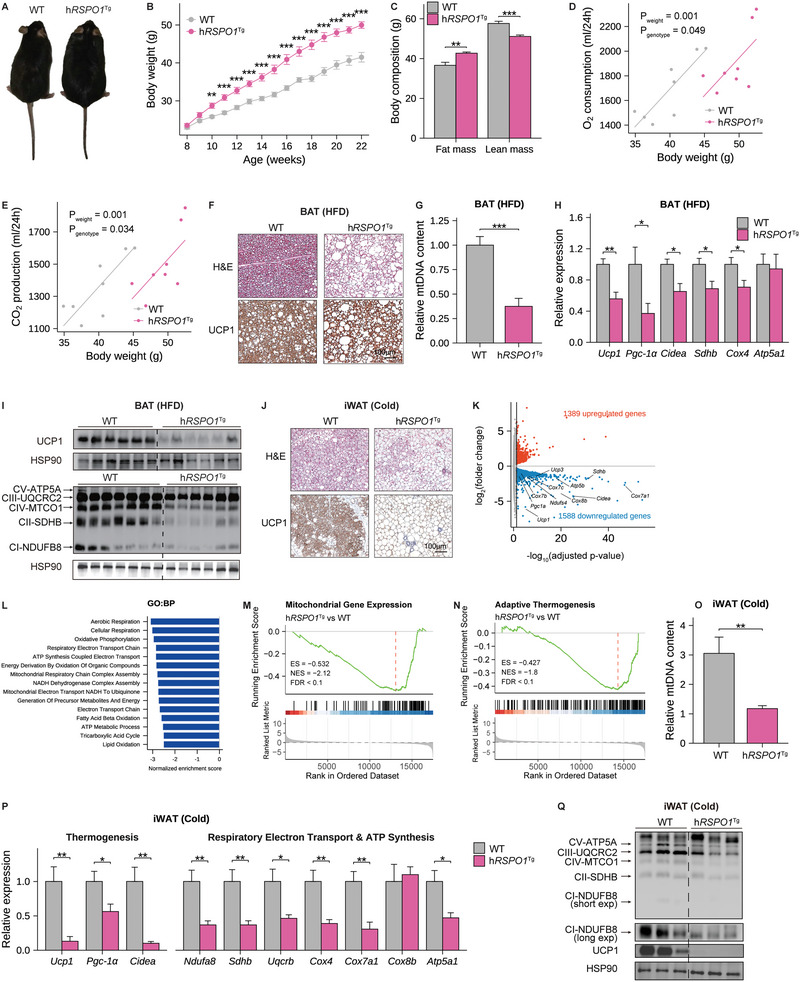
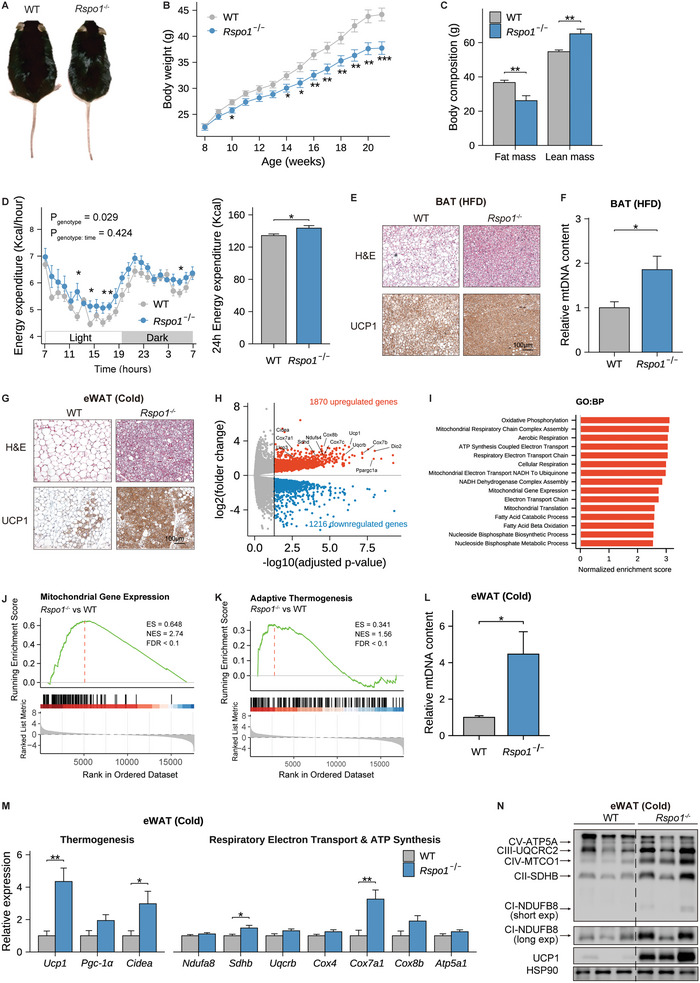
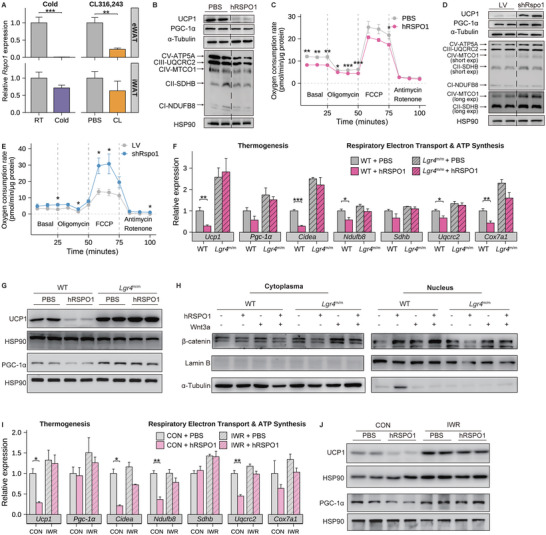
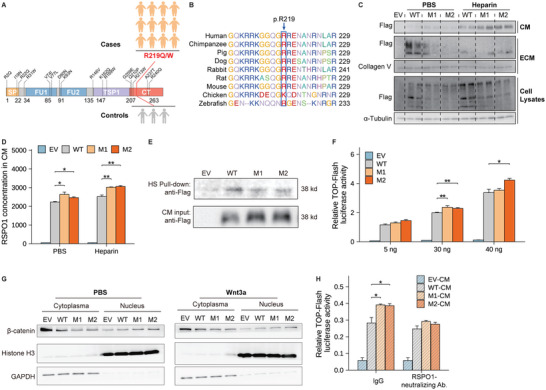
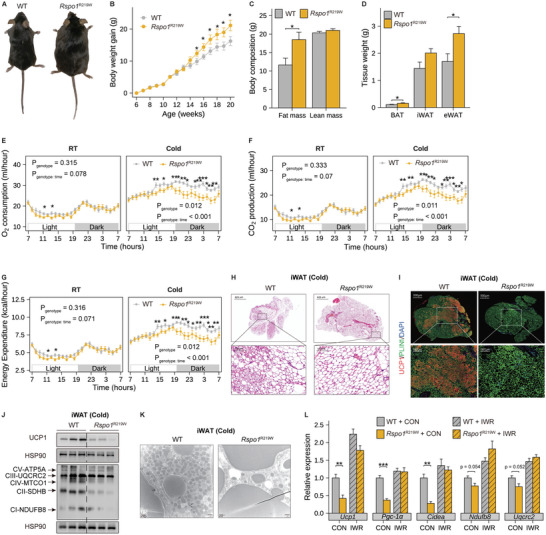
Recent genetic evidence has linked WNT downstream mutations to fat distribution. However, the roles of WNTs in human obesity remain unclear. Here, the authors screen all Wnt-related paracrine factors in 1994 obese cases and 2161 controls using whole-exome sequencing (WES) and identify that 12 obese patients harbor the same mutations in RSPO1 (p.R219W/Q) predisposing to human obesity. RSPO1 is predominantly expressed in visceral fat, primarily in the fibroblast cluster, and is increased with adiposity. Mice overexpressing human RSPO1 in adipose tissues develop obesity under a high-fat diet (HFD) due to reduced brown/beige fat thermogenesis. In contrast, Rspo1 ablation resists HFD-induced adiposity by increasing thermogenesis. Mechanistically, RSPO1 overexpression or administration significantly inhibits adipocyte mitochondrial respiration and thermogenesis via LGR4-Wnt/β-catenin signaling pathway. Importantly, humanized knockin mice carrying the hotspot mutation (p.R219W) display suppressed thermogenesis and recapitulate the adiposity feature of obese carriers. The mutation disrupts RSPO1's electrostatic interaction with the extracellular matrix, leading to excessive RSPO1 release that activates LGR4-Wnt/β-catenin signaling and attenuates thermogenic capacity in differentiated beige adipocytes. Therefore, these findings identify that gain-of-function mutations and excessive expression of RSPO1, acting as a paracrine Wnt activator, suppress fat thermogenesis and contribute to obesity in humans.

Keywords: RSPO1; Wnt signaling; obesity; pathogenic gene; thermogenesis; whole-exome sequencing.


Conflict of interest statement

The authors declare no conflict of interest.

Figures

Figure 1
Figure 1
RSPO1 is enriched in visceral fat and increases with adiposity. A) TOP‐Flash luciferase reporter assay of HEK293T cells transfected with plasmids of wild‐type RSPO1 and 18 rare/low‐frequency RSPO1 nonsynonymous variants described in Table 1, respectively. β‐catenin plasmids were applied as positive control (n = 5 per group). Statistical significances were calculated between wild‐type and each variant using unpaired Student's t‐test. B) Heat map representing the expression of mouse Rspo1/2/3/4 in diverse tissues and cell lines, as analyzed using a publicly available microarray data set (GSE10246). C) Quantitative PCR validation of Rspo1 expression in multiple tissues of 8‐week‐old male C57BL/6J mice (n = 3–6 per group). D) Rspo1 mRNA expression in the stromal vascular fractions (SVF) and mature adipocytes (AD) of eWAT, iWAT, and BAT, respectively (n = 3 per group). E,F) Rspo1 mRNA expression in iWAT and eWAT of mice fed normal chow diet (NCD) and high‐fat diet (HFD) (n = 13–16 per group) (E), or in that of wild‐type (WT) and ob/ob mice (n = 10 per group) (F). G) RSPO1 mRNA expression in the subcutaneous adipose tissue (SAT) and visceral adipose tissues (VAT) of obese subjects versus normal weight controls (n = 10–17 per group). eWAT, epididymal white adipose tissue; pWAT, pararenal white adipose tissue; iWAT, inguinal white adipose tissue; BAT, brown adipose tissue. SAT, subcutaneous adipose tissue; VAT, visceral adipose tissue. Data are shown as the mean ± sem. p values were calculated using unpaired Student's t‐test. *p < 0.05; **p < 0.01; ***p < 0.001.
Figure 2
Figure 2
Human RSPO1 overexpression promotes diet‐induced obesity by suppressing adipose thermogenesis. A–C) A representative global image (A), body weight curve (B), and body composition (C) of human RSPO1 transgenic (hRSPO1 Tg) and WT littermate mice fed HFD for 14 weeks (n = 8 per group). D,E) ANCOVA analysis of 24‐hour O2 consumption (D) and CO2 production (E) with body weight as a covariate in HFD‐fed WT and hRSPO1 Tg mice (n = 8 per group). F) Representative images of H&E staining and UCP1 immunohistochemical staining of BAT in HFD‐fed WT and hRSPO1 Tg mice (n = 4 per group). Scale bar, 100 µm. G) The mitochondrial DNA (mtDNA) content of BAT in HFD‐fed WT and hRSPO1 Tg mice (n = 6–7 for per group). H,I) Quantitative PCR analysis (H) and Western blotting (I) of mitochondrial respiratory complexes and thermogenic genes in BAT of HFD‐fed WT and hRSPO1 Tg mice (n = 6–7 per group). J) Representative images of H&E staining and UCP1 immunohistochemical staining in iWAT of WT and hRSPO1 Tg mice exposed to chronic cold stimulation (4 °C) for 10 days (n = 4 per group). Scale bar, 100 µm. K) The volcano plot of genes differentially expressed in iWAT of hRSPO1 Tg versus WT mice under chronic cold stimulation (n = 3 per group). Biomarkers associated with mitochondrial functions were indicated. L) The top‐downregulated (FDR < 0.05) pathways revealed by GSEA based on GO:BP database in iWAT of hRSPO1 Tg versus WT mice under chronic cold stimulation. (M) and (N) GSEA results of mitochondrial gene expression (M) and adaptive thermogenesis (N) in iWAT of hRSPO1 Tg versus WT mice under chronic cold stimulation. O–Q) Relative mtDNA content (O), quantitative PCR analysis (P), and Western blotting analysis (Q) of mitochondrial respiratory complexes and thermogenic genes in iWAT of hRSPO1 Tg and WT mice under chronic cold stimulation (n = 7–8 per group). Data are shown as the mean ± sem, and statistical differences between genotypes were assessed by unpaired Student's t‐test (B,C,G,H,O,P); FDR below 0.05 was considered as the criteria for evaluating differentially expressed genes between genotypes (K); FDR below 0.1 was considered as statistical significance in GSEA (L–N). *p < 0.05; **p < 0.01; ***p < 0.001.
Figure 3
Figure 3
Rspo1 deficiency promotes adipose thermogenesis and resists HFD‐induced obesity. A–C) A representative global image (A), body weight curve (n = 15–22 per group) (B), and body composition (n = 7–8 per group) (C) of Rspo1 −/− and WT mice fed HFD for 13 weeks. D) Hourly (left) and total (right) energy expenditure over 24 h between Rspo1 −/− and WT mice fed with 1‐week HFD (n = 8 per group). The hourly measurements were assessed by two‐way ANOVA model to evaluate the interaction between genotype and time, and pairwised t‐test with Benjamini–Hochberg correction was used as post‐hoc test for evaluating the differences between genotypes in each hour. The total energy expenditure over 24 h was compared with unpaired Student's t‐test. E) Representative images of H&E staining and UCP1 immunohistochemical staining in BAT of WT and Rspo1 −/− mice fed HFD (n = 4 per group). Scale bar, 100 µm. F) The mtDNA content of BAT in Rspo1 −/− and WT mice fed HFD (n = 7–8 per group). G) Representative images of H&E staining and UCP1 immunohistochemical staining in eWAT of WT and Rspo1 −/− mice exposed to chronic cold stimulation (4 °C) for 10 days (n = 4 per group). Scale bar, 100 µm. H) The volcano plot of genes differentially expressed in eWAT of Rspo1 −/− versus WT mice under chronic cold stimulation (n = 3 per group). Biomarkers associated with mitochondrial functions were indicated. I) The top‐upregulated pathways (FDR < 0.05) revealed by GSEA analysis based on GO:BP database in eWAT of Rspo1 −/− versus WT mice under chronic cold stimulation. J,K) GSEA results of mitochondrial gene expression (J) and adaptive thermogenesis (K) in eWAT of Rspo1 −/− versus WT mice under chronic cold stimulation. L,N) Relative mtDNA content (L), quantitative PCR analysis (M), and Western blotting (N) analysis of mitochondrial respiratory complexes and thermogenic genes in eWAT of Rspo1 −/− and WT mice under chronic cold stimulation (n = 7–8 per group). Data are shown as the mean ± sem, and statistical differences between genotypes were assessed by unpaired Student's t‐test (B,C,F,L,M); FDR below 0.05 was considered as the criteria for evaluating differential expressed genes between genotypes (H); FDR below 0.1 was considered as statistical significance in GSEA (I–K). *p < 0.05; **p < 0.01; ***p < 0.001.
Figure 4
Figure 4
Human RSPO1 protein suppresses beige adipocyte thermogenesis in an Lgr4/β‐catenin dependent manner. A) Quantitative PCR analysis of Rspo1 mRNA levels in eWAT (upper panels) and iWAT (bottom panels) in response to either chronic cold exposure (right panels) (n = 7–8 per group) or β3‐AR agonist (CL316243) injection (right panels) (n = 6 per group). B,C) Changes of mitochondrial respiratory complexes and thermogenic proteins (UCP1 and PGC‐1α) (B) and OCR (C) in fully differentiated beige adipocytes with human RSPO1 (hRSPO1) recombinant protein or PBS treatment (n = 5 per group). D,E) Changes of mitochondrial respiratory complexes and thermogenic proteins (D) and OCR (E) in fully differentiated beige adipocytes treated with Rspo1‐shRNA (shRspo1) or vector‐shRNA (LV) (n = 4 per group). F,G) Quantitative PCR analysis of thermogenic genes and mitochondrial respiratory complexes (F) and protein quantification of UCP1 and PGC‐1α (G) in fully differentiated beige adipocytes derived from WT and Lgr4 m/m mice in response to hRSPO1 or PBS treatment, respectively (n = 4–6 per group). H) Alterations of cytoplasmic and nuclear β‐catenin protein in the SVFs derived from WT and Lgr4 m/m mice in response to hRSPO1, Wnt3a, and their combinations. I,J) Quantitative PCR analysis of thermogenic genes and mitochondrial respiratory complexes (I) and protein quantification of UCP1 and PGC‐1α (J) in fully differentiated beige adipocytes treated with hRSPO1 or PBS in the presence or absence of IWR‐endo1, respectively (n = 3 per group). WT, wild‐type mice; Lgr4 m/m, Lgr4 mutant mice. Data are shown as the mean ± sem. Statistical differences between groups were assessed by unpaired Student's t‐test (A,C,E,F,I). *p < 0.05; **p < 0.01; ***p < 0.001.
Figure 5
Figure 5
RSPO1 p.R219W/Q mutations disrupt their electrostatic interaction with the ECM and activate Wnt pathway. A) Schematic representation of the full‐length human RSPO1 protein and the location of p.R219W/Q mutations in the C‐terminal (CT) region with a cluster of positively charged amino acid residues (Figure S8, Supporting Information). SP, N‐terminal signal peptide; FR, furin‐like domains; TSR, thrombospondin protein 1 domain. 12 obese cases and 3 lean controls harboring the mutations were identified in GOCY cohort (Figure S1, Supporting Information). B) The consensus sequence of the conserved Arginine 219 (R219) residue in RSPO1 protein across different species. C) Protein secretion of wild‐type RSPO1 (WT) and the two mutants (M1, p.R219W; M2, p.R219Q) in conditioned medium (CM) and by extracellular matrix (ECM) and cell lysates in the absence or presence of 50 µg mL−1 heparin, respectively. EV, empty vector. D) RSPO1 protein levels in the conditioned media of the indicated groups (Figure 5C) measured by ELISA (n = 3 per group). E) Heparan sulfate (HS) pull‐down assay (Figure S8C, Supporting Information) of RSPO1–HS complex obtained from co‐incubation of HS‐beads and conditioned media (CM) derived from HEK293T cells transfected with wild‐type or mutant RSPO1 plasmids, respectively. Both CM (as Input) and HS‐beads put‐down (as Pull‐down) fractions were immunoblotted with the anti‐Flag antibody. F) A TOP‐Flash luciferase reporter assay was performed in HEK293T cells. The wild‐type and the two mutant RSPO1 plasmids were used for the transfection at the indicated dosages (5, 30, and 40 ng of expression plasmids), and pRL‐SV40 (expressing Renilla luciferase) was used as a normalized control (n = 3 per group). A representative result of three independent experiments is shown. G) The β‐catenin translocation examination was performed in HEK293T cells transfected with wild‐type or the two mutant RSPO1 plasmids, and treated with PBS or 100 ng mL−1 Wnt3a, respectively. H) A TOP‐Flash luciferase reporter assay was performed in HEK293T cells treated with conditioned media, collected from HEK293T cells transfected with empty vector, wild‐type and two mutant RSPO1 plasmids, in the presence or absence of 2 µg mL−1 RSPO1 neutralizing antibody (n = 3–4 per group). Data are shown as the mean ± sem. Statistical differences between groups were assessed by unpaired Student's t‐test (D,F,H) *p < 0.05; **p < 0.01; ***p < 0.001.
Figure 6
Figure 6
Homologous Rspo1 p.R219W mutation suppresses fat thermogenesis and leads to obesity in vivo. A–D) A representative global image (A), body weight curve (n = 9–11 per group) (B), body composition (C), and the weight of three fat tissues (D) of female homozygous Rspo1 R219W and WT littermate mice fed HFD for 10 weeks (n = 8 per group). E–G) O2 consumption, CO2 production, and energy expenditure of WT and Rspo1 R219W mice fed chow diet shifting from room temperature (22 °C, RT) to cold conditions (4 °C, cold) (n = 12 per group). The hourly measurements were assessed by two‐way ANOVA model to evaluate the interaction between genotype and time, and pairwised t‐test with Benjamini–Hochberg correction was used as post‐hoc test to evaluate the differences between genotypes in each hour. H–K) Representative images of H&E staining (H), UCP1 immunofluorescence staining (I), protein expression changes of mitochondrial respiratory complexes and thermogenic genes (J), and electron microscopic images of mitochondria (K) in iWAT of WT and Rspo1 R219W mice under chronic cold stimulation (4 °C) for 10 days (n = 3 per group). UCP1 (red) and perilipin protein (green) were used to indicate beige adipocytes and lipid droplets, respectively. Scale bars are indicated in the panels. L) Quantitative PCR analysis of thermogenic genes in fully differentiated beige adipocytes derived from the iWAT of WT and Rspo1 R219W mice in the presence or absence of IWR‐endo1 treatment (n = 4 per group). Data are shown as the mean ± sem, and statistical significances between groups were assessed by unpaired Student's t‐test (B–D,L). *p < 0.05; **p < 0.01; ***p <0.001.

References

    1. a) van Marken Lichtenbelt W. D., Vanhommerig J. W., Smulders N. M., Drossaerts J. M. A. F. L., Kemerink G. J., Bouvy N. D., Schrauwen P., Teule G. J. J., N. Engl. J. Med. 2009, 360, 1500; - PubMed
    2. b) Din M. U., Saari T., Raiko J., Kudomi N., Maurer S. F., Lahesmaa M., Fromme T., Amri E.‐Z., Klingenspor M., Solin O., Nuutila P., Virtanen K. A., Cell Metab. 2018, 28, 207. - PubMed
    1. Giordano A., Frontini A., Cinti S., Nat. Rev. Drug Discovery 2016, 15, 405. - PubMed
    1. Cypess A. M., Lehman S., Williams G., Tal I., Rodman D., Goldfine A. B., Kuo F. C., Palmer E. L., Tseng Y.‐H., Doria A., Kolodny G. M., Kahn C. R., N. Engl. J. Med. 2009, 360, 1509. - PMC - PubMed
    1. Becher T., Palanisamy S., Kramer D. J., Eljalby M., Marx S. J., Wibmer A. G., Butler S. D., Jiang C. S., Vaughan R., Schöder H., Mark A., Cohen P., Nat. Med. 2021, 27, 58. - PMC - PubMed
    1. a) Feldmann H. M., Golozoubova V., Cannon B., Nedergaard J., Cell Metab. 2009, 9, 203; - PubMed
    2. b) Mano‐Otagiri A., Iwasaki‐Sekino A., Nemoto T., Ohata H., Shuto Y., Nakabayashi H., Sugihara H., Oikawa S., Shibasaki T., Regul. Pept. 2010, 160, 81; - PubMed
    3. c) Berg F., Gustafson U., Andersson L., PLoS Genet. 2006, 2, e129; - PMC - PubMed
    4. d) Zheng Q., Lin J., Huang J., Zhang H., Zhang R., Zhang X., Cao C., Hambly C., Qin G., Yao J., Song R., Jia Q., Wang X., Li Y., Zhang N., Piao Z., Ye R., Speakman J. R., Wang H., Zhou Q., Wang Y., Jin W., Zhao J., Proc. Natl. Acad. Sci. USA 2017, 114, E9474. - PMC - PubMed

Publication types

LinkOut - more resources