. 2023 Feb 8;21(1):28.
doi: 10.1186/s12915-023-01521-5.

Human Satellite 1A analysis provides evidence of pericentromeric transcription

Affiliations

Human Satellite 1A analysis provides evidence of pericentromeric transcription

Mariana Lopes et al. BMC Biol. .

Abstract

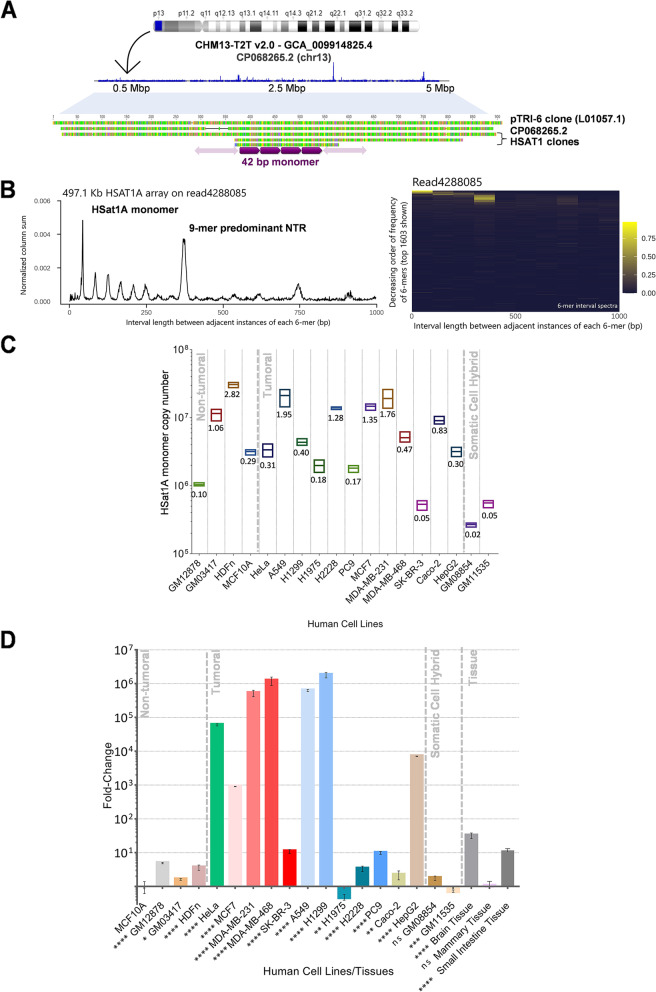
Background: Pericentromeric regions of human chromosomes are composed of tandem-repeated and highly organized sequences named satellite DNAs. Human classical satellite DNAs are classified into three families named HSat1, HSat2, and HSat3, which have historically posed a challenge for the assembly of the human reference genome where they are misrepresented due to their repetitive nature. Although being known for a long time as the most AT-rich fraction of the human genome, classical satellite HSat1A has been disregarded in genomic and transcriptional studies, falling behind other human satellites in terms of functional knowledge. Here, we aim to characterize and provide an understanding on the biological relevance of HSat1A.

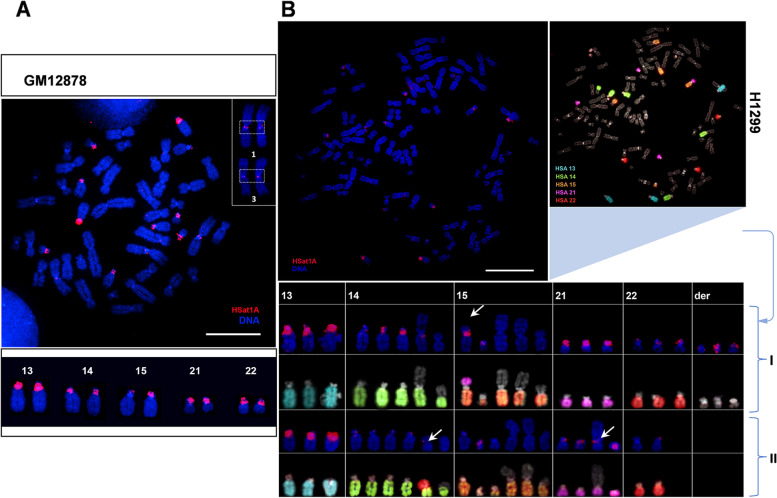
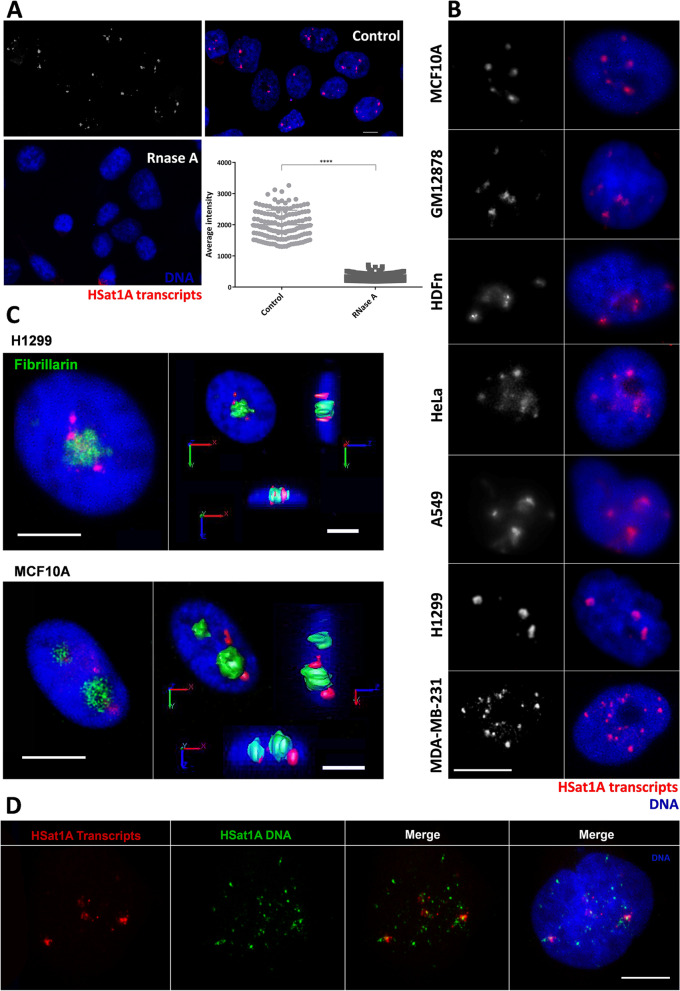
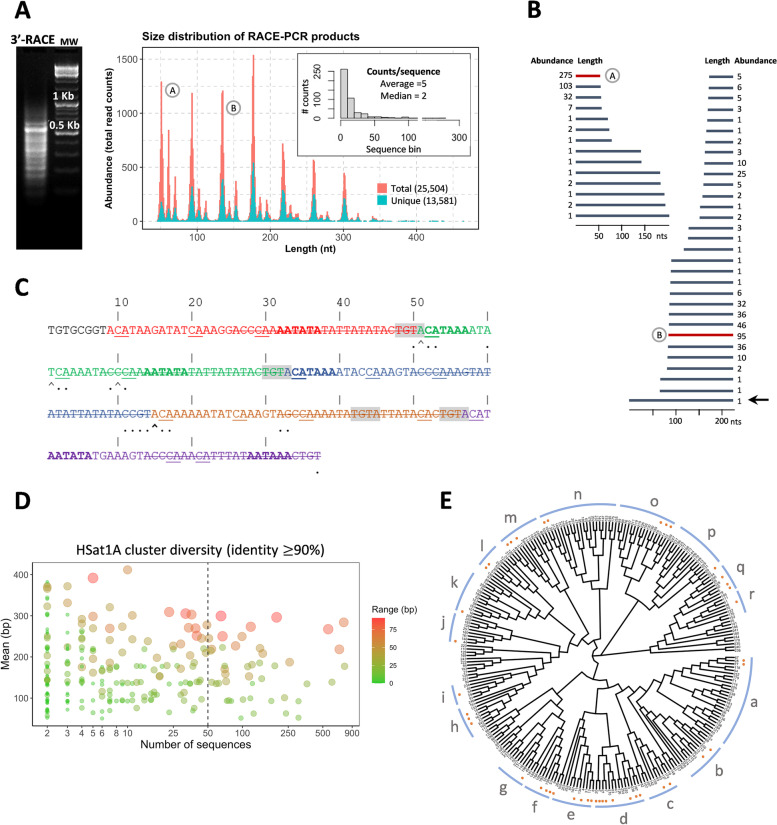
Results: The path followed herein trails with HSat1A isolation and cloning, followed by in silico analysis. Monomer copy number and expression data was obtained in a wide variety of human cell lines, with greatly varying profiles in tumoral/non-tumoral samples. HSat1A was mapped in human chromosomes and applied in in situ transcriptional assays. Additionally, it was possible to observe the nuclear organization of HSat1A transcripts and further characterize them by 3' RACE-Seq. Size-varying polyadenylated HSat1A transcripts were detected, which possibly accounts for the intricate regulation of alternative polyadenylation.

Conclusion: As far as we know, this work pioneers HSat1A transcription studies. With the emergence of new human genome assemblies, acrocentric pericentromeres are becoming relevant characters in disease and other biological contexts. HSat1A sequences and associated noncoding RNAs will most certainly prove significant in the future of HSat research.

Keywords: HSat1A; Noncoding RNA; Pericentromere; Satellite transcription; Transcript polyadenylation.


Conflict of interest statement

The authors declare that they have no competing interests .

Figures

Fig. 1
Fig. 1
HSat1A sequence analysis and copy number/expression evaluation. A Obtained HSat1A clones (GenBank accession numbers: OP172545–OP172627) were analyzed in Tandem Repeats Finder and proved to be systematically composed of 42-bp repeats. HSat1A clone was BLAST searched against CHM13-T2T v2.0 (GenBank assembly accession GCA_009914755.4) and filtrated hits were mapped into chromosomes. HSat1A BLAST hits are represented (in blue) in CHM13-T2T chromosome 13 (CP068265.2), reported to have a large HSat1A array [14]. The ideogram was adapted from the Ensembl genome browser. In silico mapping of HSat1A hits was performed in Geneious. Concatenated hits are observable in a 5-Mb extent. HSat1A clones, HSA13 T2T HSat1A array [13, 64], and pTRI-6 (L01057.1) sequence stretches were aligned (Additional file 1: Supplementary Table S3). B HSat1A periodicity spectrum and heatmap in GM12878 sequencing data. NTRprism reveals two predominant peaks: one corresponding to HSat1A monomer and the second to a 9-mer higher repeat. C HSat1A monomer copy number quantification in several human cell lines. Values are mean ± SD (n = 3) (Additional file 4). Statistical analysis is detailed in Additional file 1: Supplementary Fig. S2. HSat1A estimation in percentage of the haploid human reference genome (bp/total bp). D HSat1A ncRNA relative quantification by RT-qPCR in fold change (MCF10A set as reference). Values are mean ± SD (n = 3) (Additional file 4). *p ≤ 0.05, **p ≤ 0.01, ***p ≤ 0.001, ****p ≤ 0.0001, ns, not statistically significant (one-way ANOVA with Tukey’s multiple comparisons test)
Fig. 2
Fig. 2
HSat1A FISH mapping (red) in human chromosomes (blue). A HSat1A mapped in GM12878. Obtained hybridization signals in acrocentric chromosomes are highlighted above. Hybridization signals are also present in chromosomes 1 and 3. Chromosomes were identified by reverse-DAPI. B HSat1A mapped in chromosomes from H1299, sequentially hybridized with human painting probes for acrocentric chromosomes. Corresponding chromosomes are visible in the table above (two different clones). The illustrative metaphase corresponds to clone I (first two rows). The column “der” for clone I shows three derivative chromosomes (non-acrocentric) with visible HSat1A signals. White arrows indicate chromosomal alterations occurring with acrocentric chromosomes and modifying the HSat1A hybridization pattern. Scale bars represent 10 μm
Fig. 3
Fig. 3
Detection of HSat1A transcripts by RNA-FISH and RNA-FISH/IF. A HSat1A RNA-FISH with RNase A treatment. HSat1A transcripts were detected by RNA-FISH (red) in control and treated cells. Signal decrease in RNase-treated cells demonstrates that the observed signals are RNA-specific. Evaluation of the average intensity of active signal objects (all slices) in RNA-FISH control and RNA-FISH + RNase A was performed in “Counting and Tracking” (AutoQuant X3). Analysis shown in H1299. Values are mean ± SD (n = 20). ****p ≤ 0.0001 (unpaired t test). B Nuclear organization of HSat1A transcripts (red). Different spatial distribution and number of foci are observable between cell lines with similar amounts of HSat1A transcripts (RT-qPCR data). C Spatial organization of HSat1A transcripts in relation to nucleoli. HSat1A RNA-FISH (red) coupled with IF for fibrillarin detection (green). HSat1A transcripts seem to accumulate adjacently to nucleoli, as seen by confocal 3D image analysis for H1299 and MCF10A cells. Orthogonal slices for axis projections are displayed with isosurfaces for both channels. D HSat1A RNA-FISH (red) followed by HSat1A DNA-FISH (green). Merged confocal images show distinct signal features, with some co-localized signals. DNA is in blue (DAPI) in all the presented images. Scale bars represent 10 μm
Fig. 4
Fig. 4
HSat1A 3′ RACE analysis. A Agarose gel corresponding to HSat1A 3′ RACE-amplified transcripts (left); molecular weight (right). A size distribution plot is presented for the graphical representation of HSat1A reads. Assembled transcripts contained HSat1A peaks corresponding to multiples of the 42-monomer. From the total of HSat1A sequences, 16,332 sequences were found to be unique (blue in plot). The bar chart (top right corner) shows the high representation of unique sequences, visible in the distribution of counts/sequence. A and B (round) sequences are representative of the identified peaks and are displayed in B. B HSat1A tandem transcript organization. In a universe of 200 nucleotides, it is possible to reconstruct transcripts of longer lengths with smaller sequences. The black arrow points to the longer represented read (structure explored in C). C HSat1A read structure analyzed in the light of the consensus mammalian poly(A) signal. Different colors display HSat1A monomers HSat1A are organized in alternative A (17 nt) and B (25 nt); strikethrough nucleotides in the figure. Sequences that may function as poly(A) signal hexamers [72] are highlighted in bold. Shades of gray correspond to the sequence that functions as the recognition of the poly(A) signal in the absence of the canonical hexamer element [A(A/U)UAAA]. Nucleotides located at the site of optimal 3′ cleavage, named the poly(A) site, are underlined. Arrows point to the largest number of duplicates that are cleaved at that nucleotide position (bold for the largest most abundant). Dots represent the cleavage location of duplicates that contain a difference ≥ 1 nucleotide from the previous sequence. The cleavage positions address the possible occurrence of alternative polyadenylation, resulting in the observable variation of transcript length. D HSat1A transcript cluster membership. Colors determine the range (bp) between sequences of the same cluster. E Phylogenetic tree depicting transcript variability, constructed from the multiple alignment between the center sequences of each cluster. Clusters can be grouped accordingly to their distance (groups a–r). Orange dots represent clusters with more than 50 elements

Similar articles

Cited by

References

    1. Warburton PE, Hasson D, Guillem F, Lescale C, Jin X, Abrusan G. Analysis of the largest tandemly repeated DNA families in the human genome. BMC Genomics. 2008;9:533. - PMC - PubMed
    1. Yunis JJ, Yasmineh WG. Heterochromatin, satellite DNA, and cell function. Science. 1971;174(4015):1200–1209. - PubMed
    1. Kit S. Equilibrium sedimentation in density gradients of DNA preparations from animal tissues. J Mol Biol. 1961;3(6):711–IN712. - PubMed
    1. Choo KA. The centromere, vol. 320. Oxford: Oxford University Press; 1997.
    1. Lee C, Wevrick R, Fisher RB, Ferguson-Smith MA, Lin CC. Human centromeric DNAs. Hum Genet. 1997;100(3–4):291–304. - PubMed

Publication types