. 2023 Feb 9;11(1):24.
doi: 10.1186/s40168-022-01454-1.

Ultra-sensitive isotope probing to quantify activity and substrate assimilation in microbiomes

Affiliations

Ultra-sensitive isotope probing to quantify activity and substrate assimilation in microbiomes

Manuel Kleiner et al. Microbiome. .

Abstract

Background: Stable isotope probing (SIP) approaches are a critical tool in microbiome research to determine associations between species and substrates, as well as the activity of species. The application of these approaches ranges from studying microbial communities important for global biogeochemical cycling to host-microbiota interactions in the intestinal tract. Current SIP approaches, such as DNA-SIP or nanoSIMS allow to analyze incorporation of stable isotopes with high coverage of taxa in a community and at the single cell level, respectively, however they are limited in terms of sensitivity, resolution or throughput.

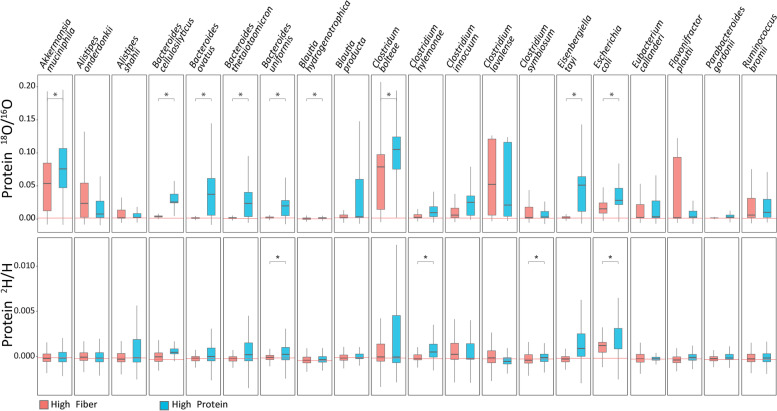
Results: Here, we present an ultra-sensitive, high-throughput protein-based stable isotope probing approach (Protein-SIP), which cuts cost for labeled substrates by 50-99% as compared to other SIP and Protein-SIP approaches and thus enables isotope labeling experiments on much larger scales and with higher replication. The approach allows for the determination of isotope incorporation into microbiome members with species level resolution using standard metaproteomics liquid chromatography-tandem mass spectrometry (LC-MS/MS) measurements. At the core of the approach are new algorithms to analyze the data, which have been implemented in an open-source software ( https://sourceforge.net/projects/calis-p/ ). We demonstrate sensitivity, precision and accuracy using bacterial cultures and mock communities with different labeling schemes. Furthermore, we benchmark our approach against two existing Protein-SIP approaches and show that in the low labeling range used our approach is the most sensitive and accurate. Finally, we measure translational activity using 18O heavy water labeling in a 63-species community derived from human fecal samples grown on media simulating two different diets. Activity could be quantified on average for 27 species per sample, with 9 species showing significantly higher activity on a high protein diet, as compared to a high fiber diet. Surprisingly, among the species with increased activity on high protein were several Bacteroides species known as fiber consumers. Apparently, protein supply is a critical consideration when assessing growth of intestinal microbes on fiber, including fiber-based prebiotics.

Conclusions: We demonstrate that our Protein-SIP approach allows for the ultra-sensitive (0.01 to 10% label) detection of stable isotopes of elements found in proteins, using standard metaproteomics data.


Conflict of interest statement

The authors declare that they have no competing interests.

Figures

Fig. 1
Fig. 1
Modeled spectra of three E. coli peptides after 1/8 generations of growth on 1% (left) and 10% (right) 13C1-6 glucose (13C/12C 0.02 and 0.11 respectively). Assimilation of 13C into peptides leads to a shift of matter away from the monoisotopic mass (shown as *). The resulting peak intensity changes are shown in red—for peaks with decreased intensity -, and blue - for peaks with increased intensity after labeling. Dashed lines show experimentally determined average detection limits for peaks (see “Methods” section). Peaks below the dashed line would not be recorded by the mass spectrometer. Percentages above lines indicate how much of the actual change is detectable in practice. Peptide 1 - IGLETAR; peptide 2 - AFEMGWRPDMSGVK; peptide 3 - QIQEALQYANQAQVTKPQIQQTGEDITQDTLFLLGSEALESMIK
Fig. 2
Fig. 2
A small modification of the peptide identification approach drastically increases the number of peptides with 1–10% label that can be identified. Number of peptide spectral matches (PSMs) identified at different 13C label percentages using six different peptide identification strategies. Cultures of a B. subtilis and b E. coli were grown in Bacillus minimal medium or M9 minimal medium (E. coli) in which a percentage of the glucose was replaced with 13C1-6 glucose for > 10 generations to achieve close to complete labeling. Three biological replicates were run for each label percentage. Peptides were identified using the SEQUEST HT Node in Proteome Discoverer (version 2.2) with six different strategies to account for the mass shifts caused by addition of heavy atoms. Standard search: no dynamic modifications to account for addition of label; open search: the precursor mass tolerance was set to 20 Da allowing for the potential addition of 20 neutrons (e.g., 13C atoms) in a peptide; dynamic modifications: allowing for up to three dynamic modifications each of two custom peptide modifications adding a 1 neutron mass shift and a 2 neutron mass shift (up to 9 neutrons in total per peptide); modifications on termini: six dynamic modifications were set up that were restricted to either the C or the N-terminus of the peptide. The modifications account for mass shifts of 1 to 6 neutrons and depending on the search strategy the low mass shifts (1, 2, and 3 neutrons) were set up as modifications on the C or the N-Terminus or low and high mass shift modifications were distributed between both termini. Each modification can only be added to a terminus once. This strategy allows for a total of 21 neutron additions to a peptide
Fig. 3
Fig. 3
The number of labeled atoms per substrate molecule impacts the ability to quantify label incorporation accurately. Labeling, to saturation, of E. coli and B. subtilis with single-labeled (13C2) and fully labeled (13C1-6) glucose. The 13C/12C ratio in the substrate was varied. Note that unlabeled glucose (0% added 13C glucose) has a natural 13C content of around 1.1%. Each orange circle is the median 13C/12C ratio of all peptides measured in one replicate incubation (on average 2758 peptides per replicate). Determined 13C/12C ratios increased linearly with substate 13C/12C ratios (R2 > 0.999). Almost 100% of the substrate 13C was recovered in protein for 13C2 glucose labeled cells. Recovery was lower for 13C1-6 glucose. The proportion of neutron masses detected via the improved peptide identification strategy using N- and C-terminal modifications (yellow circles) increased with substrate 13C/12C ratios, but at low linearity and sensitivity. The number of Calis-p filtered peptide spectrum matches (PSM) decreased for 13C/12C ratios above 2.5% (insets) as expected based on Fig. 2 and Fig. 2. Assimilation of carbon into amino acids in clumps of multiple 13C atoms was detectable in peptide spectra of cultures fed with 13C1-6 glucose as shown in pie charts for experiments fed with 13C/.12C 1% above natural background. The detailed data for this figure can be found in Supplementary Table S3
Fig. 4
Fig. 4
Detection of 13C content of labeled E. coli within a mock community of 32 microorganisms developed by [23]. In each experiment, half of the E. coli cells were labeled using 13C1-6-Glucose, corresponding to one generation of labeling, with glucose containing 0, 1, 5, and 10% 13C on top of natural abundance 13C (three replicate samples were generated for each labeling percentage and measured separately). Label in E. coli (orange circles in a), but not in other organisms (blue circles shown for five organisms in b–e), was clearly detectable and reproducible. Yellow box plots show the measured 13C content of sets of E. coli peptides, obtained by downsampling of the results in a, mimicking the spectral intensities of the peptides collected for each unlabeled organism in panels be, i.e., only E. coli peptides that corresponded in intensity to peptides of the analyzed organism were used. The percentage in parentheses indicates the relative abundance of the organism in the mock community based on its proteinaceous biomass and the “n = ” indicates the average number of peptides passing the filters in Calis-p for SIP value calculation for the organism in each experiment, which also corresponds to the number of E. coli peptides used in downsampling. These results show label incorporation can be estimated, even for relatively rare species. Supplementary Table S5 shows results for each species
Fig. 5
Fig. 5
Measurement of 13C label content in individual proteins. Analysis of a subset of the data shown in Fig. 4. E. coli grown in standard LB medium without label (0% added label) was part of a mock community consisting of 32 microorganisms [23]. To this mock community E. coli grown in minimal M9 medium with glucose (5% of total glucose as 13C1-6-Glucose) in air tight bottles under oxygen limiting conditions was added in a 1:1 ratio to the unlabeled LB grown E. coli cells in the mock community. a Detection of increased 13C/12C ratios in individual proteins as a function of the total number of different peptides detected for each protein. Proteins from all species in the unlabeled mock community are compared to the proteins of all unlabeled species in the mock community that contained the 5% labeled E. coli cells, as well as to the proteins from E. coli in the mock community that contained the labeled E. coli cells. The boxes indicate the 25th and 75th percentile, the line the median, the whiskers the 10th and 90th percentile, and the dots the 5th and 95th percentile. b Examples of E. coli proteins that showed no or high label incorporation in 5% 13C glucose grown E. coli in the mock community. Unchanged 13C/12C ratios shown in the table between treatments indicate that proteins were not produced in cells that were grown in M9 medium with labeled glucose, but were present in cells grown in LB. Proteins with high ratio were mostly or exclusively produced by cells grown in M9. 13C/.12C ratios in the table are averages of three replicate samples. Only proteins that were detected in at least two replicates in one of the conditions are shown. The full table is Supplementary Table S6
Fig. 6
Fig. 6
Comparison of the output from the three Protein-SIP approaches: SIPPER, MetaProSIP, and Calis-p. Four datasets were processed by expert operators for each approach using optimal parameters for each approach. The outputs from each tool were filtered for comparability by retaining only distinct protein unique peptides (PUPs), defined as peptides unique to a protein sequence and with a unique combination of sequence, charge state, and m/z. a Median.13C values were determined for organisms with 9 or more peptides. The expected 13C atom % value for each experimental condition was subtracted from each experimental SIP value and the deviation of the experimental value from the expected value is displayed. b Table showing the total number of protein unique peptides identified and used as the input for each approach and the total for which isotope values were quantified. c Summary of the parameters used for each tool/approach and additional post-processing steps as recommended by each expert operator. Each tool output was filtered for distinct protein unique peptides, i.e., isotope values were only used if the peptide could be uniquely assigned to a single species. MetaProSIP required an additional post-processing step for selecting the highest relative isotope abundance (RIA) value in cases where the tool reported multiple RIA values. Detailed data for this figure is shown in Figure S4 and Tables S7–S10
Fig. 7
Fig. 7
Strong differences in heavy water incorporation in intestinal microbiota species in response to diet. Sixty-three species isolated from human intestinal microbiota were grown together in triplicates in either a high fiber or high protein medium in the presence of unlabeled water or water with either 25% 2H or.18O [11]. Calis-p-based stable isotope ratios are shown for the 20 species for which at least 9 peptides passed Calis-p filtering conditions in all replicates. Each box shows the data for all peptides of the triplicate cultures combined (27 to 2225 peptides per box). The red lines indicate the average median for each species in the control samples with unlabeled water. Statistically significant differences are indicated with ‘*’ based on Student’s t test on the means of replicates at p < 0.05
Fig. 8
Fig. 8
Protein-SIP and direct Protein-SIF workflow using Calis-p 2.1. The data filtering and computations illustrated in step (5) all happen in Calis-p in a fully automated fashion. The user has the ability to set specific parameters when starting the program. Full details on how to operate Calis-p are provided in the Wiki at https://sourceforge.net/projects/calis-p/. Not shown in the figure is that for Protein-SIF calibration of values with a reference material is needed, for details on this see the supplementary text and the original Protein-SIF publication [14]. In step (3), as in most metaproteomics applications, a well-curated protein sequence database is needed for peptide identification (see details in [39])

References

    1. Kleiner M, Wentrup C, Holler T, Lavik G, Harder J, Lott C, et al. Use of carbon monoxide and hydrogen by a bacteria–animal symbiosis from seagrass sediments. Environ Microbiol. 2015;17:5023–5035. doi: 10.1111/1462-2920.12912. - DOI - PMC - PubMed
    1. Mayali X. NanoSIMS: Microscale quantification of biogeochemical activity with large-scale impacts. Annu Rev Mar Sci. 2020;12:449–467. doi: 10.1146/annurev-marine-010419-010714. - DOI - PubMed
    1. Berry D, Loy A. Stable-isotope probing of human and animal microbiome function. Trends Microbiol. 2018;26:999–1007. doi: 10.1016/j.tim.2018.06.004. - DOI - PMC - PubMed
    1. Kong Y, Kuzyakov Y, Ruan Y, Zhang J, Wang T, Wang M, et al. DNA stable-isotope probing delineates carbon flows from rice residues into soil microbial communities depending on fertilization. Appl Environ Microbiol. American Society for Microbiology; 2020;86:e02151–19. - PMC - PubMed
    1. Pett-Ridge J, Firestone MK. Using stable isotopes to explore root-microbe-mineral interactions in soil. Rhizosphere. 2017;3:244–253. doi: 10.1016/j.rhisph.2017.04.016. - DOI

Publication types