. 2023 Feb 8;20(1):28.
doi: 10.1186/s12974-023-02699-9.

Melanophages give rise to hyperreflective foci in AMD, a disease-progression marker

Affiliations

Melanophages give rise to hyperreflective foci in AMD, a disease-progression marker

Sebastien Augustin et al. J Neuroinflammation. .

Abstract

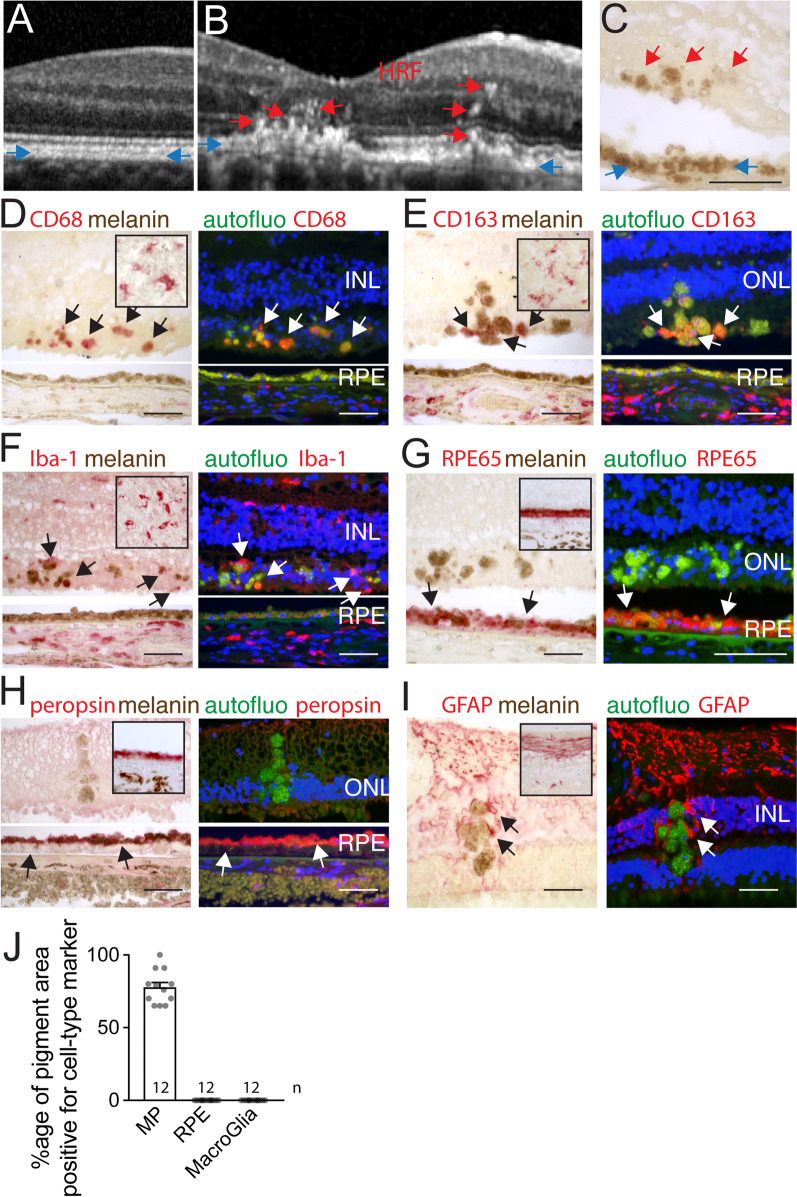
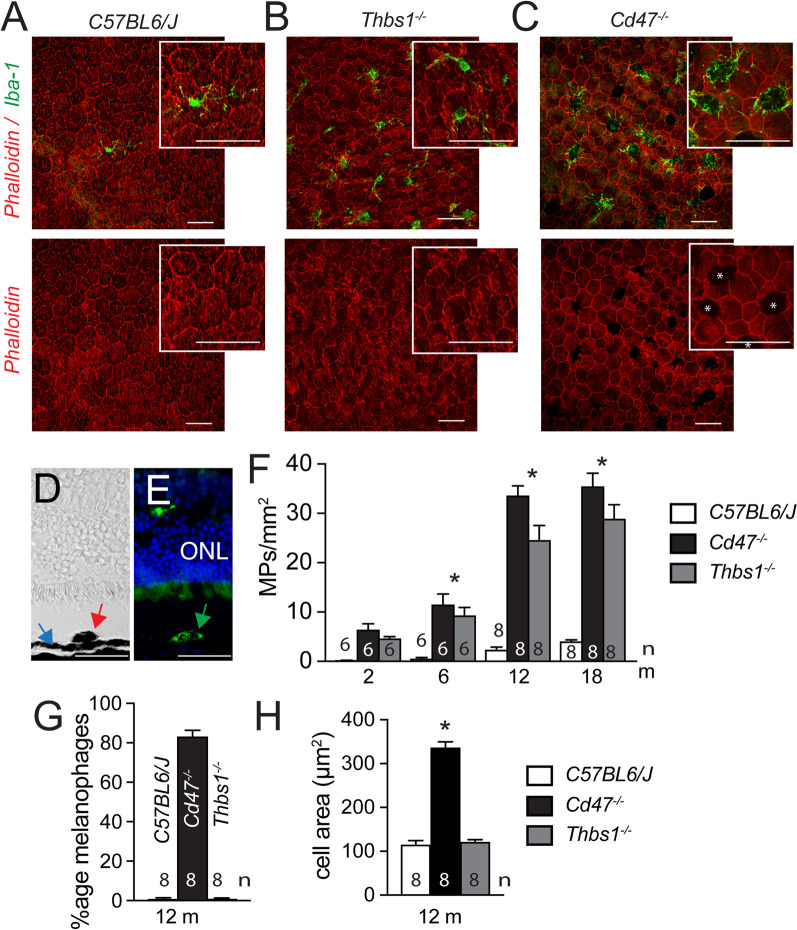
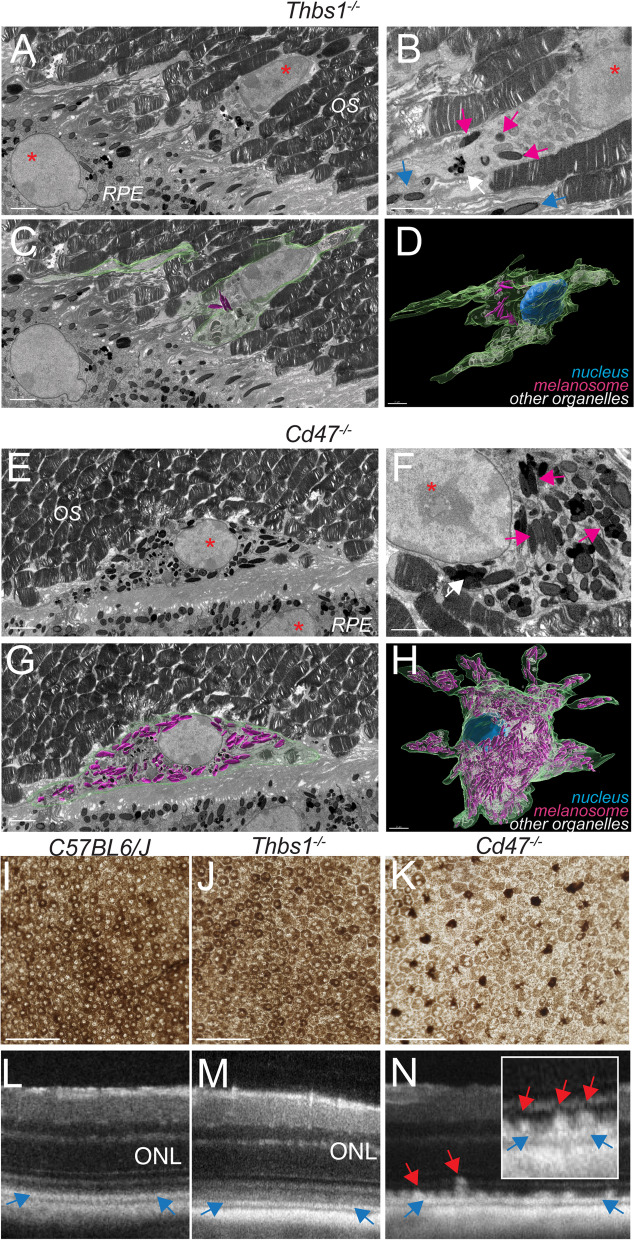
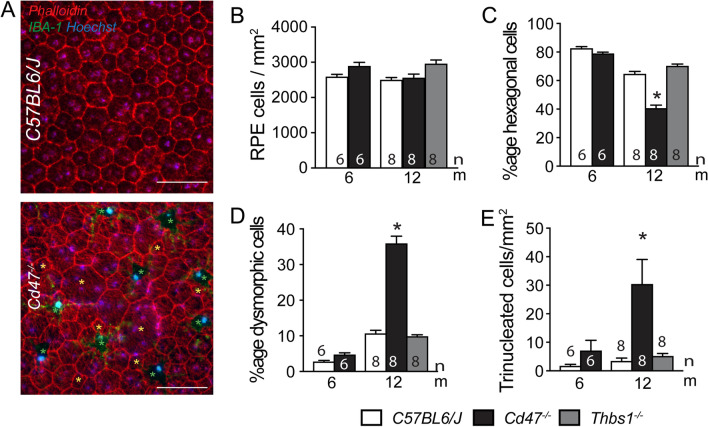
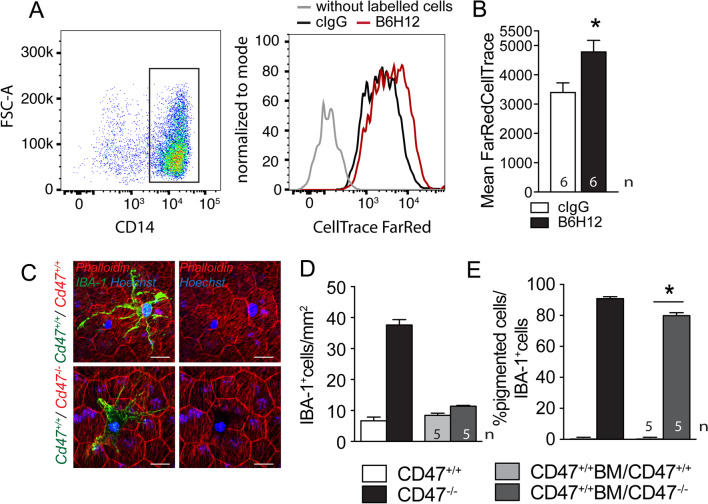
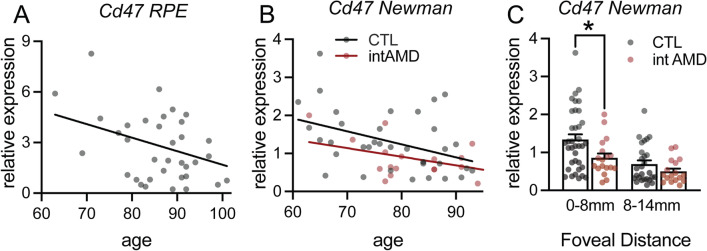
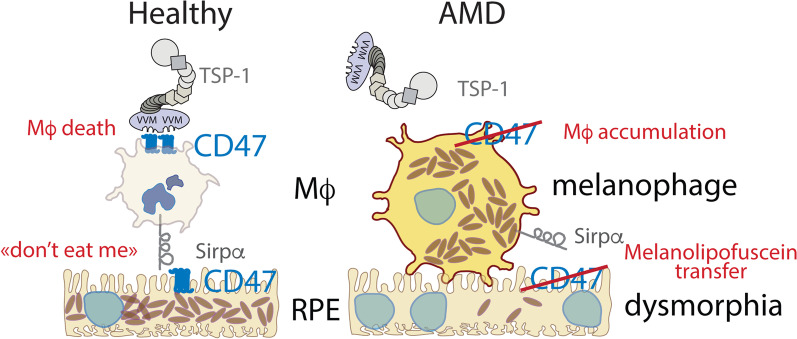
Retinal melanosome/melanolipofuscin-containing cells (MCCs), clinically visible as hyperreflective foci (HRF) and a highly predictive imaging biomarker for the progression of age-related macular degeneration (AMD), are widely believed to be migrating retinal pigment epithelial (RPE) cells. Using human donor tissue, we identify the vast majority of MCCs as melanophages, melanosome/melanolipofuscin-laden mononuclear phagocytes (MPs). Using serial block-face scanning electron microscopy, RPE flatmounts, bone marrow transplantation and in vitro experiments, we show how retinal melanophages form by the transfer of melanosomes from the RPE to subretinal MPs when the "don't eat me" signal CD47 is blocked. These melanophages give rise to hyperreflective foci in Cd47-/--mice in vivo, and are associated with RPE dysmorphia similar to intermediate AMD. Finally, we show that Cd47 expression in human RPE declines with age and in AMD, which likely participates in melanophage formation and RPE decline. Boosting CD47 expression in AMD might protect RPE cells and delay AMD progression.

Keywords: Age-related macular degeneration; CD47; Macrophage; Neuroinflammation.


Conflict of interest statement

The authors declare that they have no competing interests.

Figures

Fig. 1
Fig. 1
Intraretinal pigment in AMD is primarily located in melano-macrophages. RPE hyperreflective band (blue arrows) and hyperreflective foci (HRF, red arrows) visualized by SD-OCT of the retina of a healthy subject (A) and a patient with intermediate AMD (B). The aspect of the RPE (blue arrows) and retinal pigmented foci (red arrows) in an unstained paraffin section adjacent to the atrophic lesion of an AMD donor (C). CD68 (D), CD163 (E), IBA1 (F), RPE65 (G), peropsin (H), GFAP (I) staining in bright-field and fluorescence microscopy, of tonsils (insets C-F), healthy control retina (insets G-I) and retinal pigmented foci and adjacent RPE (C–I). The signal was revealed using Fast red chromogenic substrate visible in red in bright-field and in the red channel in fluorescence microscopy (arrows), autofluorescence was captured in the green channel and Hoechst nuclear stain in the blue channel. Immunohistochemistry experiments omitting the primary antibody served as negative controls (not shown). Calculation of the percentage of surface covered by immuno-stained retinal pigmented foci of total retinal pigmented foci for each immunostaining in each of the 12 donor eyes (J). HRF hyperreflective foci, RPE retinal pigment epithelium, INL inner nuclear lacer, ONL outer nuclear layer, scale bar = 50 µm; All values are reported as mean ± SEM
Fig. 2
Fig. 2
Subretinal pigment-laden MPs accumulate in CD47−/−mice with age but not in Thbs1−/−-mice. Representative micrographs of phalloidin (red fluorescence staining), IBA1 (green fluorescence staining) double-labeled RPE flatmounts of 12-month-old WT (A), Thbs1−/−- (B) and Cd47−/−- (C) mice. Asterixis in C represent pigment foci that block the phalloidin fluorescence. Representative bright field- (D) and fluorescence-microscopy (E) views of an anti-IBA1, Hoechst nuclear stain labeled cryo-section of a retinal pigmented focus of a 12-month-old Cd47−/−-mouse. Quantification of IBA1 stained subretinal MPs of the indicated mouse strains at the indicated ages (F); quantification at 12 months of the percentage of pigment-laden melanophages (that block the Alexa Fluor 594-phalloidin staining of the underlying RPE when viewed in the red channel) of total subretinal MPs (G) and the size of the cell body of the subretinal MP expressed as the surface they cover (H) on flatmounts (n = replicates represent quantifications of eyes from different mice of at least three different experiments and cages; one-way Anova/Kruskal–Wallis test F *p = 0,0028 6 m Cd47−/−- versus WT-mice; p = 0,0324 6 m Thbs1−/−- versus WT-mice; *p < 0,0001 12 months Cd47−/−- versus WT-mice and 12 months Thbs1−/−- versus WT-mice; *p = 0,0019 18 months Cd47−/−- versus WT-mice; p = 0,0253 18 months Thbs1−/−- versus WT-mice; G *p < 0.0001 Cd47−/−-mice versus WT- and Thbs1−/−- mice; H *p < 0.0001 Cd47−/−-mice versus WT- and Thbs1−/−- mice). Thbs1 Thrombospondin 1 gene, IBA1 ionized calcium-binding adapter molecule 1, ONL outer nuclear layer. Scale bar = 50 µm; All values are reported as mean ± SEM
Fig. 3
Fig. 3
Massive intracellular accumulation of RPE-derived melanosomes in subretinal MPs of CD47−/−-mice causes subretinal melanophage formation and their clinical appearance as hyperreflective foci. Representative sections (AC and EG) and 3D reconstructions (D and F) of serial block-face scanning electron microscopy (SBF-SEM) of 12-month-old Thbs1−/−- (AD), and Cd47−/−-mice (EH). Nuclei are indicated by asterixis, round orthogonally cut and spindle shaped longitudinally cut electron-dense melanosomes are indicated by magenta (in MPs) and blue (in RPE) arrows; melanolipofuscin by white arrows. The border of the subretinal MP (green color), and the surface of each melanosome (magenta) were marked on every SBF-SEM section containing the MPs (C and G) for the three-dimensional reconstruction of melanosome and melanolipofuscin particle distribution in the subretinal MPs (D and H and Additional file 1: Movie S1 and Additional file 2: Movie S2; other organelles were marked in white). Representative transmission bright light micrographs of RPE/retinal flatmounts, in which the RPE was kept adherent to the retina of 12-month-old mice of the indicated strains (IK). Representative spectral-domain optic coherence tomography images of 12-month-old mice of the indicated strains (LN). Blue arrows indicate the RPE hyperreflective line and red arrows indicate retinal hyperreflective lesions. Thbs1 thrombospondin 1 gene, OS outer segments of photoreceptors, RPE retinal pigment epithelium. Scale bar = 2 µm
Fig. 4
Fig. 4
Melanophage accumulation in CD47−/−mice is associated with RPE dysmorphia. Representative micrographs of phalloidin (red fluorescence staining), IBA1 (green fluorescence staining) double-labeled RPE/choroidal flatmounts of 12-month-old WT- and Cd47−/−-mice (A). Green asterixis in indicate melanophages, yellow asterixis indicate dysmorphic RPE cells with less than five or more than six neighbors/sides. Quantification on RPE/choroidal flatmounts of the indicated mouse strains at the indicated ages of RPE cell density (B), percentage of hexagonal (C), and dysmorphic RPE cells (D), and density of trinucleated RPE cells (n = replicates represent quantifications of eyes from different mice of at least three different experiments and cages; one-way Anova/Kruskal–Wallis test C *p = 0,036 and 0,0004, D *p = 0,0041 and 0,0033, and E *p < 0.0001 and = 0,9214 12-month-old Cd47−/−- versus WT- and Thbs1−/−-mice, respectively). Thbs1 thrombospondin 1 gene, IBA1 ionized calcium-binding adapter molecule 1; Scale bar = 50 µm
Fig. 5
Fig. 5
CD47-deficient RPE cells lose melanosomes/melanolipofuscin to melanophages. Gating and FarRed CellTrace intensity measurements by cytometry of human CD14 + Mo after 2 h of incubation with a monolayer of FarRed CellTrace pre-stained ARPE19 cells (a human RPE cell line) with 10 µg/ml of a control antibody (black line) or CD47 blocking antibody B6H12 (red line A) and quantification of the fluorescence intensity (B; n = 6 wells per group from three independent experiments; Mann–Whitney p = 0.0221). Three independent experiments gave similar results. Representative micrographs of phalloidin (red fluorescence staining), IBA1 (green fluorescence staining) double-labeled RPE/choroidal flatmounts of 12-month-old Cd47+/+ (upper panel) or Cd47−/−- recipient mice (lower panel) that had received a Cd47+/+- bone marrow transplant after lethal irradiation at 6 months of age (C). Quantification of the number of IBA1-stained subretinal MPs (D) and quantification of the percentage of pigment-laden melanophages (that block the phalloidin staining of the underlying RPE) of total subretinal MPs (E) of 12-month-old WT and Cd47−/−-mice compared with Cd47+/+ bone marrow transplanted WT and Cd47−/−-mice (n = 5/group; Mann–Whitney p = 0.00,159). Scale bar = 20 µm
Fig. 6
Fig. 6
RPE CD47-expression decreases with age and in intermediate AMD in humans. A Linear regression of the correlation of age to relative expression of Cd47 mRNA normalized with RPS26 expression in RPE mRNA preparations from 35 subjects older than 60 years determined by quantitative RT-PCR. The subjects had normal post-mortem fundus appearance and no known history of AMD or other retinal diseases (p = 0.0261 deviant from zero). B Linear regression of the correlation of age of Cd47 mRNA normalized with the average of 40 RPE gene expression in RPE/choroid mRNA preparations from control subjects (CTL n = 36; p = 0.0156 deviant from zero) and intermediate AMD patients (intAMD n = 18; p = 0.0704 deviant from zero) from the RPE/choroid transcription data set of [23]. C Cd47 mRNA normalized with the average of 40 RPE gene expression in RPE/choroid mRNA preparations from CTL subjects and intAMD patients in central (0-8 mm foveal distance) and peripheral (8–14 mm foveal distance) from the RPE/choroid transcription data set of [23] (*Mann–Whitney p = 0.0217)
Fig. 7
Fig. 7
Graphical summary of subretinal melanophage formation in AMD

References

    1. Wong WL, Su X, Li X, Cheung CM, Klein R, Cheng CY, Wong TY. Global prevalence of age-related macular degeneration and disease burden projection for 2020 and 2040: a systematic review and meta-analysis. Lancet Glob Health. 2014;2:e106–116. - PubMed
    1. Fleckenstein M, Keenan TDL, Guymer RH, Chakravarthy U, Schmitz-Valckenberg S, Klaver CC, Wong WT, Chew EY. Age-related macular degeneration. Nat Rev Dis Primers. 2021;7:31. - PubMed
    1. Guillonneau X, Eandi CM, Paques M, Sahel JA, Sapieha P, Sennlaub F. On phagocytes and macular degeneration. Prog Retin Eye Res. 2017;61:98–128. - PubMed
    1. Klein R, Peto T, Bird A, Vannewkirk MR. The epidemiology of age-related macular degeneration. Am J Ophthalmol. 2004;137:486–495. - PubMed
    1. Wang JJ, Foran S, Smith W, Mitchell P. Risk of age-related macular degeneration in eyes with macular drusen or hyperpigmentation: the Blue Mountains Eye Study cohort. Arch Ophthalmol. 2003;121:658–663. - PubMed

LinkOut - more resources