. 2023 Jan 23:14:1071694.
doi: 10.3389/fgene.2023.1071694. eCollection 2023.

Cuproptosis-related gene FDX1 as a prognostic biomarker for kidney renal clear cell carcinoma correlates with immune checkpoints and immune cell infiltration

Affiliations

Cuproptosis-related gene FDX1 as a prognostic biomarker for kidney renal clear cell carcinoma correlates with immune checkpoints and immune cell infiltration

Yimin Yao et al. Front Genet. .

Abstract

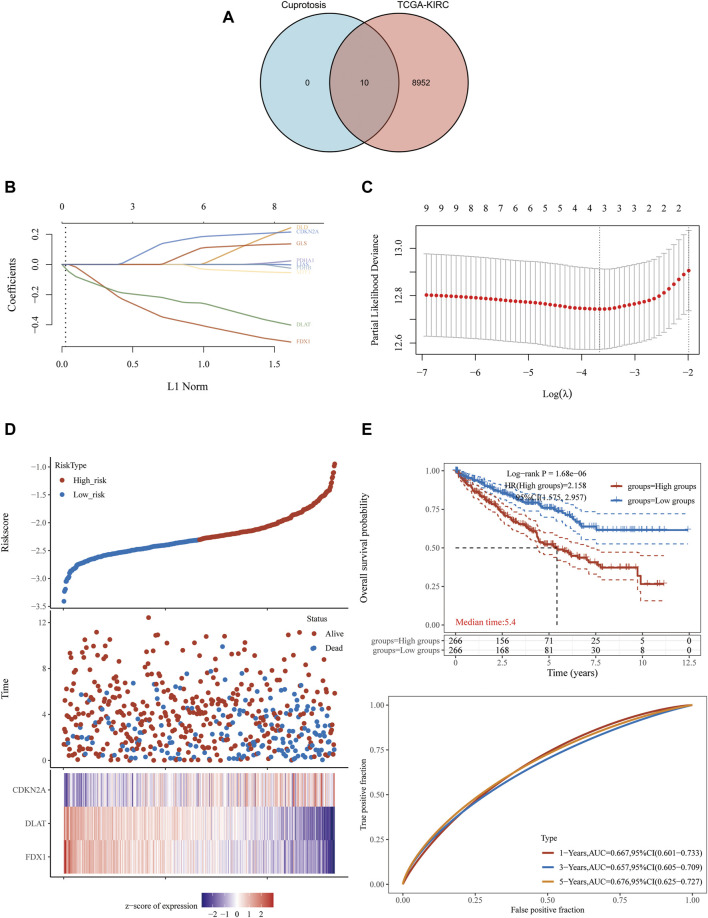
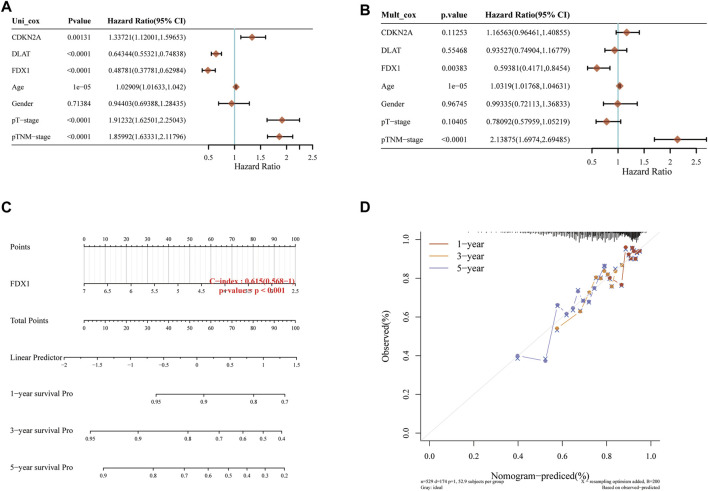
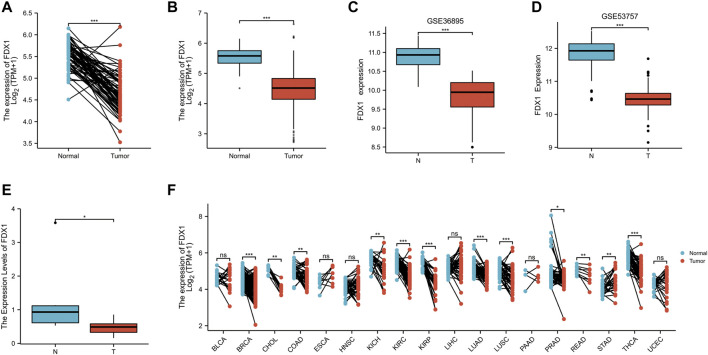
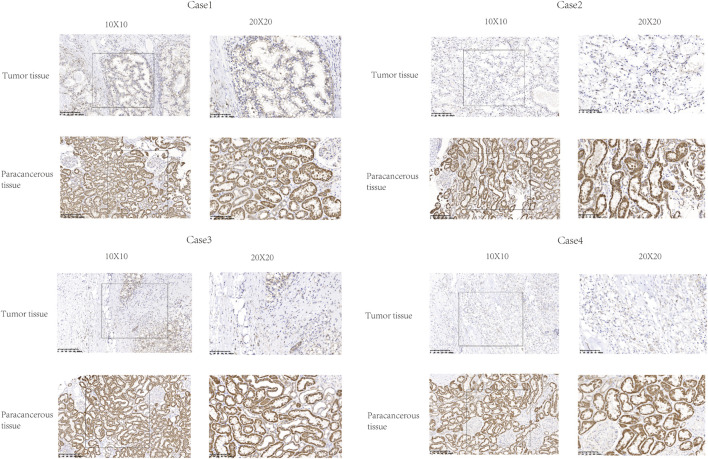
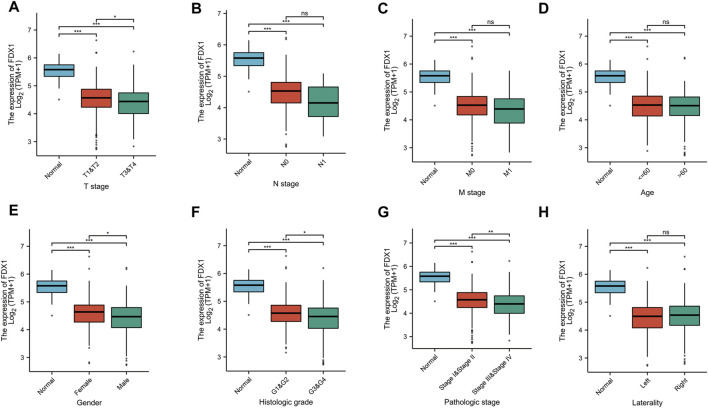
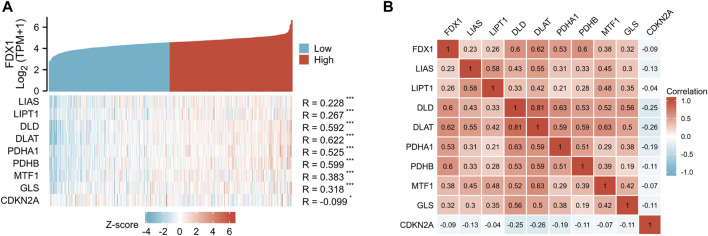
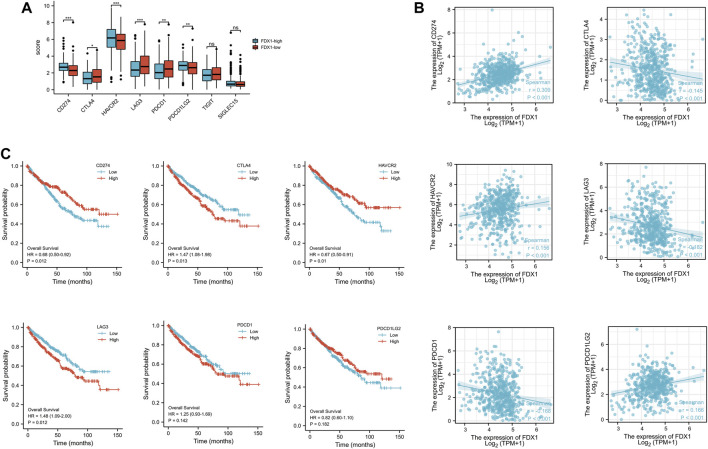
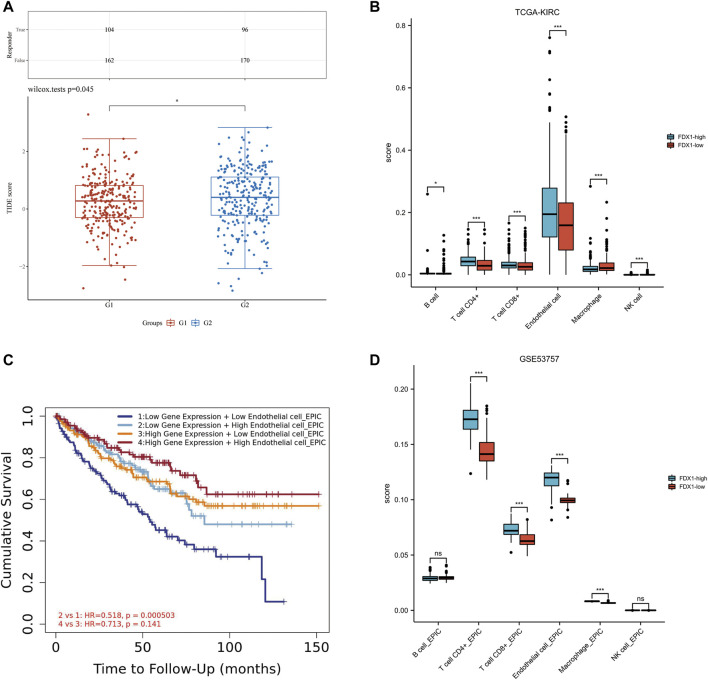
Background: Kidney renal clear cell carcinoma (KIRC) is not sensitive to radiotherapy and chemotherapy, and only some KIRC patients can benefit from immunotherapy and targeted therapy. Cuproptosis is a new mechanism of cell death, which is closely related to tumor progression, prognosis and immunity. The identification of prognostic markers related to cuproptosis in KIRC may provide targets for treatment and improve the prognosis of KIRC patients. Methods: Ten cuproptosis-related genes were analyzed for differential expression in KIRC-TCGA and a prognostic model was constructed. Nomogram diagnostic model was used to screen independent prognostic molecules. The screened molecules were verified in multiple datasets (GSE36895 and GSE53757), and in KIRC tumor tissues by RT-PCR and immunohistochemistry (IHC). Clinical correlation of cuproptosis-related independent prognostic molecules was analyzed. According to the molecular expression, the two groups were divided into high and low expression groups, and the differences of immune checkpoint and tumor infiltrating lymphocytes (TILs) between the two groups were compared by EPIC algorithm. The potential Immune checkpoint blocking (ICB) response of high and low expression groups was predicted by the "TIDE" algorithm. Results: FDX1 and DLAT were protective factors, while CDKN2A was a risk factor. FDX1 was an independent prognostic molecule by Nomogram, and low expressed in tumor tissues compared with adjacent tissues (p < 0.05). FDX1 was positively correlated with CD274, HAVCR2, PDCD1LG2, and negatively correlated with CTLA4, LAG3, and PDCD1. The TIDE score of low-FDX1 group was higher than that of high-FDX1 group. The abundance of CD4+ T cells, CD8+ T cells and Endothelial cells in FDX1-low group was lower than that in FDX1-high group (p < 0.05). Conclusion: FDX1, as a key cuproptosis-related gene, was also an independent prognostic molecule of KIRC. FDX1 might become an interesting biomarker and potential therapeutic target for KIRC.

Keywords: cuproptosis-related gene; fdx1; immune cell infiltration; immune checkpoints; kidney renal clear cell carcinoma; prognostic biomarker.


Conflict of interest statement

The authors declare that the research was conducted in the absence of any commercial or financial relationships that could be construed as a potential conflict of interest.

Figures

FIGURE 1
FIGURE 1
FDX1, DLAT and CDKN2A cuproptosis-related genes prognostic model. (A) 8,962 potential prognostic molecules of KIRC and 10 cuproptosis-related genes Venn diagram. (B) LASSO variable trajectory diagram. (C) LASSO coefficient screening diagram. (D) The prognostic risk factor graph, red represents high-risk group, blue represents low-risk group. (E) Kaplan-Meier survival curve and time dependent ROC.
FIGURE 2
FIGURE 2
Independent prognostic molecules associated with cuproptosis. (A) Univariate Cox analysis of cuproptosis-related genes. (B) Multivariate Cox analysis of cuproptosis-related genes. (C) one, two and three-year overall survival of KIRC patients were predicted by Nomogram. (D) Calibration curve of the overall survival Nomogram model in the discovery group.
FIGURE 3
FIGURE 3
The expression difference of FDX1 in KIRC. (A) Differential expression of FDX1 in paired samples in TCGA-KIRC database. (B) Differential expression of FDX1 in unpaired samples in TCGA-KIRC database. (C) Differential expression of FDX1 in GSE36895. (D) Differential expression of FDX1 in GSE53757. (E) Differential expression of FDX1 between KIRC patients and normal renal tissue by RT-qPCR. (F) Differential expression of FDX1 in TCGA pan cancer. NS, p > .05; *, p < .05; **, p < .01; ***, p < .001.
FIGURE 4
FIGURE 4
Representative images of FDX1 expression in KIRC tissues and their matched paracancerous tissues. Original magnifications ×100 and 400× (inset panels).
FIGURE 5
FIGURE 5
The correlation between FDX1 and clinical characteristics in KIRC. (A) The correlation between FDX1 and T stage. (B) The correlation between FDX1 and N stage. (C) The correlation between FDX1 and M stage. (D) The correlation between FDX1 and Age. (E) The correlation between FDX1 and Gender. (F) The correlation between FDX1 and Histologic grade. (G) The correlation between FDX1 and Pathologic stage. (H) The correlation between FDX1 and Laterality. NS, p > .05; *, p < .05; **, p < .01; ***, p < .001.
FIGURE 6
FIGURE 6
Correlation between FDX1 and other nine cuproptosis genes. (A) FDX1 and other nine cuproptosis-related molecules co-expression heatmap. (B) 10 cuproptosis-related genes correlation heatmap.
FIGURE 7
FIGURE 7
The expression and the prognosis analysis of immune checkpoints. (A) Expression of immune checkpoint in high and low expression groups of FDX1. (B) Scatter plot of immune checkpoint association with FDX1. (C) Overall survival curve of immune checkpoints in KIRC patients.
FIGURE 8
FIGURE 8
Relationship among FDX1 expression, ICB and immune cell infiltration in KIRC. (A) Distribution of immune response scores in high and low expression groups of FDX1. (B) The abundance of immune cell infiltration in FDX1-low group and FDX1-high group in TCGA-KIRC. (C) The Kaplan-Meier curve of Endothelial cells in KIRC. G1 group represented FDX1-high group, G2 group represented FDX1-low group. (D) The abundance of immune cell infiltration in FDX1-low group and FDX1-high group in GSE53757.

Similar articles

Cited by

References

    1. Alsaab H. O., Sau S., Alzhrani R. M., Cheriyan V. T., Polin L. A., Vaishampayan U., et al. (2018). Tumor hypoxia directed multimodal nanotherapy for overcoming drug resistance in renal cell carcinoma and reprogramming macrophages. Biomaterials 183, 280–294. 10.1016/j.biomaterials.2018.08.053 - DOI - PMC - PubMed
    1. Bao J. H., Lu W. C., Duan H., Ye Y. Q., Li J. B., Liao W. T., et al. (2022). Identification of a novel cuproptosis-related gene signature and integrative analyses in patients with lower-grade gliomas. Front. Immunol. 13, 933973. 10.3389/fimmu.2022.933973 - DOI - PMC - PubMed
    1. Bian Z., Fan R., Xie L. (2022). A novel cuproptosis-related prognostic gene signature and validation of differential expression in clear cell renal cell carcinoma. Genes (Basel) 13 (5), 851. 10.3390/genes13050851 - DOI - PMC - PubMed
    1. Clark D. J., Dhanasekaran S. M., Petralia F., Pan J., Song X., Hu Y., et al. (2019). Integrated proteogenomic characterization of clear cell renal cell carcinoma. Cell 179 (4), 964–983.e31. e931. 10.1016/j.cell.2019.10.007 - DOI - PMC - PubMed
    1. da Silva D. A., De Luca A., Squitti R., Rongioletti M., Rossi L., Machado C. M. L., et al. (2022). Copper in tumors and the use of copper-based compounds in cancer treatment. J. Inorg. Biochem. 226, 111634. 10.1016/j.jinorgbio.2021.111634 - DOI - PubMed