

Temporal trends in prevalence and mortality for chronic kidney disease in China from 1990 to 2019: an analysis of the Global Burden of Disease Study 2019
- PMID: 36755850
- PMCID: PMC9900593
- DOI: 10.1093/ckj/sfac218
Temporal trends in prevalence and mortality for chronic kidney disease in China from 1990 to 2019: an analysis of the Global Burden of Disease Study 2019
Abstract
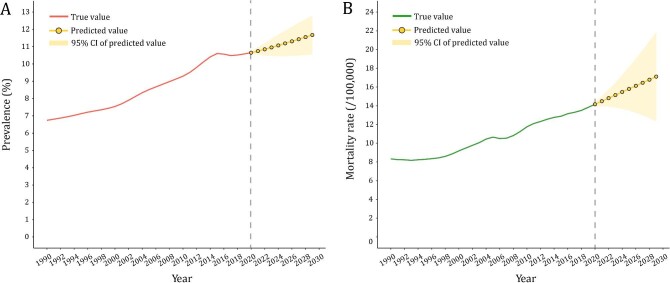
Background: This study aimed to characterize the temporal trends of chronic kidney disease (CKD) burden in China during 1990-2019, evaluate their age, period and cohort effects, and predict the disease burden for the next 10 years.
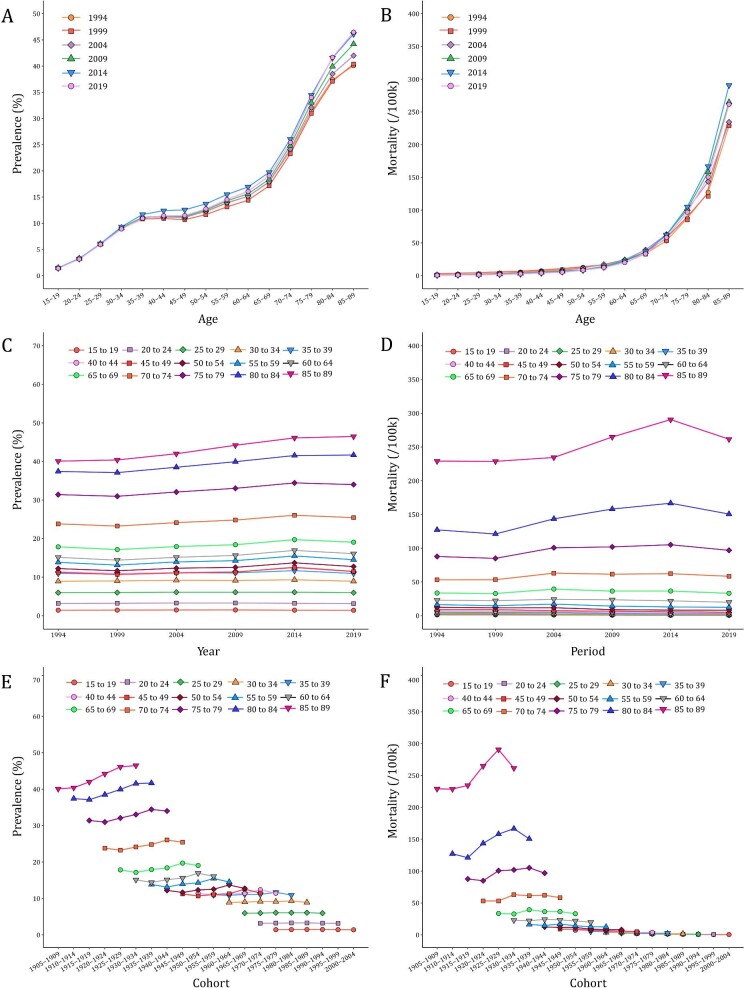
Methods: Data were obtained from the Global Burden of Disease (GBD) 2019 study. Join-point regression model was used to estimate the average annual percentage change (AAPC) of CKD prevalence and mortality, and the age-period-cohort analysis was used to estimate the age, period and cohort effects. We extended the autoregressive integrated moving average (ARIMA) model to predict the disease burden of CKD in 2020-2029.
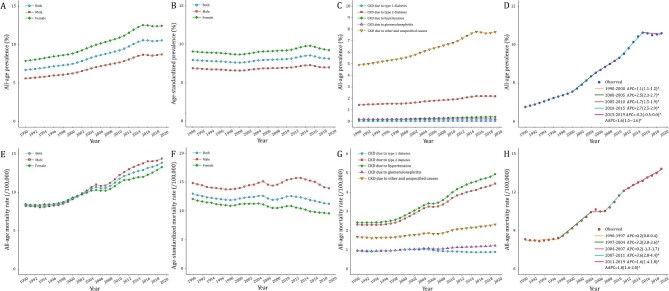
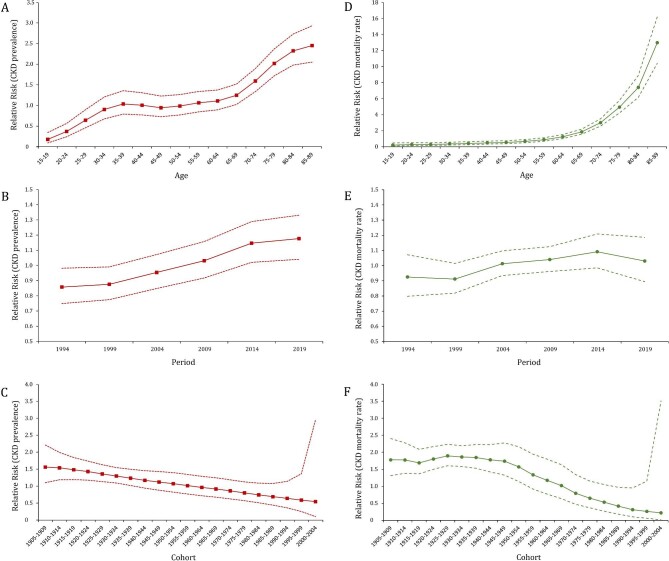
Results: In 2019, there were 150.5 million cases of (10.6%) and 196 726 deaths from (13.8 per 100 000 general population) CKD in China. Between 1990 and 2019, the prevalence and mortality rate of CKD increased significantly from 6.7% to 10.6%, and from 8.3/100 000 to 13.8/100 000. The AAPC was estimated as 1.6% and 1.8%, respectively. Females had a higher CKD prevalence of CKD but a lower mortality rate. Setting the mean level of age, period and cohort as reference groups, the risk of developing CKD increased with age [RRage(15-19) = 0.18 to RRage(85-89) = 2.45]. The cohort risk was significantly higher in the early birth cohort [RRcohort(1905-1909) = 1.56]. In contrast, the increase in age-specific CKD mortality rate after 60-64 years was exponential [RRage(60-64) = 1.24]. The cohort-based mortality risk remained high prior to the 1945-1949 birth cohorts (RRcohort ranging from 1.69 to 1.89) and then declined in the 2000-2004 birth cohort [RRcohort(2000-2004) = 0.22]. The CKD prevalence and mortality are projected to rise to 11.7% and 17.1 per 100 000, respectively, by 2029.
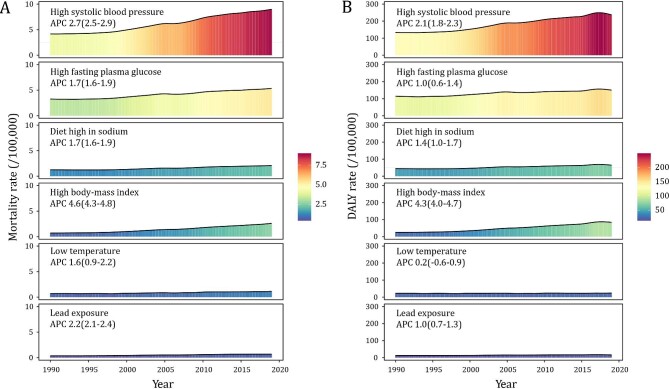
Conclusions: To reduce the disease burden of CKD, a comprehensive strategy that includes risk factors prevention at the primary care level, CKD screening among the elderly and high-risk population, and access to high-quality medical services is required.
Keywords: ARIMA model; age-period-cohort analysis; chronic kidney disease; disease burden; join-point regression.
© The Author(s) 2022. Published by Oxford University Press on behalf of the ERA.
Figures
References
-
- Institute for Health Metrics and Evaluation . 2019 Global Burden of Disease (GBD). http://ghdx.healthdata.org/gbd-results-tool (16 March 2022, date last accessed).
-
- Levin A, Stevens P, Bilous RWet al. Kidney disease: improving global outcomes (KDIGO) CKD work group. KDIGO 2012 clinical practice guideline for the evaluation and management of chronic kidney disease. Kidney Int Suppl 2013;3:1–150.
LinkOut - more resources
Full Text Sources
