. 2023 Feb 1;10(2):221363.
doi: 10.1098/rsos.221363. eCollection 2023 Feb.

Rising temperature drives tipping points in mutualistic networks

Affiliations

Rising temperature drives tipping points in mutualistic networks

Subhendu Bhandary et al. R Soc Open Sci. .

Abstract

The effect of climate warming on species' physiological parameters, including growth rate, mortality rate and handling time, is well established from empirical data. However, with an alarming rise in global temperature more than ever, predicting the interactive influence of these changes on mutualistic communities remains uncertain. Using 139 real plant-pollinator networks sampled across the globe and a modelling approach, we study the impact of species' individual thermal responses on mutualistic communities. We show that at low mutualistic strength plant-pollinator networks are at potential risk of rapid transitions at higher temperatures. Evidently, generalist species play a critical role in guiding tipping points in mutualistic networks. Further, we derive stability criteria for the networks in a range of temperatures using a two-dimensional reduced model. We identify network structures that can ascertain the delay of a community collapse. Until the end of this century, on account of increasing climate warming many real mutualistic networks are likely to be under the threat of sudden collapse, and we frame strategies to mitigate this. Together, our results indicate that knowing individual species' thermal responses and network structure can improve predictions for communities facing rapid transitions.

Keywords: climate warming; community collapse; ecological networks; mutualistic communities; tipping points.


Conflict of interest statement

We declare we have no competing interests.

Figures

Figure 1.
Figure 1.
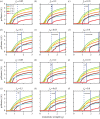
Higher temperatures can trigger catastrophic transitions at different interaction strengths (γ0): (ac) On increasing the temperature in the range 0–40°C, for γ0 = 0.5 to γ0 = 1, the abundance of pollinators encounters catastrophic transitions. (df) At or beyond γ0 = 1.5, sudden community collapse is averted, although there is a gradual drop in population abundance with increasing temperature. The blue vertical line marks the occurrence of a critical transition. Each line in the sub-figures represents the abundance of each pollinator species in the network. The aforementioned result is obtained for network M_PL_006 with SA = 61 and SP = 17 (for details, http://www.web-of-life.es/). The taxonomic details of the aforementioned network are presented in electronic supplementary material, appendix, §S1, table S1.2. The parameter values are βiiA=βiiP=1, δ = 0.5, μA = μP = 10−4 and the other parameters αiA, αiP, ki and h are obtained from their respective response function (unless stated, the network used and these values are the same in the rest of the figures).
Figure 2.
Figure 2.
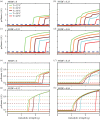
Catastrophic collapse in mutualistic networks for variation in mutualistic strength (γ0): (a,b) On decreasing the mutualistic strength γ0 in the range 3–0 (red), at low to moderate temperature until 20°C, the abundance of pollinators encounters a non-catastrophic transition. On increasing γ0 in the range 0–3, the system recovers to its previous state. (c) At 20°C, community collapse is averted, although there is a drop in abundance at low γ0 values. (df) As the temperature is further increased, a gradual shift transforms into a rapid collapse at a low γ0 value. As γ0 increases, striving to recover species (in the forward direction 0–3 (in blue)), a hysteresis loop formation is observed, and the width of this loop increases with an increase in warming. At very high temperature (40°C), the system does not recover. Results for other networks are presented in electronic supplementary material, appendix, §S1, figure S1.2.
Figure 3.
Figure 3.
The role of network structure under varied degrees of warming in delaying the occurrence of a tipping point: (a) First point collapse of pollinators for 139 real plant–pollinator networks. At higher temperatures, nested networks undergo collapse at a considerably lower γ0 value (which marks the tipping point). (b) Final point collapse of the networks. The colours in the colour bar correspond to the γ0 values in the range 0–3, at which the system undergoes a first (a) and final (b) point collapse. Correlation between (c) connectance and nestedness, and (d) modularity and nestedness of 139 real networks is found. The results are averaged over 100 independent simulations.
Figure 4.
Figure 4.
Effects of plant and pollinator loss for varied temperature regimes: the decline in average abundance of the pollinator community as a fraction of plants (fP) (af) and pollinators (fA) (gl) are removed in decreasing order of their degree at temperatures ranging over the interval 0–40°C (denoted by different colours in the legend). As γ0 decreases from 3 to 0, the point of collapse advances as fP and fA are increased further. Plant loss has a more prominent effect on the collapse of the pollinator community, as indicated by the distance between the dashed and solid vertical lines for respective fP and fA values. A large difference is observed in tipping points at high temperature (40°C) for increases in fP = 0.8 and fA = 0.8. The dashed lines in (al) represent the point of collapse for fP = fA = 0.05 at 40°C. The solid lines in (bf) and (hl) represent the point of collapse for different values of fP and fA at 40°C, as mentioned above each sub-figure. 〈A〉 denotes the average abundance of pollinator species.
Figure 5.
Figure 5.
Stable and unstable steady states of the reduced model. (a) The stable (blue) and unstable (peach) steady-state surfaces obtained from the reduced model. The ensemble pollinator abundance is plotted as a function of γ0 in the temperature range 0–40°C. The 2D projections of the above stable and unstable surfaces depict the stable (b) and unstable (c) regions at different temperatures. In both the sub-figures, the colour in the colourbar denotes the abundance of the steady states (stable and unstable). SSS and USS denote stable and unstable steady states, respectively.
Figure 6.
Figure 6.
Effect of temperature and network structure on the eigenvalue of the SSS: (af) the eigenvalue of the Jacobian matrix corresponding to the non-trivial steady state plotted against the nestedness value for all 139 plant–pollinator networks for a fixed γ0 mentioned earlier in each panel. Each dot represents a network, with the colour denoting the respective temperature. The system is always more stable at optimum temperature; stability at higher temperature increases by increasing γ0, although the critical eigenvalue saturates at γ0 = 2 and does not increase further.
Figure 7.
Figure 7.
The role of network structure in managing tippings in mutualistic networks: (ad) abundance management in four different networks in increasing order of nestedness (NODF). The dashed line (blue) denotes the fixed abundance of the generalist species as a management strategy, and the solid line (maroon) denotes the average abundance of species in the absence of management strategy at and beyond 32°C. The average abundance of the community is plotted at various temperatures above 32°C. Systems with higher nestedness experience early recovery for all temperatures in the range 32–40°C. At 40°C, network A (NODF = 0) fails to recover with the generalist species' abundance fixed at 0.2, while networks B (NODF = 0.25), C (NODF = 0.52) and D (NODF = 0.84) recover. Network D undergoes the fastest recovery. (eh) The dashed lines denote the abundance of the generalist species fixed at abundances of 0.1, 0.3, 0.5, 0.7 and 0.9, and the recovery of the community at 40°C is correspondingly plotted in the same colour with a dashed line. The solid line (maroon) represents the average abundance of realized networks without any control. At 40°C, network A (NODF=0) fails to recover with the generalist species' abundance fixed at 0.3 or less, while networks B (NODF=0.25) and C (NODF = 0.52) do not recover with the generalist species' abundance fixed at 0.1 or less. But network D (NODF = 0.84) recovers with the generalist species' abundance fixed at any value greater than or equal to 0.1. We observe fixed threshold abundances of the generalist pollinator at 40°C for networks A, B, C and D, which aid in the system’s recovery.
Figure 8.
Figure 8.
Managing tipping by minimizing the decay rate of the generalist species: at various temperatures above 32°C, the death rate of the generalist species for networks A, B, C and D is set at 0.01. The solid horizontal lines (maroon) represent species' abundance in the absence of a management strategy. For network A (NODF = 0), recovery is considerably delayed at the extreme temperature (40°C).

Similar articles

References

    1. Post E. 2013. Ecology of climate change: the importance of biotic interactions, vol. 68. Princeton, NJ: Princeton University Press.
    1. Fussmann KE, Schwarzmüller F, Brose U, Jousset A, Rall BC. 2014. Ecological stability in response to warming. Nat. Clim. Change 4, 206-210. (10.1038/nclimate2134) - DOI
    1. Malhi Y, Franklin J, Seddon N, Solan M, Turner MG, Field CB, Knowlton N. 2020. Climate change and ecosystems: threats, opportunities and solutions. Phil. Trans. R. Soc. B 375, 20190104. (10.1098/rstb.2019.0104) - DOI - PMC - PubMed
    1. Parmesan C, Yohe G. 2003. A globally coherent fingerprint of climate change impacts across natural systems. Nature 421, 37-42. (10.1038/nature01286) - DOI - PubMed
    1. Trisos CH, Merow C, Pigot AL. 2020. The projected timing of abrupt ecological disruption from climate change. Nature 580, 496-501. (10.1038/s41586-020-2189-9) - DOI - PubMed

LinkOut - more resources