. 2023 Feb 1;10(2):220360.
doi: 10.1098/rsos.220360. eCollection 2023 Feb.

Unsupervised machine learning discovers classes in aluminium alloys

Affiliations

Unsupervised machine learning discovers classes in aluminium alloys

Ninad Bhat et al. R Soc Open Sci. .

Abstract

Aluminium (Al) alloys are critical to many applications. Although Al alloys have been commercially widespread for over a century, their development has predominantly taken a trial-and-error approach. Furthermore, many discrete studies regarding Al alloys, often application specific, have precluded a broader consolidation of Al alloy classification. Iterative label spreading (ILS), an unsupervised machine learning approach, was used to identify the different classes of Al alloys, drawing from a specifically curated dataset of 1154 Al alloys (including alloy composition and processing conditions). Using ILS, eight classes of Al alloys were identified based on a comprehensive feature set under two descriptors. Further, a decision tree classifier was used to validate the separation of classes.

Keywords: alloy design; aluminium; aluminium alloys; machine learning; mechanical properties; unsupervised learning.


Conflict of interest statement

The authors declare that they have no known competing financial interests or personal relationships that could have appeared to influence the work reported in this paper.

Figures

Figure 1.
Figure 1.
Ordered label versus Rmin plot for Al-alloy dataset using ILS clustering. The red crosses denote the peak found using continuous wavelet transform peak finding algorithm.
Figure 2.
Figure 2.
Minimum distance Rmin versus ordered label after the second pass of ILS clustering for 1154 Al alloys. Each colour denotes a cluster associated with the initially labelled points.
Figure 3.
Figure 3.
Order-labelled Rmin plot for Cluster 2. (a) The first pass identifying three peaks proving the existence of sub-clusters. The red crosses denote the location of the three peaks identified. (b) Second pass of ILS clustering identifying the three sub-clusters.
Figure 4.
Figure 4.
t-SNE map of 34-dimensional Al-alloy dataset encoded with ILS clustering labels. (a) t-SNE plot showing initial clustering results, (b) t-SNE plot with final labels after running ILS of each cluster.
Figure 5.
Figure 5.
Confusion matrix showing true positive, true negative, false positive and false negative of DTC classes.
Figure 6.
Figure 6.
Learning curve for DTC showing high accuracy with limited training instances.
Figure 7.
Figure 7.
Decision tree trained on all features showing separation of eight classes. The decision tree shows gini impurity and dominant class at each node.
Figure 8.
Figure 8.
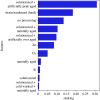
FIP of DTC showing the high importance of processing conditions in determining the class of Al alloys. FIP also shows that a small subset of features entirely determines classes.
Figure 9.
Figure 9.
Recursive feature elimination to find the ideal number of features. A high cross-validation score can be achieved by only using 11 features.
Figure 10.
Figure 10.
t-SNE plot encoded with features. (a) Encoded with highest importance concentration feature (Zn), (b) encoded with highest importance processing condition (solutionized + artificially over aged).
Figure 11.
Figure 11.
Range of mechanical properties for each ILS class. (a) Tensile strength (MPa), (b) yield strength (MPa) and (c) elongation (%).
Figure 12.
Figure 12.
Mechanical property variation with the second-phase concentration. (a) Tensile strength versus wt fraction second phase, (b) yield strength versus wt fraction second phase, (c) elongation versus wt fraction second phase.

References

    1. Dixon MF, Halperin I, Bilokon P. 2020. Machine learning in finance. Berlin, Germany: Springer.
    1. Wiens J, Shenoy ES. 2018. Machine learning for healthcare: on the verge of a major shift in healthcare epidemiology. Clin. Infect. Dis. 66, 149-153. (10.1093/cid/cix731) - DOI - PMC - PubMed
    1. Cramer S, Kampouridis M, Freitas AA, Alexandridis AK. 2017. An extensive evaluation of seven machine learning methods for rainfall prediction in weather derivatives. Expert Syst. Appl. 85, 169-181. (10.1016/j.eswa.2017.05.029) - DOI
    1. Sommer C, Gerlich DW. 2013. Machine learning in cell biology – teaching computers to recognize phenotypes. J. Cell Sci. 126, 5529-5539. (10.1242/jcs.123604) - DOI - PubMed
    1. Held M, Schmitz MHA, Fischer B, Walter T, Neumann B, Olma MH, Peter M, Ellenberg J, Gerlich DW. 2010. CellCognition: time-resolved phenotype annotation in high-throughput live cell imaging. Nat. Methods 7, 747-754. (10.1038/nmeth.1486) - DOI - PubMed

LinkOut - more resources