. 2022 Nov 28;5(1):e24-e35.
doi: 10.1016/S2665-9913(22)00332-0. eCollection 2023 Jan.

Identification of biomarkers to stratify response to B-cell-targeted therapies in systemic lupus erythematosus: an exploratory analysis of a randomised controlled trial

Affiliations

Identification of biomarkers to stratify response to B-cell-targeted therapies in systemic lupus erythematosus: an exploratory analysis of a randomised controlled trial

Muhammad Shipa et al. Lancet Rheumatol. .

Abstract

Background: Systemic lupus erythematosus (SLE) is a complex autoimmune disease associated with widespread immune dysregulation and diverse clinical features. Immune abnormalities might be differentially associated with specific organ involvement or response to targeted therapies. We aimed to identify biomarkers of response to belimumab after rituximab to facilitate a personalised approach to therapy.

Methods: In this exploratory analysis of a randomised controlled trial (BEAT-LUPUS), we investigated immune profiles of patients with SLE recruited to the 52-week clinical trial, which tested the combination of rituximab plus belimumab versus rituximab plus placebo. We used machine learning and conventional statistics to investigate relevant laboratory and clinical biomarkers associated with major clinical response. BEAT LUPUS is registered at ISRCTN, 47873003, and is now complete.

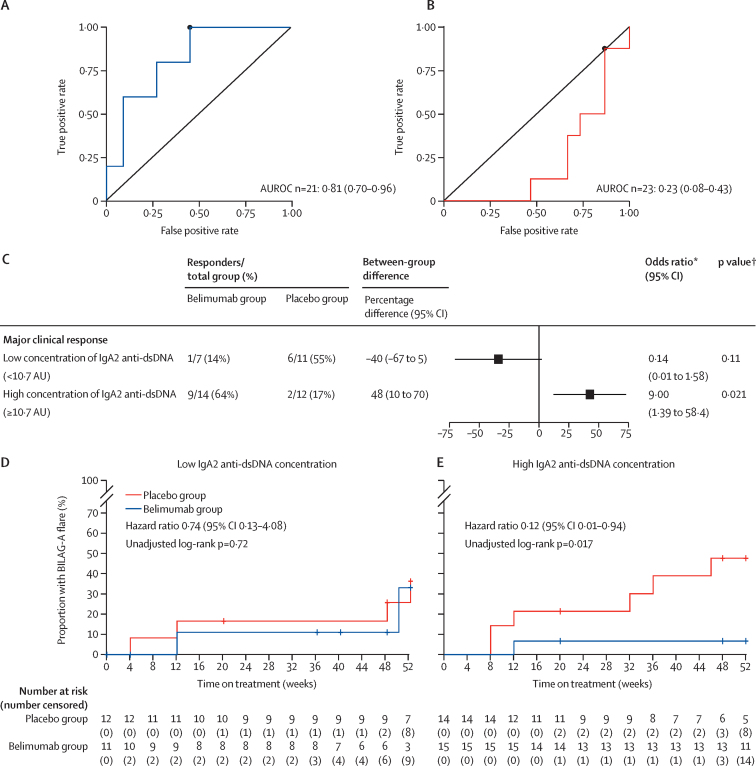
Findings: Between Feb 2, 2017, and March 28, 2019, 52 patients were recruited to BEAT-LUPUS, of whom 44 provided clinical data at week 52 and were included in this analysis. 21 (48%) of 44 participants were in the belimumab group (mean age 39·5 years [SD 12·1]; 17 [81%] were female, four [19%] were male, 13 [62%] were White) and 23 (52%) were in the placebo group (mean age 42·1 years [SD 10·5]; 21 [91%] were female, two [9%] were male, 16 [70%] were White). Ten (48%) of 21 participants who received belimumab after rituximab and eight (35%) of 23 who received placebo after rituximab had a major clinical response at 52 weeks (between-group difference of 13% [95% CI -15 to 38]). We found a predictive association between baseline serum IgA2 anti-double stranded DNA (dsDNA) antibody concentrations and clinical response to belimumab after rituximab, with a between-group difference in major clinical response of 48% (95% CI 10 to 70) in patients with elevated baseline serum IgA2 anti-dsDNA antibody concentrations. Moreover, among those who had a major clinical response, serum IgA2 anti-dsDNA antibody concentrations significantly decreased from baseline only in the belimumab group. Increased circulating IgA2 (but not total) plasmablast numbers, and T follicular helper cell numbers predicted clinical response and were both reduced only in patients who responded to belimumab after rituximab. Serum IgA2 anti-dsDNA antibody concentrations were also associated with active renal disease, whereas serum IgA1 anti-dsDNA antibody and IFN-α concentrations were associated with mucocutaneous disease activity but did not predict response to B-cell targeted therapy. Patients with a high baseline serum interleukin-6 concentration were less likely to have a major clinical response, irrespective of therapy.

Interpretation: This exploratory study revealed the presence of distinct molecular networks associated with renal and mucocutaneous involvement, and response to B-cell-targeted therapies, which, if confirmed, could guide precision targeting of advanced therapies for this heterogenous disease.

Funding: Versus Arthritis, UCLH Biomedical Research Centre, LUPUS UK, and GSK.


Conflict of interest statement

MS and MRE are named on a patent pending (IgA2 anti-dsDNA antibodies as a biomarker in SLE, the patent is to University College London). MRE has received grant support from GSK, VersusArthritis, National Institute of Health and Care Research (NIHR), UK Medical Research Council (MRC), and Lupus UK, on behalf of his coauthors, which funded the research. MRE and CG have been members of the speakers’ bureau for GSK and have received consultancy fees for attending GSK advisory boards. DAI has received consultancy fees from AstraZeneca, Eli Lilly, Merck Serono, Servier. CG also reports personal fees for honoraria from consultancy work from the US Centers for Disease Control and Prevention, AbbVie, Amgen, AstraZeneca, EMD Serono, MGP, Sanofi, and UCB; personal fees for a speakers’ bureau from UCB; and an educational grant from UCB to Sandwell and West Birmingham Hospitals NHS Trust that supported her research work. All other authors declare no competing interests.

Figures

Figure 1
Figure 1
Baseline predictors of major clinical response to belimumab (A–D) and placebo (E–H; both after rituximab), at 52 weeks in the BEAT-LUPUS trial (A, E) Sparse Partial Least Squares Discriminant Analysis (sPLS-DA); factor-loading weights in component 1 are shown for the top five ranked parameters, as chosen by model optimisation, to predict major clinical response at 52 weeks for belimumab (A) and placebo (E) groups. (B, F) Forest plot showing the OR and 95% CI, calculated via univariate logistic regression, of the variables chosen by sPLS-DA with p values for belimumab (B) and placebo (F) groups. (C, G) Results of multiple logistic regression analysis to construct the final model to predict belimumab (C) or placebo (G) response at 52 weeks, in which variables were selected by random forest classification algorithm; with AUROC of this final model to predict belimumab (D) and placebo (H) response. Unit changes for the continuous variables used in the logistic regression are shown in the appendix (p 6). AUROC=area under the receiver operator curve. ds-DNA=double-strand DNA.
Figure 2
Figure 2
Baseline serum IgA2 anti-dsDNA antibody concentrations as a predictor of clinical response (A–C) and severe flares D, E) in the BEAT-LUPUS trial (A, B) AUROC of serum IgA2 anti-dsDNA antibodies at baseline to predict treatment response to belimumab (A) and placebo (B) at 52 weeks. (C) Serum IgA2 anti-dsDNA antibody concentration (patients were categorised into high or low concentration groups based on the optimal cut-off point from the AUROC analysis in part A, which was 10·7 AUs) was tested as an effect modifier of clinical response at 52 weeks. (D,E) Occurrence of severe flares stratified by low (D) and high (E) serum IgA2-anti-dsDNA antibody concentrations. AU=arbitrary unit. AUROC=area under the receiver operator characteristic curve. dsDNA=double-stranded DNA. *Odds ratios with 95% CIs are provided to predict major clinical response and calculated with logistic regression. †Calculated using Fisher's exact test.
Figure 3
Figure 3
Change in serum IgA2 anti-dsDNA antibody concentrations with belimumab after rituximab versus placebo after rituximab in patients with SLE (A) Principal component analysis of variables (listed in the appendix [p 6]) was done from baseline through to 52 weeks and split into treatment groups and timepoints for visualisation purposes. Each datapoint in the top panel represents a patient, and in the bottom panel shows population densities stratified by treatment and timepoint. The first two principal components described 65·3% of the variance. (B) The contribution of the top 10 variables loading weights in principal component 1. (C–E) Longitudinal change of serum IgA2 anti-dsDNA antibodies stratified by treatment (ie, belimumab vs placebo [after rituximab]; C), treatment response in belimumab treated group (D), and treatment response in placebo treated group (E). A longitudinal linear mixed-effect model was fitted with random patient effect to account for clustering by patients and fixed effect of treatment group intercepting with trial times and adjusted for screening IgA2 anti-dsDNA antibody concentrations, age, sex, concomitant mycophenolate (yes or no), and prednisolone dose at respective timepoints to calculate expected difference at 24 and 52 weeks in serum IgA2 anti-dsDNA antibodies. Estimated mean with 95% CIs and number of patients at each timepoints (n) are shown; p values at weeks 24 and 52 are provided. Horizontal dotted line indicates the ULN (3 SDs above the mean of healthy control samples). AU=arbitrary unit. ESR=erythrocyte sedimentations rate. dsDNA=double stranded DNA. PCR=protein creatinine ratio. ULN=upper limit of normal.
Figure 4
Figure 4
Association between numbers of IgA2-producing plasmablasts in peripheral blood at baseline and major clinical response (A, B) Representative flow cytometry plots of IgA1-secreting and IgA2-secreting plasmablasts (gated as CD19+CD27hiCD38hi) at screening and at 52 weeks, stratified by belimumab (after rituximab) responders and non-responders (A) and placebo (after rituximab) responders and non-responders (B). Cumulative data of absolute number of IgA2-secreting plasmablasts at screening and 52 weeks show for responders (n=5) and non-responders (n=5) in the belimumab group (C), responders (n=6) and non-responders (n=7) in the placebo group (D), and belimumab versus placebo (E), both after rituximab. A linear regression analysis of covariance model was fitted and adjusted for baseline values, age, sex, concomitant mycophenolate (yes or no), and prednisolone dose at the two timepoints to calculate expected difference at 52 weeks. Estimated means with 95% CIs are shown, with p value at weeks 52. (F) Comparison of absolute number of IgA2-secreting plasmablasts at screening categorised according to clinical response at 52 weeks to belimumab and placebo. The boxes and bars indicate mean with 95% CI and the horizontal lines indicate the median value. p values are shown above by non-parametric pairwise comparison, calculated using Dunn's multiple comparison test with Bonferroni's adjustment
Figure 5
Figure 5
Top variables predicting active renal and mucocutaneous disease at screening (A, C) Sparse partial least squares discriminant analysis, with factor-loading weights in component 1 are shown for the top 10 ranked parameters that predicted active renal disease (A) and mucocutaneous disease (C) at baseline (ie, at screening). (B, D) OR with 95% CIs of multiple logistic regression to construct the final model to predict active renal disease at screening (B) or active mucocutaneous disease at screening (D), where variables were selected by the random forest classification algorithm. Unit changes for the continuous variables used in the logistic regression are shown the appendix (p 6). AUROC=area under the receiver operator curve. dsDNA=double-strand DNA. OR=odds ratio.

References

    1. Banchereau R, Hong S, Cantarel B, et al. Personalized immunomonitoring uncovers molecular networks that stratify lupus patients. Cell. 2016;165:551–565. - PMC - PubMed
    1. Atisha-Fregoso Y, Toz B, Diamond B. Meant to B: B cells as a therapeutic target in systemic lupus erythematosus. J Clin Invest. 2021;131 - PMC - PubMed
    1. Furie R, Petri M, Zamani O, et al. A phase III, randomized, placebo-controlled study of belimumab, a monoclonal antibody that inhibits B lymphocyte stimulator, in patients with systemic lupus erythematosus. Arthritis Rheum. 2011;63:3918–3930. - PMC - PubMed
    1. Carter LM, Isenberg DA, Ehrenstein MR. Elevated serum BAFF levels are associated with rising anti-double-stranded DNA antibody levels and disease flare following B cell depletion therapy in systemic lupus erythematosus. Arthritis Rheum. 2013;65:2672–2679. - PubMed
    1. Shipa M, Embleton-Thirsk A, Parvaz M, et al. Effectiveness of belimumab after rituximab in systemic lupus erythematosus: a randomized controlled trial. Ann Intern Med. 2021;174:1647–1657. - PubMed

LinkOut - more resources