. 2023 Jan 13;26(2):105973.
doi: 10.1016/j.isci.2023.105973. eCollection 2023 Feb 17.

Regulation of DNA damage response by trimeric G-proteins

Affiliations

Regulation of DNA damage response by trimeric G-proteins

Amer Ali Abd El-Hafeez et al. iScience. .

Abstract

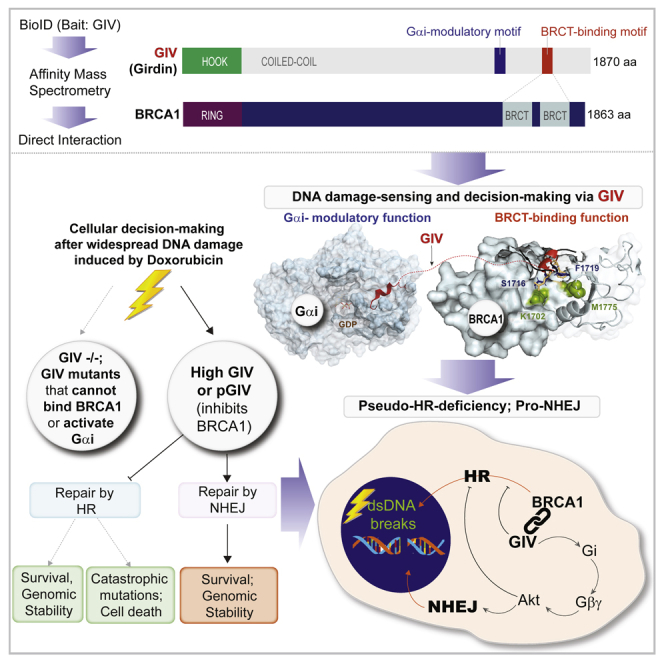
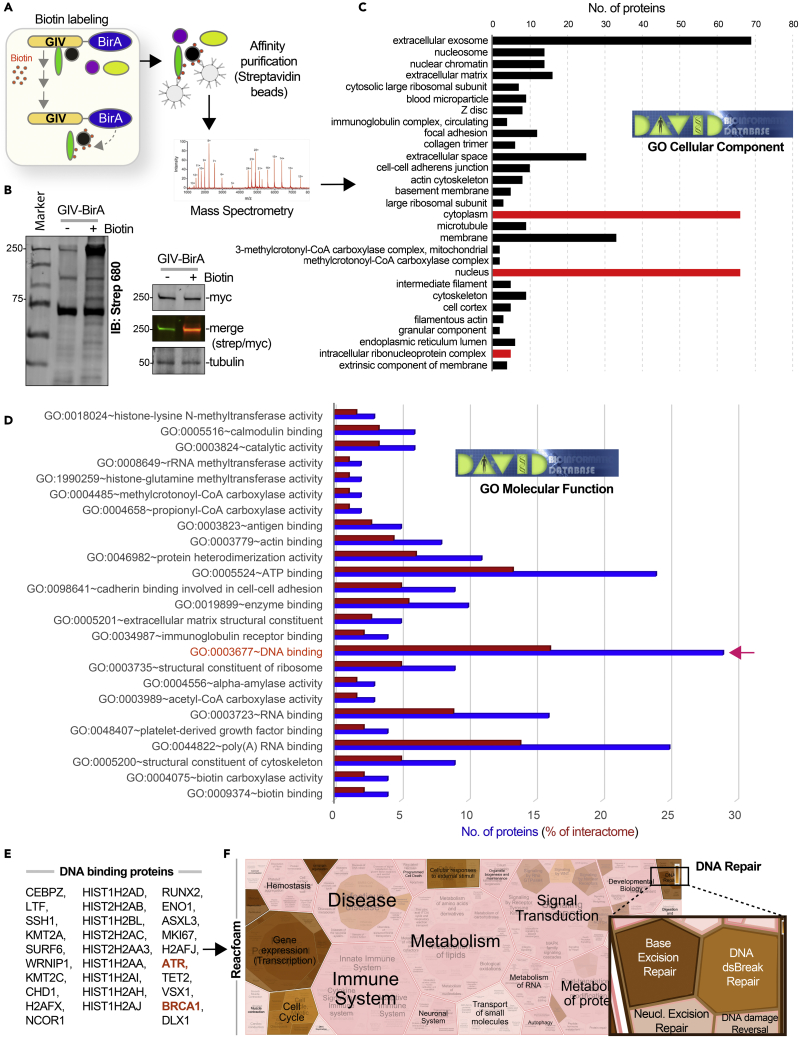
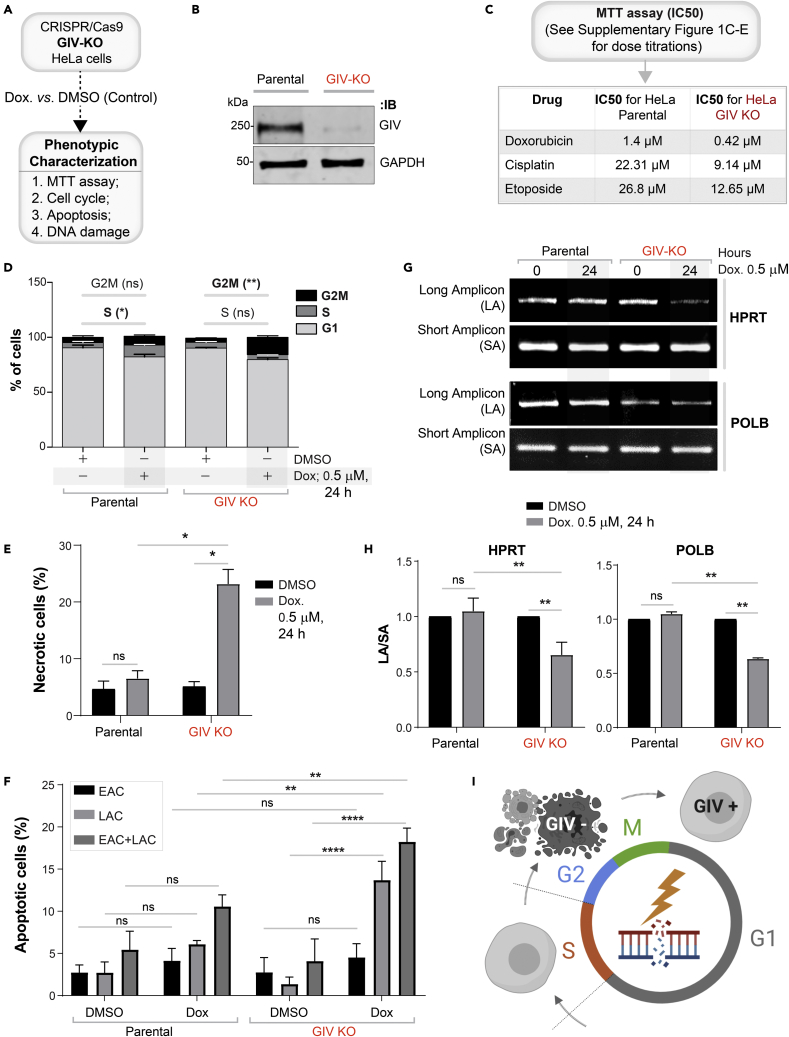
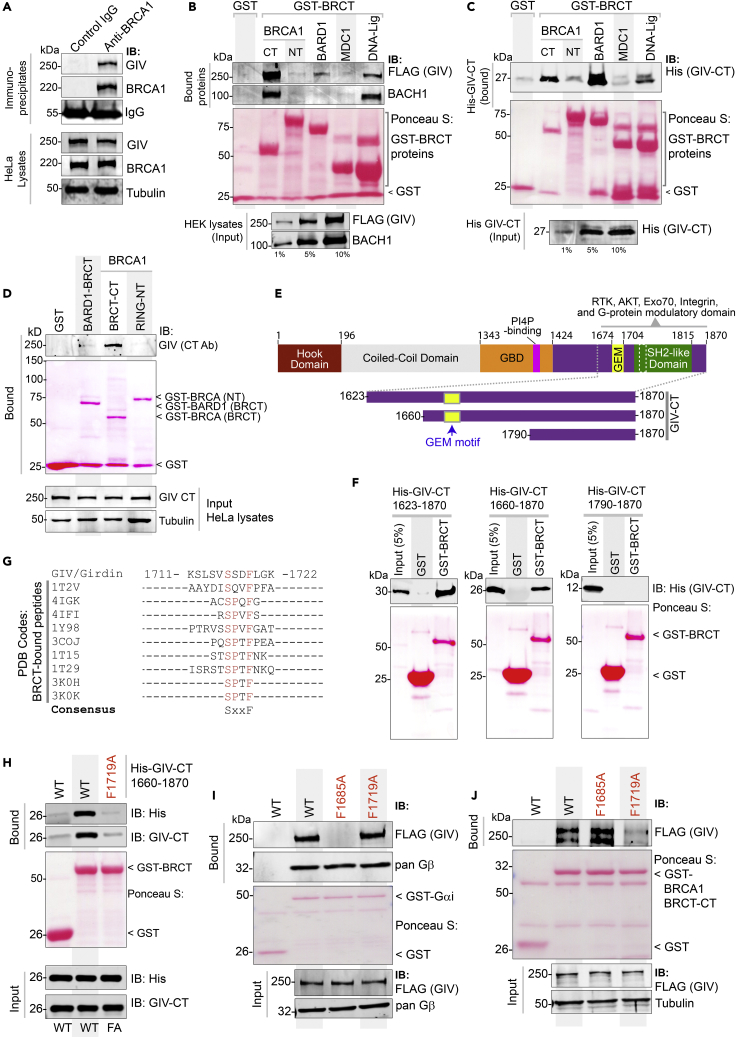
Upon sensing DNA double-strand breaks (DSBs), eukaryotic cells either die or repair DSBs via one of the two competing pathways, i.e., non-homologous end-joining (NHEJ) or homologous recombination (HR). We show that cell fate after DSBs hinges on GIV/Girdin, a guanine nucleotide-exchange modulator of heterotrimeric Giα•βγ protein. GIV suppresses HR by binding and sequestering BRCA1, a key coordinator of multiple steps within the HR pathway, away from DSBs; it does so using a C-terminal motif that binds BRCA1's BRCT-modules via both phospho-dependent and -independent mechanisms. Using another non-overlapping C-terminal motif GIV binds and activates Gi and enhances the "free" Gβγ→PI-3-kinase→Akt pathway, which promotes survival and is known to suppress HR, favor NHEJ. Absence of GIV, or loss of either of its C-terminal motifs enhanced cell death upon genotoxic stress. Because GIV selectively binds other BRCT-containing proteins suggests that G-proteins may fine-tune sensing, repair, and survival after diverse types of DNA damage.

Keywords: Biological sciences; Cell biology; Molecular biology.


Conflict of interest statement

Authors declare no competing interests.

Figures

None
Graphical abstract
Figure 1
Figure 1
Proteomic studies suggest an intranuclear role of GIV/Girdin in DNA damage repair response (A) Schematic outlining key steps in BioID studies to identify the GIV interactome. (B) Immunoblots confirm biotinylation in HEK whole cell lysates (left) and expression of the BirA-tagged full-length GIV construct as a protein of expected size (right). (C and D) Bar plots show GO analyses [cellular component (C) and molecular function (D)] for bioID-identified GIV interactome. Red bars in C indicate putative compartments where GIV binds BRCA1. Blue and red bars in D indicate a total number of interacting proteins and % representation, respectively. Red arrow in D indicates the molecular function category where BRCA1 was identified. (E and F) DNA-binding proteins (listed in E) that were identified in GIV’s interactome were analyzed by Reactome.org and visualized as hierarchical reacfoam (in F). Inset in the top right corner is magnified to highlight the overrepresentation of DNA repair pathways.
Figure 2
Figure 2
DNA damage repair response is impaired in cells without GIV (A) Schematic outlining the cell lines and phenotypic assays displayed in this figure. (B) Immunoblot of GIV-depleted (by CRISPR Cas9) and control (Parental) HeLa cell lysates showing the depletion of full-length endogenous GIV. See also Figure S1 for how pooled KO lines were generated. (C) Table of IC50 values for 3 different drugs tested on parental and GIV KO HeLa cells, as determined using MTT assays. See Figures S1C and S1E for the dose-dependent survival curves. (D) Stacked bar graphs showing the percentage of cells at various stages of the cell cycle (G1, S, and G2/M) after challenged with Dox or vehicle control (DMSO). Histograms are shown in Figure S1F. Data displayed as mean ± SEM and one-way ANOVA using Tukey’s multiple comparisons test was used to determine significance. (∗; p ≤ 0.05, ∗∗; p ≤ 0.01; ns = not significant). (E and F) Bar graphs display the % necrotic (E) or apoptotic (early, EAC; late, LAC; or combined) cells after challenged with either Dox or vehicle control (DMSO), as assessed by annexin V staining and flow cytometry. See Figure S1G for the dot plot diagrams. (G and H) Long amplicon qPCR (LA-QPCR) was used to evaluate genomic DNA SB levels in control vs. GIV KO cells. Representative gel showing PCR-amplified fragments of the HPRT (G, top panel) and POLB (G, bottom panel) genes. Amplification of each large fragment (upper panels) was normalized to that of a small fragment of the corresponding gene (bottom panels), and the data were expressed as normalized (with short PCR amplicon) relative band intensity with the DMSO-treated (0 h) sample in each case arbitrarily set as unity and displayed as a bar graph in H. Full-length gels can be seen in Figure S1H. Data displayed as mean ± SEM and one-way ANOVA to determine significance. (∗∗; p ≤ 0.01; ∗∗∗∗; p ≤ 0.0001; ns = not significant). (I) Summary of the phenotype of cells with (parental; GIV +) or without GIV (GIV KO; GIV -). See also Table S3.
Figure 3
Figure 3
GIV directly binds the BRCT module of BRCA1 (A) Coimmunoprecipitation assays were carried out on lysates of HeLa cells using anti-BRCA1 antibody or control IgG and immune complexes (top) and lysates (bottom) were analyzed for GIV and BRCA1 by immunoblotting. (B) Lysates of HEK cells exogenously expressing FLAG-tagged full-length GIV were used as the source of GIV and endogenous BACH1 (positive control for known BRCA1-binding protein in the same lysates) in pulldown assays with GST-tagged BRCA1 fragments and BRCT modules of various indicated proteins (visualized using Ponceau S). Bound proteins (top) and lysates (bottom) were analyzed for GIV and BACH1. (C) Pulldown assays were carried out using recombinant His-GIV-CT (aa 1660–1870) and GST-BRCT modules as in B. Bound GIV was visualized by immunoblotting (anti-His). (D) Pulldown assays were carried out using lysates of HeLa cells as the source of endogenous full-length GIV with GST-tagged BRCT modules of BRCA1 and BARD1. Bound GIV was visualized by immunoblotting. See also Figure S3 for similar studies with Cos7 and Hs578T cell lysates. (E and F) Recombinant GIV-CT proteins of various lengths (see schematic E) were used in pulldown assays with the GST-BRCT module of BRCA1. Bound GIV-CT fragments were analyzed in F by immunoblotting (His). (G) Alignment of GIV’s C-terminal sequence with known phosphopeptides that bind BRCA1, as confirmed by X-ray crystallography (PDB codes on the left). The consensus SxxF sequence is shown (evolutionary conservation of the SxxF motif and its relationship with other motifs on GIV-CT is shown in Figure S4). (H) Pulldown assays were carried out using His-GIV-CT WT or F1719A mutant with GST/GST-BRCA1 and bound GIV was analyzed by immunoblotting. (I and J) Pulldown assays were carried out with either GDP-loaded GST-Gαi3 (I) or GST-BRCA1 (BRCT; J) proteins and lysates of HEK cells exogenously expressing FLAG-tagged GIV wild-type (WT) or GIV mutants that do not bind G protein (F1685A) or do not bind BRCA1 (F1719A; current work). Bound proteins were visualized by immunoblotting using anti-FLAG IgG.
Figure 4
Figure 4
GIV binds BRCA1 via both canonical (phosphodependent) and non-canonical (phosphoindependent) mechanisms (A and B) Binding of unphosphorylated GIV with BRCA1 does not compete with canonical, phospho-dependent binding of BACH1 (A) or CtIP (B). Pulldown assays were carried out using lysates of HEK cells as a source of myc-BACH1 (A) or GFP-CtIP (B) and recombinant GST/GST-BRCA1 proteins, in the presence (+) or absence (−) of either wild-type (WT) or BRCA-binding deficient F1719A (FA) mutant His-GIV-CT at 50-fold molar excess of GST-BRCA1. Bound proteins were visualized by immunoblotting with anti-His (GIV), anti-myc (BACH1; A), or anti-GFP (CtIP; B) IgGs. See also Figure S5. (C and D) Pulldown assays were carried out using His-GIV-CT (C) or His-TP53 (D) and GST or GST-BRCA1 (WT and M1775R mutants). Bound proteins were visualized by immunoblotting with anti-His IgG. (E) Pulldown assays were carried out using lysates of HEK cells as the source of HA-BRCA1 (full length) with either GST (control) or wild-type (WT) and phosphomimic (S1716D) or non-phosphorylatable (S1716A) mutant GST-GIV-CT. Bound BRCA1 was visualized by immunoblotting. (F) Pulldown assays were carried out as in E, using lysates of HEK cells exogenously expressing either wild-type (WT) or K1702M mutant of HA-BRCA1. (G) Pulldown assays were carried out using recombinant His-GIV-CT (WT or S1716D) and either GST-BRCA1 WT or M1775R mutant protein as in C. Bound GIV was visualized by immunoblotting using anti-His IgG. (H) Lysates of HEK cells exogenously expressing full-length GIV-FLAG constructs were used as the source of GIV in pulldown assays with GST/GST-BRCA1. Bound GIV was visualized using anti-FLAG IgG. (I) Homology model of phospho-dependent GIV⋅BRCA1 complex (I; top) built using the solved crystal structure of BACH1⋅BRCA1 complex (PDB: IT29) as a template. GIV = red; major residues on BRCA1 or GIV that were mutated here are labeled. Impact of M1775R mutant BRCA1 posing a steric clash with F1719 (GIV) is highlighted (I; bottom). (J) Schematic summarizing the two modes of binding of the same 1716SxxF1719 sequence on GIV-CT to the BRCT module of BRCA1. The structural basis for phospho-independent binding remains unknown (left; “?”).
Figure 5
Figure 5
DNA damage repair response is impaired in cells expressing mutant GIV that cannot bind BRCA1 (F1719A) or bind/activate G proteins (F1685A) (A) Schematic outlining the cell lines and phenotypic assays displayed in this figure. (B) Immunoblot of the HeLa cell lysates showing the depletion of full-length endogenous GIV, followed by rescue WT and mutant GIV at levels close to endogenous. (C) Table of IC50 values for 3 different drugs tested on GIV-WT, GIV-F1685A, and GIV-F1719A HeLa cells, as determined using MTT assays. See Figures S6A–S6D for the dose-dependent survival curves. (D) Stacked bar graphs showing the percentage of cells at various stages of the cell cycle (G1, S, and G2/M) after challenged with Dox or vehicle control (DMSO). Data displayed as mean ± SEM and one-way ANOVA using Tukey’s multiple comparisons test was used to determine significance. (∗; p ≤ 0.05, ∗∗; p ≤ 0.01; ns = not significant). Histograms are shown in Figure S6E. (E and F) Bar graphs display the % necrotic (E) or apoptotic (early, EAC; late, LAC; or combined) cells after challenge with either Dox or vehicle control (DMSO) as assessed by annexin V staining and flow cytometry. See Figure S6F for the dot plot diagrams. (G and H) Long amplicon qPCR (LA-QPCR) was used to evaluate genomic DNA SB levels in various HeLa cell lines. Representative gel showing PCR-amplified fragments of the HPRT (G, top panel) and POLB (G, bottom panel) genes. Amplification of each large fragment (upper panels) was normalized to that of a small fragment of the corresponding gene (bottom panels) and the data were expressed as normalized (with short PCR amplicon) relative band intensity with the DMSO-treated (0 h) sample in each case arbitrarily set as unity and displayed as a bar graph in H. Full-length gels can be seen in Figure S6G. Data displayed as mean ± SEM and one-way ANOVA to determine significance. (∗; p ≤ 0.05; ∗∗∗∗; p ≤ 0.0001; ns = not significant). (I) Schematic summarizing the findings in cells with GIV-WT or mutants that either cannot bind G protein (F1685A) or BRCA1 (F1719A). See also Table S3 for a summary of all phenotypes observed in these mutants.
Figure 6
Figure 6
GIV inhibits HR, favors NHEJ, and inhibits the localization of BRCA1 to sites of DNA damage (A) Schematic summarizing the two markers, 53BP1 (left) and Rad51 (right) commonly used to monitor the repair pathway of choice (NHEJ vs. HR, respectively) after DNA damage. (B–E′) Control (parental) and GIV-depleted (GIV KO) HeLa cells (B-C) or GIV-depleted HeLa cells stably expressing WT or mutant GIV constructs (D-E) were challenged with Dox or vehicle control (DMSO) prior to being fixed with Methanol and co-stained for γH2AX (green) and 53BP1 (red; left) or Rad51 (red; right) and analyzed by confocal microscopy. Representative images are shown in B and D (scale bar = 15 μm). Insets show the magnified view of a single cell (interrupted box) in the field, highlighting the punctate nature of the nuclear staining for 53BP1 or Rad51. Bar graphs in C-C′ and E-E′ show the quantification of the intensity of 53BP1 or Rad51 staining normalized to DAPI. Data displayed as mean ± SEM and one-way ANOVA to determine significance. (∗; p ≤ 0.05; ∗∗; p ≤ 0.01; ∗∗∗; p ≤ 0.001; ns = not significant). (F–H) Bar graphs display the fold change in the number of bright foci of 53BP1 in parental and GIV KO HeLa cells stably expressing mApple-53BP1 reporter (which detects NHEJ) upon challenge with the indicated concentrations of Doxorubicin (F), Cisplatin (G) or Etoposide (H). Data displayed as mean ± SEM and t-test to determine significance. (∗; p ≤ 0.05; ∗∗; p ≤ 0.01). See also Figures S7A and S7B for 53BP1 reporter studies on parental and GIV KO MDA-MB-231cells. (I–K) HeLa cell lines in B, D were treated as in B, D, and fixed and analyzed for GIV (top) and BRCA1 (bottom) localization with respect to the nuclei (demarcated with interrupted oval outlines). Representative images are shown in I-J (scale bar = 15 μm). See Table S4 for predicted nuclear localization signals in GIV. See also Figures S7B and S7C for expanded individual panels. Bar graphs in K show Pearson’s colocalization coefficient for the degree of colocalization observed within the nucleus between BRCA1 (red) and γH2AX (green).
Figure 7
Figure 7
Activation of Gi by GIV is required for Akt enhancement during DDR, contributes to pseudo-HR-deficiency (A–F) Control (parental) and GIV-depleted (GIV KO) HeLa cells (A-C) or GIV-depleted cells stably expressing WT or mutant GIV constructs (D-F) were challenged with Dox or vehicle control (DMSO) as indicated prior to lysis. Equal aliquots of lysates were analyzed for total (t) and phosphorylated (p) Akt and SMC1 proteins and GAPDH (loading control) by quantitative immunoblotting using LiCOR Odyssey. Representative immunoblots are shown in A and D, and quantification of phospho(p)/total(t) proteins is displayed as bar graphs in B, C, E, F. Data displayed as mean ± SEM and one-way ANOVA to determine significance. (∗; p ≤ 0.05; ∗∗; p ≤ 0.01; ∗∗∗; p ≤ 0.001; ∗∗∗∗; p ≤ 0.0001; ns = not significant). (G) Schematic on top shows the assay used for assessing the extent of Gαi-activation using conformation-sensitive antibodies that selectively bind the GTP-bound (active) conformation of Gαi protein. Immunoblots below show the active Gαi immunoprecipitated (top; IP) from lysates (bottom) of HeLa cells treated with Dox. for the indicated time points. (H) GIV-depleted (GIV KO) and control (Parental) HeLa cells were stimulated (+) or not (−) with Dox. as indicated, in the presence of either Gallein or its inactive isomer, Fluorescein. Equal aliquots of lysates were immunoblotted for pAkt and tAkt as in panel A. (I and J) Summary of findings showing how GIV skews the choice of repair pathway from HR to NHEJ, partly via sequestration of BRCA1 away from the sites of dsDNA breaks and in part via the enhancement of Akt via the Gi→“free” Gβγ→Class I PI3K pathway. The tools (mutants and chemical inhibitors) used in this work are highlighted in red.

References

    1. Tubbs A., Nussenzweig A. Endogenous DNA damage as a source of genomic instability in cancer. Cell. 2017;168:644–656. - PMC - PubMed
    1. Jackson S.P., Bartek J. The DNA-damage response in human biology and disease. Nature. 2009;461:1071–1078. - PMC - PubMed
    1. Giglia-Mari G., Zotter A., Vermeulen W. DNA damage response. Cold Spring Harbor Perspect. Biol. 2011;3:a000745. - PMC - PubMed
    1. Blackford A.N., Jackson S.P. ATM, ATR, and DNA-PK: the trinity at the heart of the DNA damage response. Mol. Cell. 2017;66:801–817. - PubMed
    1. van den Bosch M., Bree R.T., Lowndes N.F. The MRN complex: coordinating and mediating the response to broken chromosomes. EMBO Rep. 2003;4:844–849. - PMC - PubMed