. 2023 Apr 3;11(4):466-485.
doi: 10.1158/2326-6066.CIR-22-0927.

Combination IFNβ and Membrane-Stable CD40L Maximize Tumor Dendritic Cell Activation and Lymph Node Trafficking to Elicit Systemic T-cell Immunity

Affiliations

Combination IFNβ and Membrane-Stable CD40L Maximize Tumor Dendritic Cell Activation and Lymph Node Trafficking to Elicit Systemic T-cell Immunity

Hong Zheng et al. Cancer Immunol Res. .

Abstract

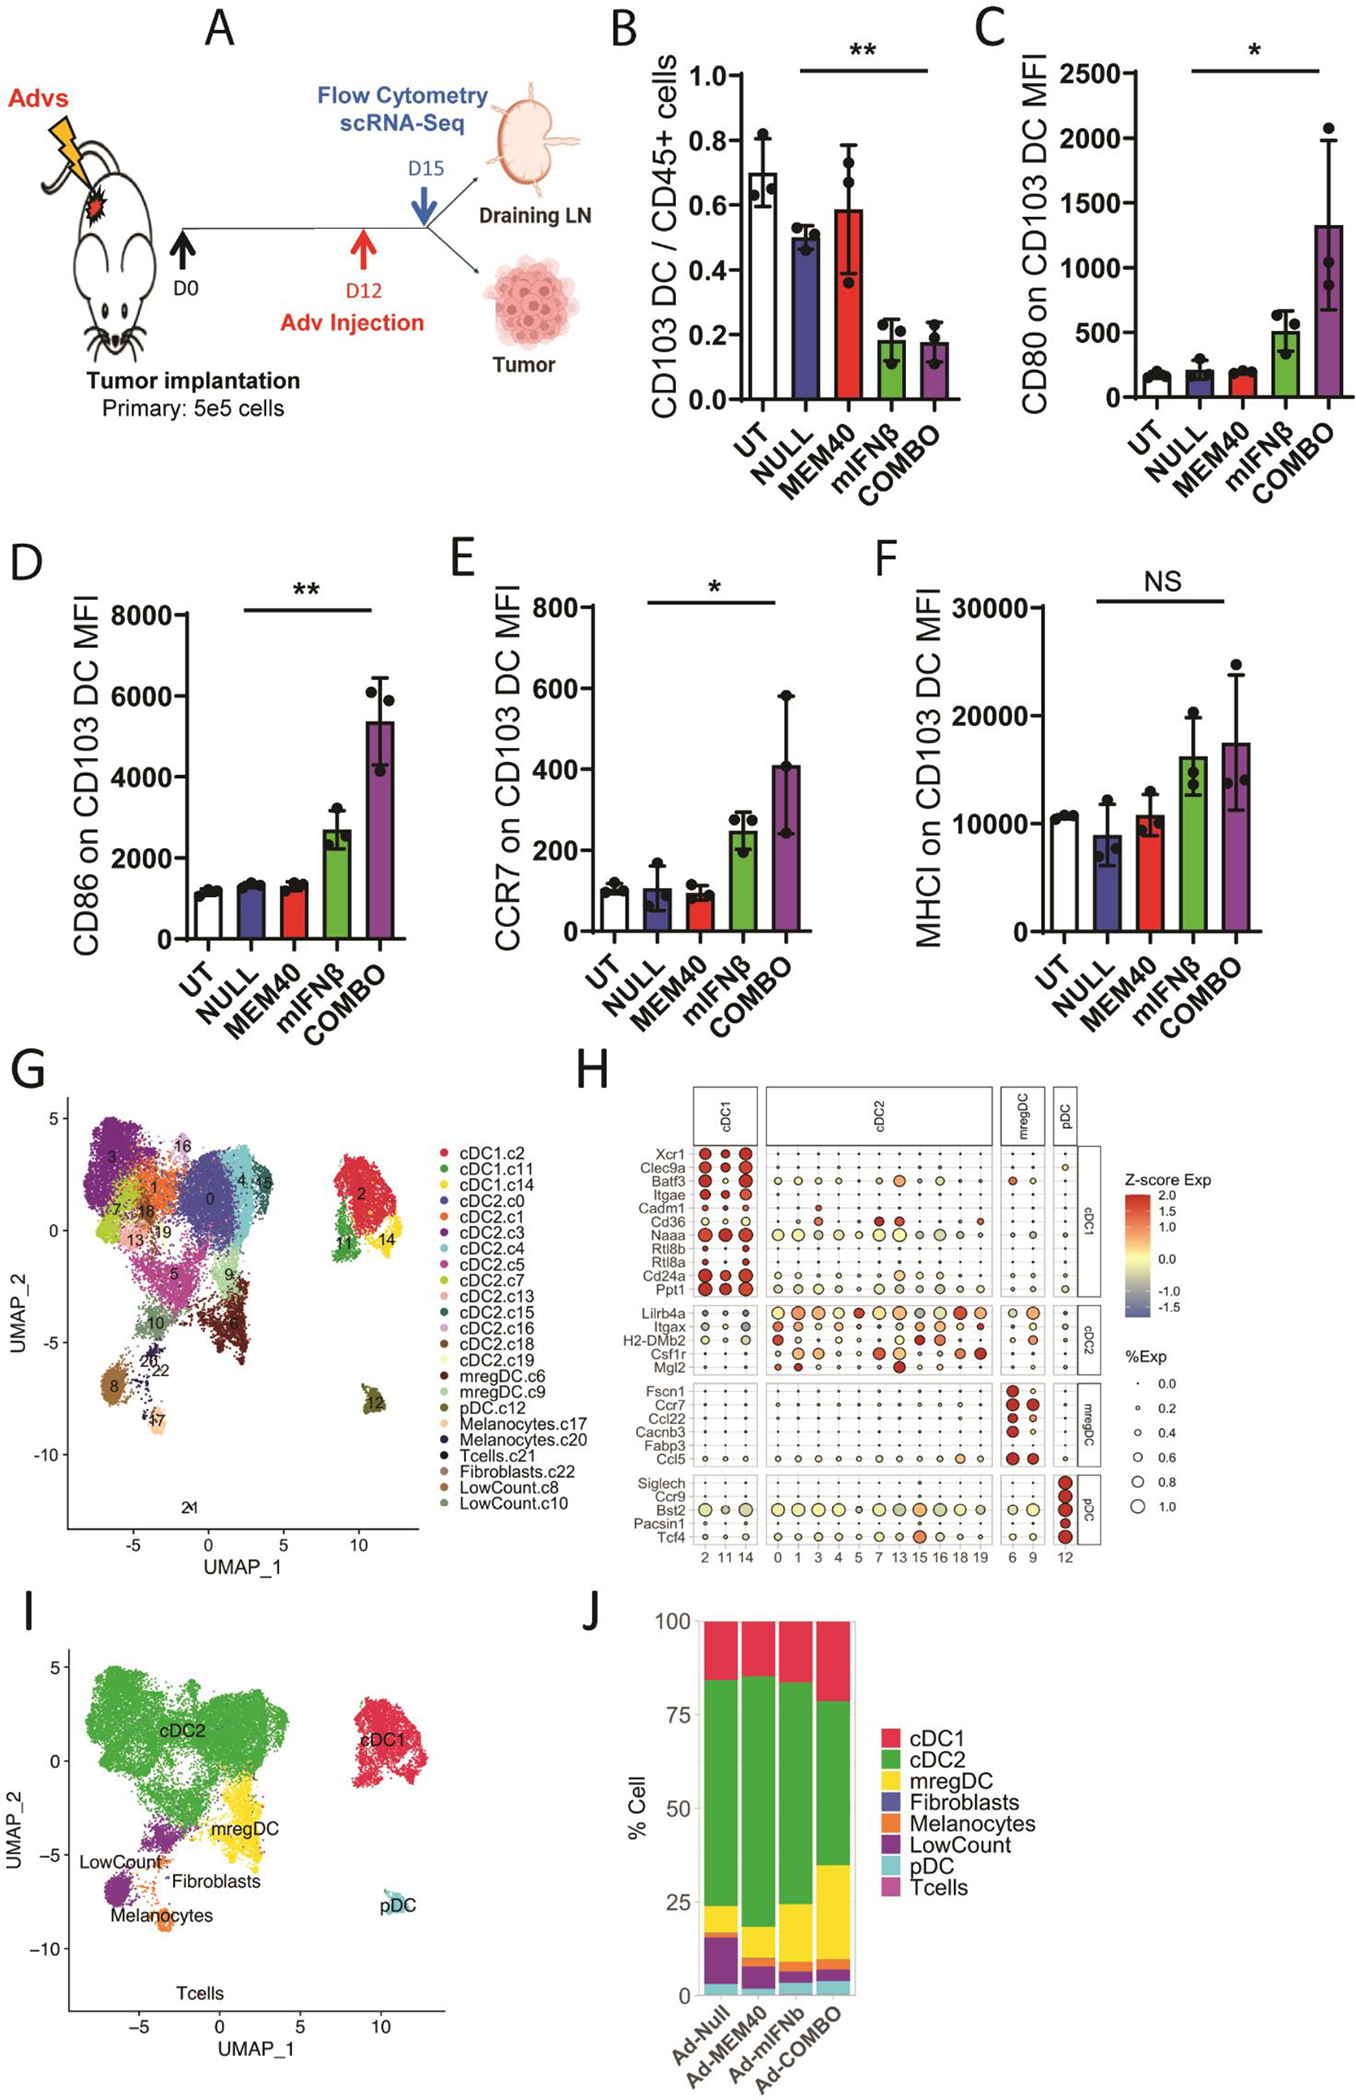
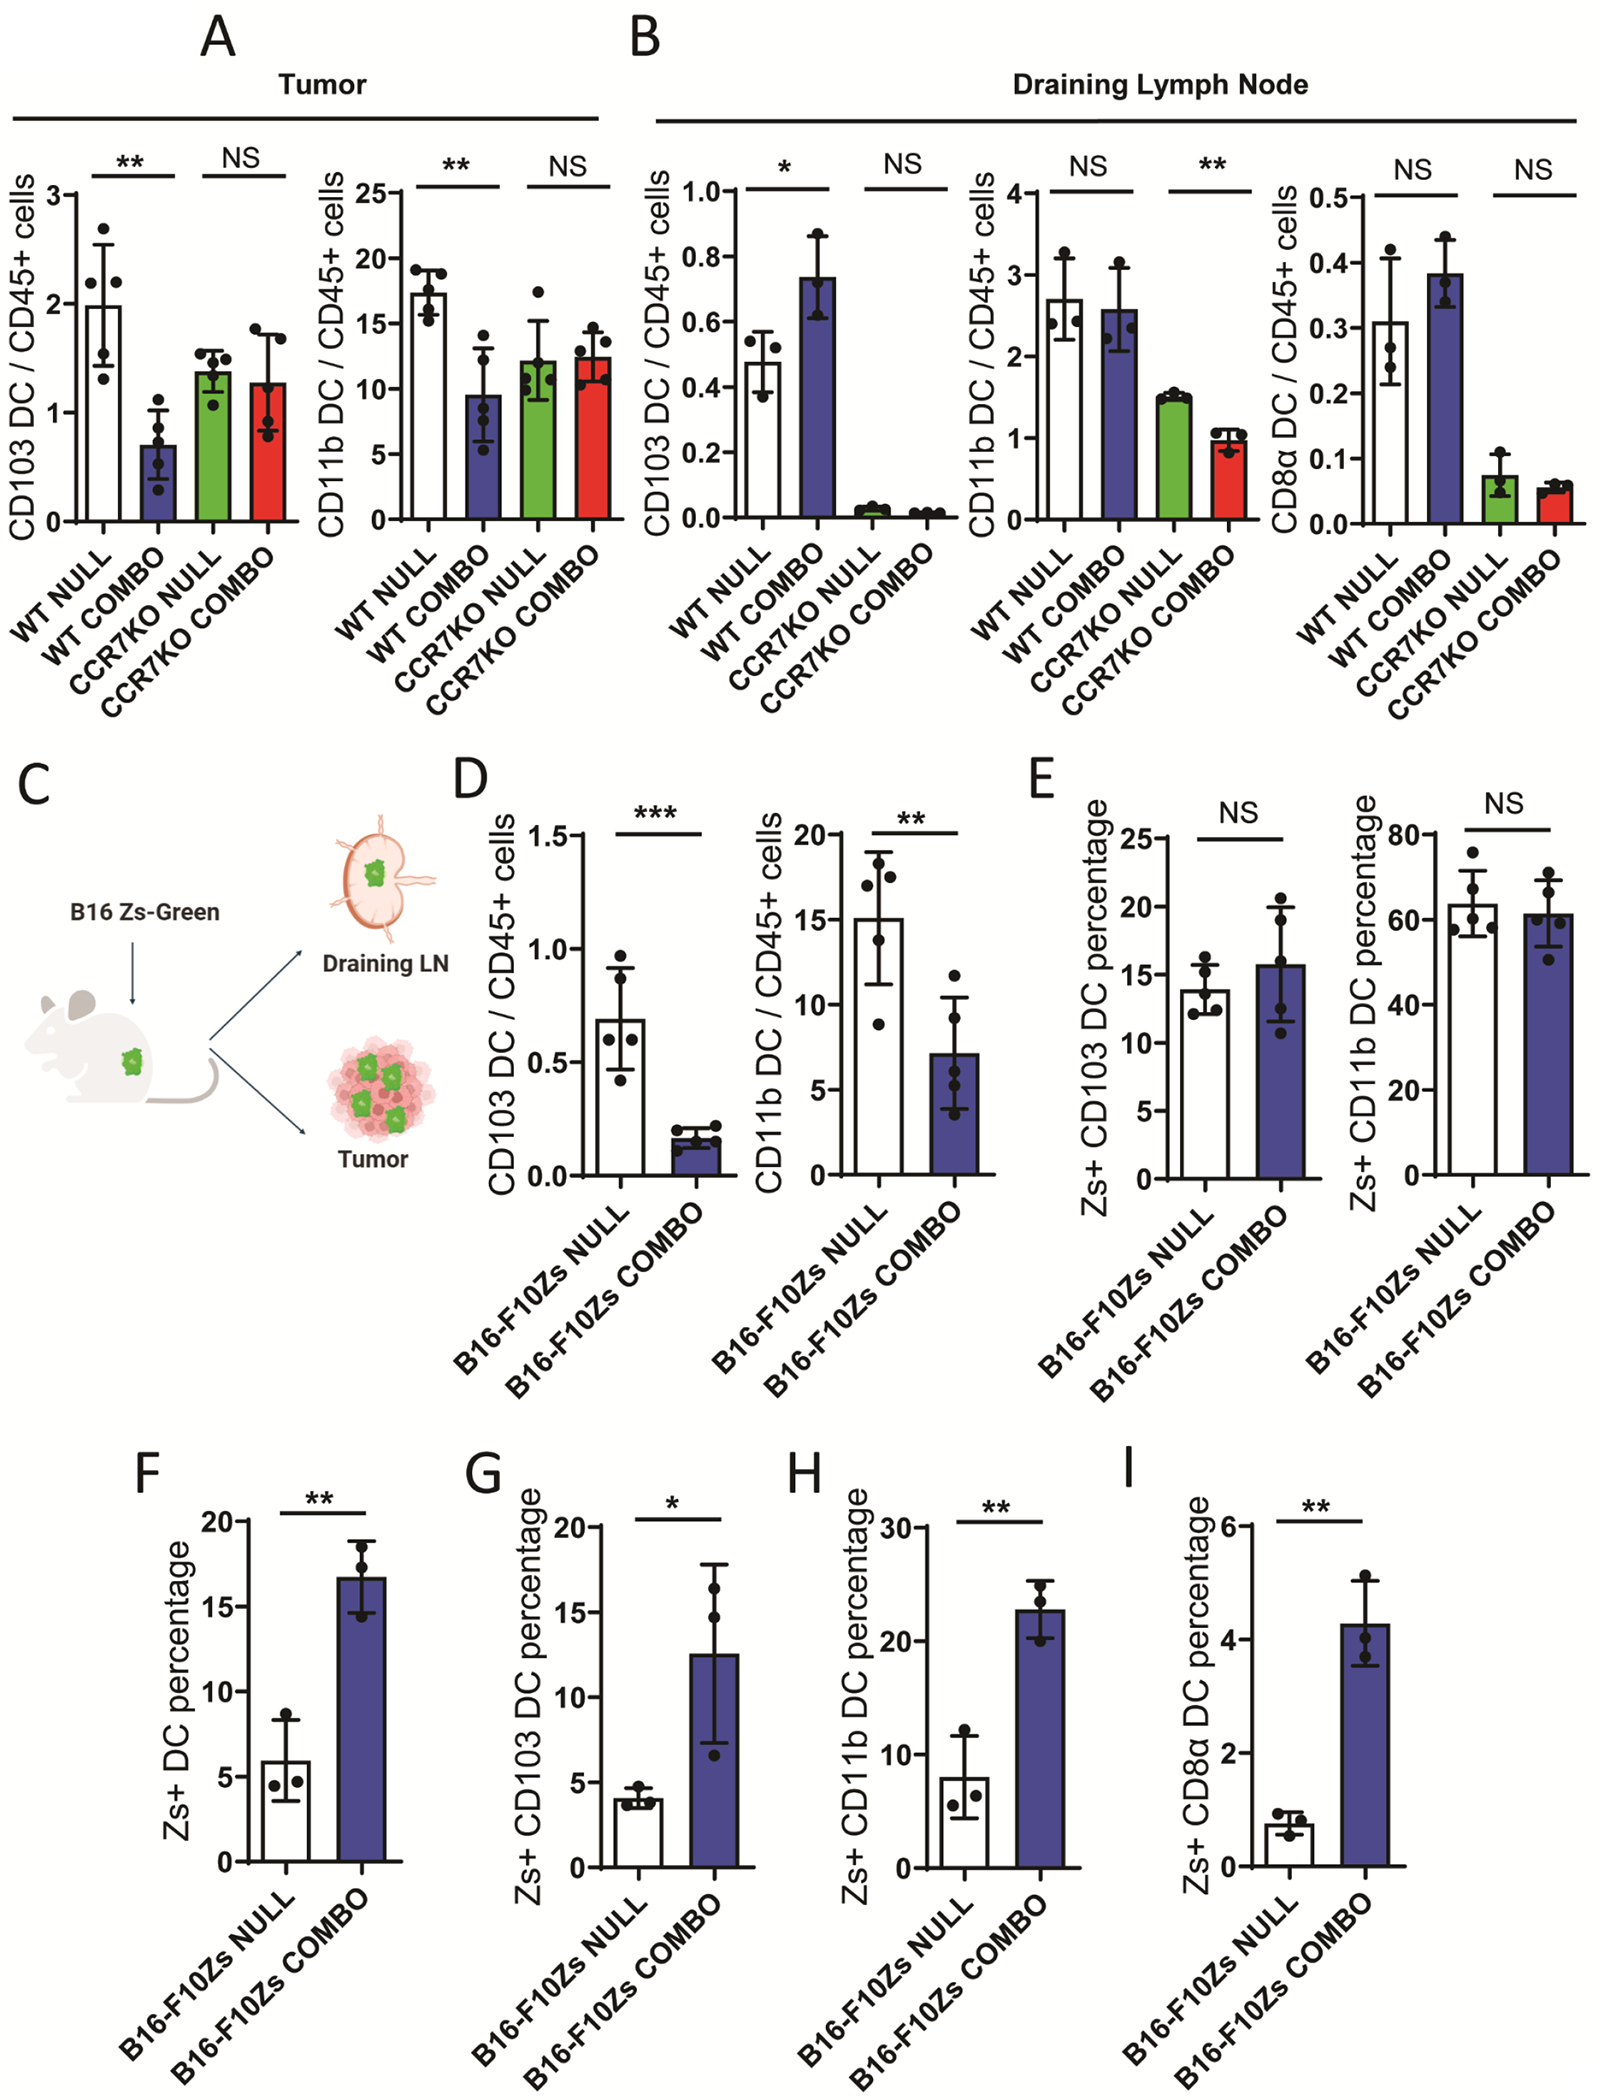
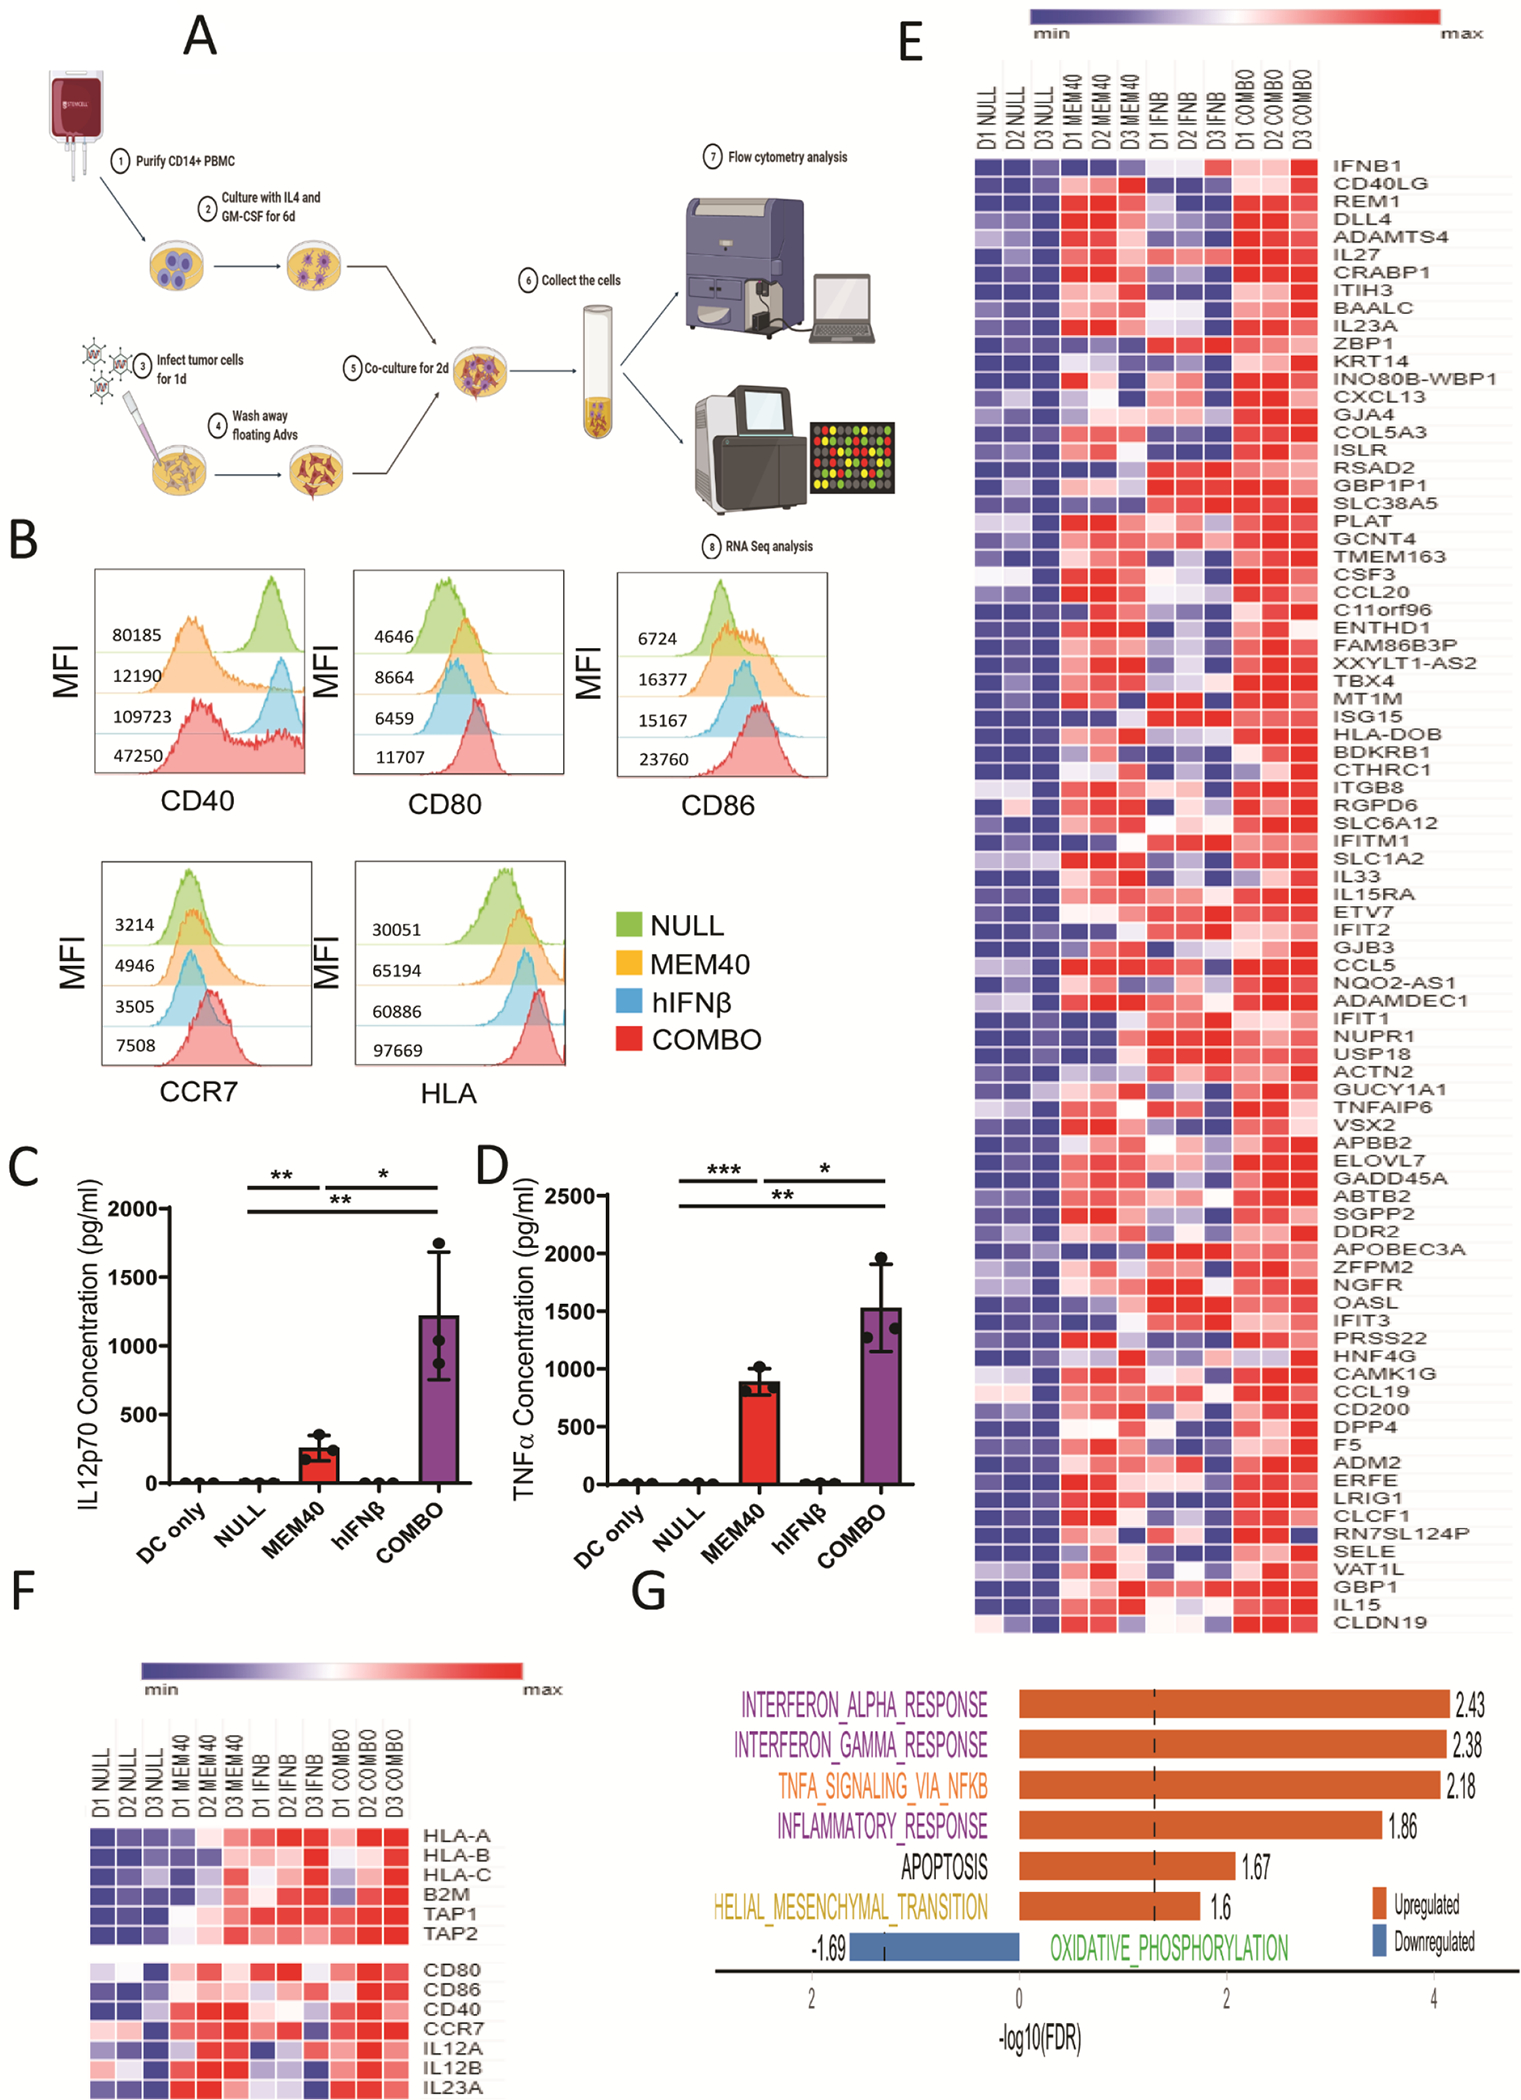
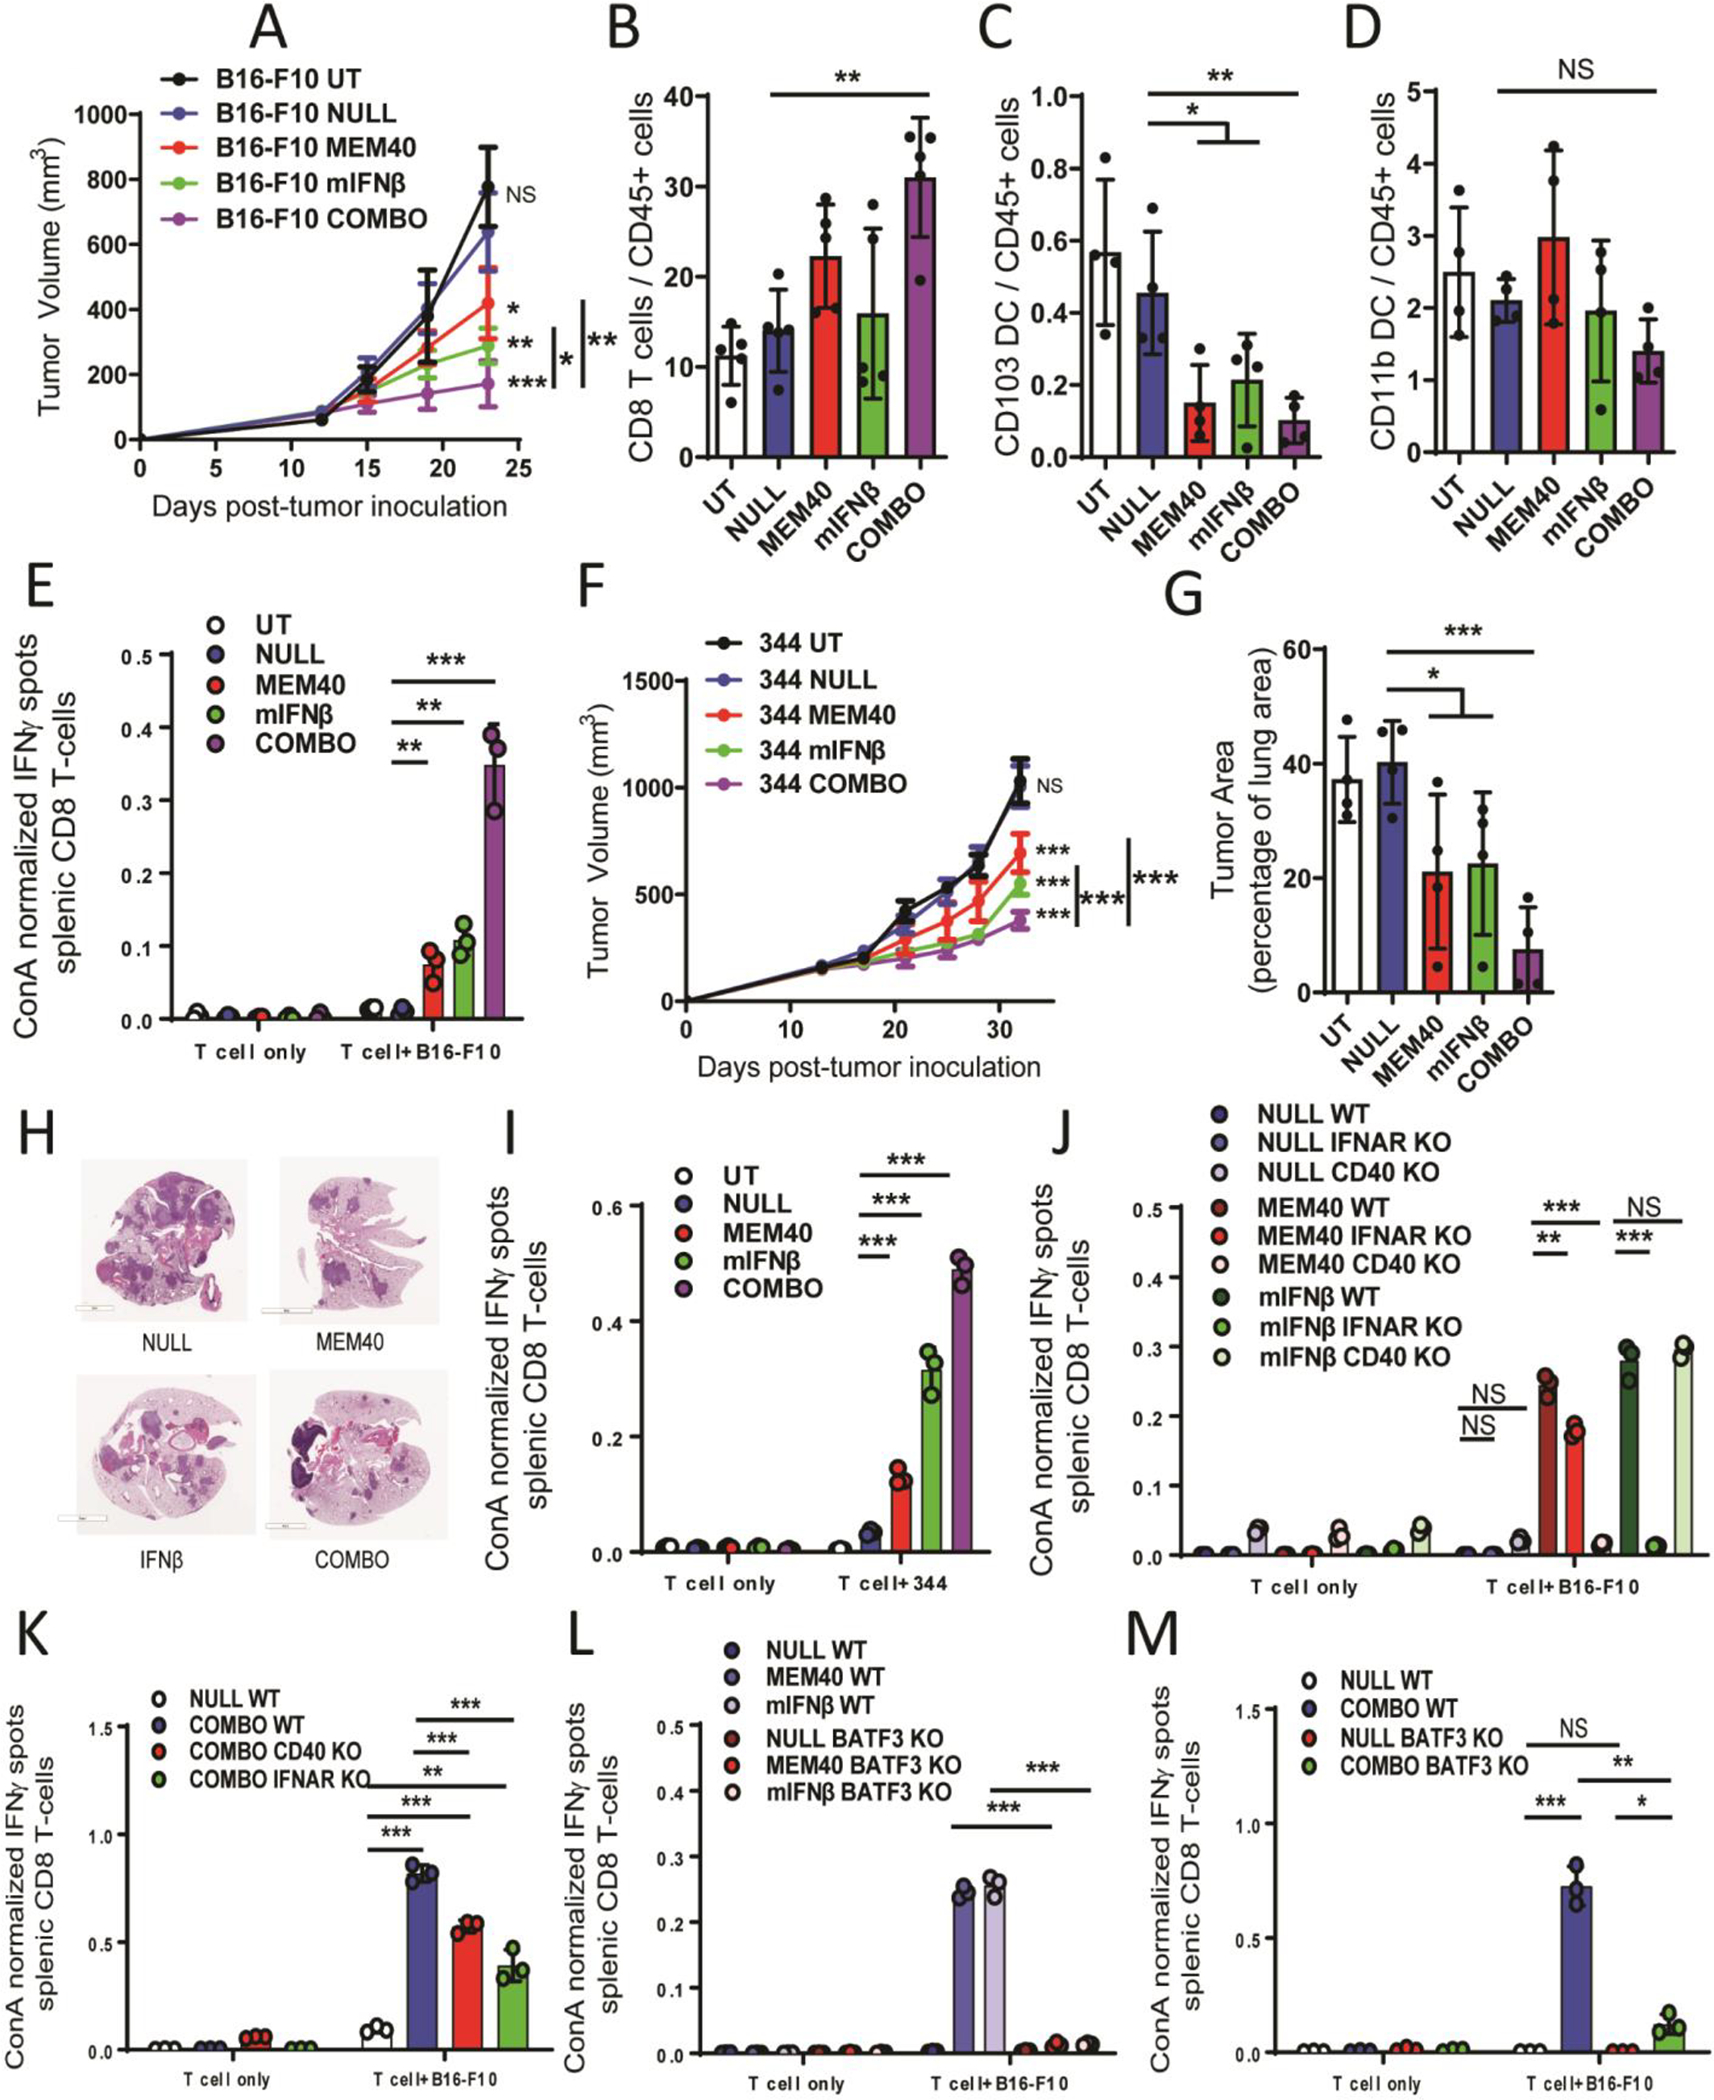
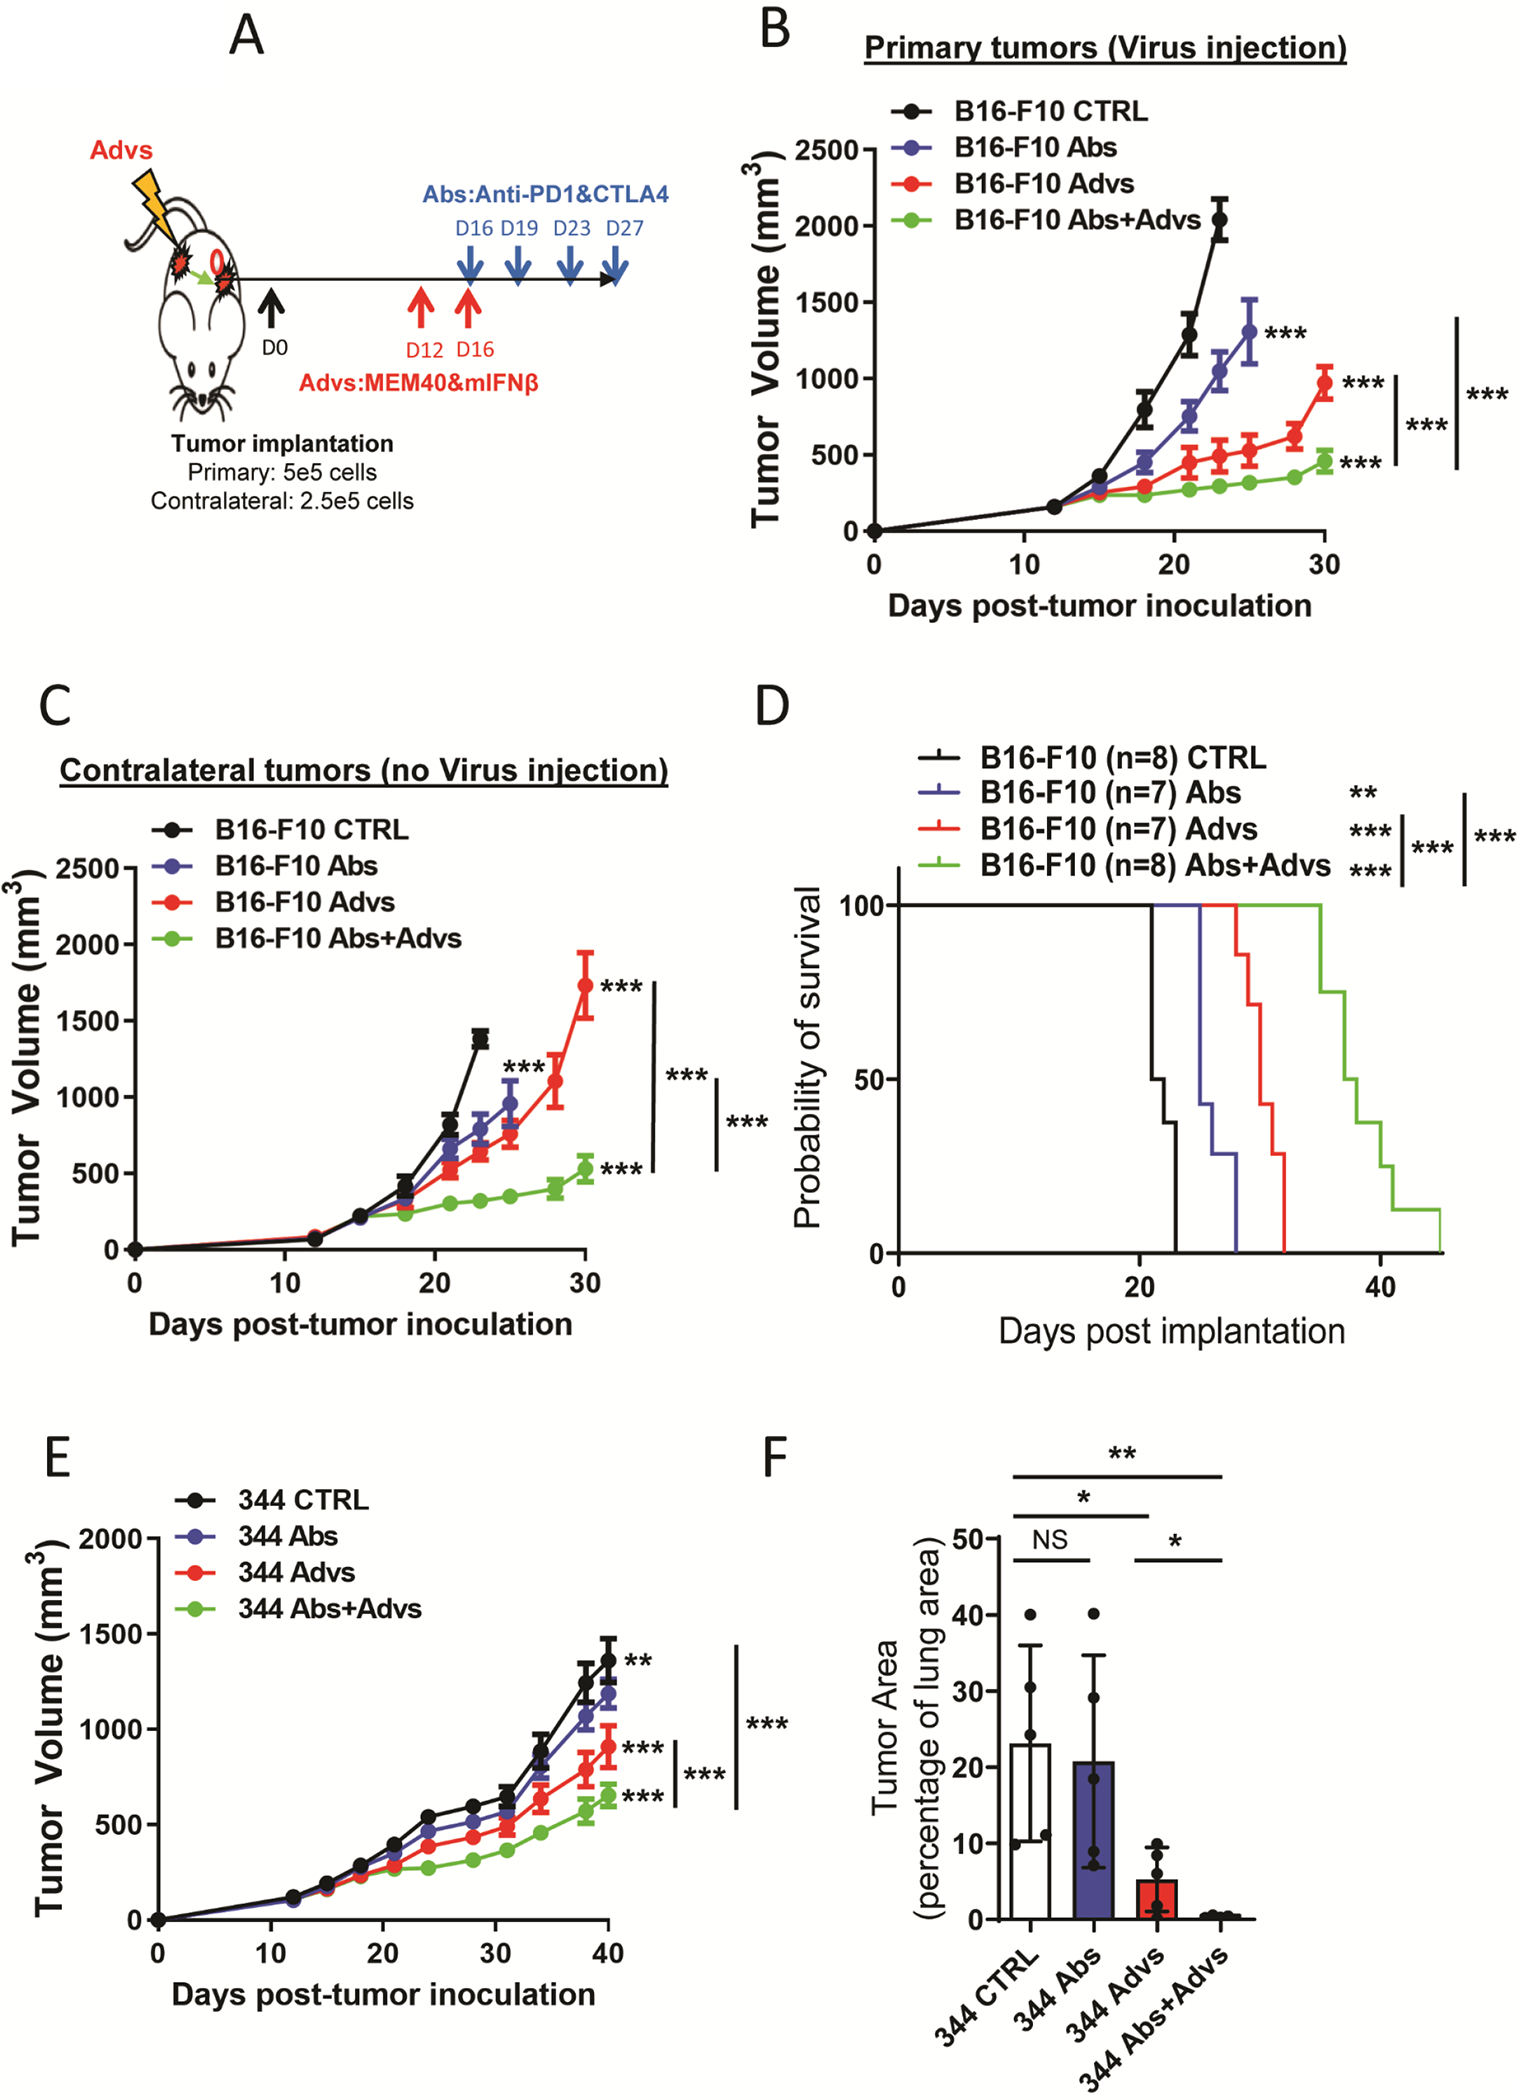
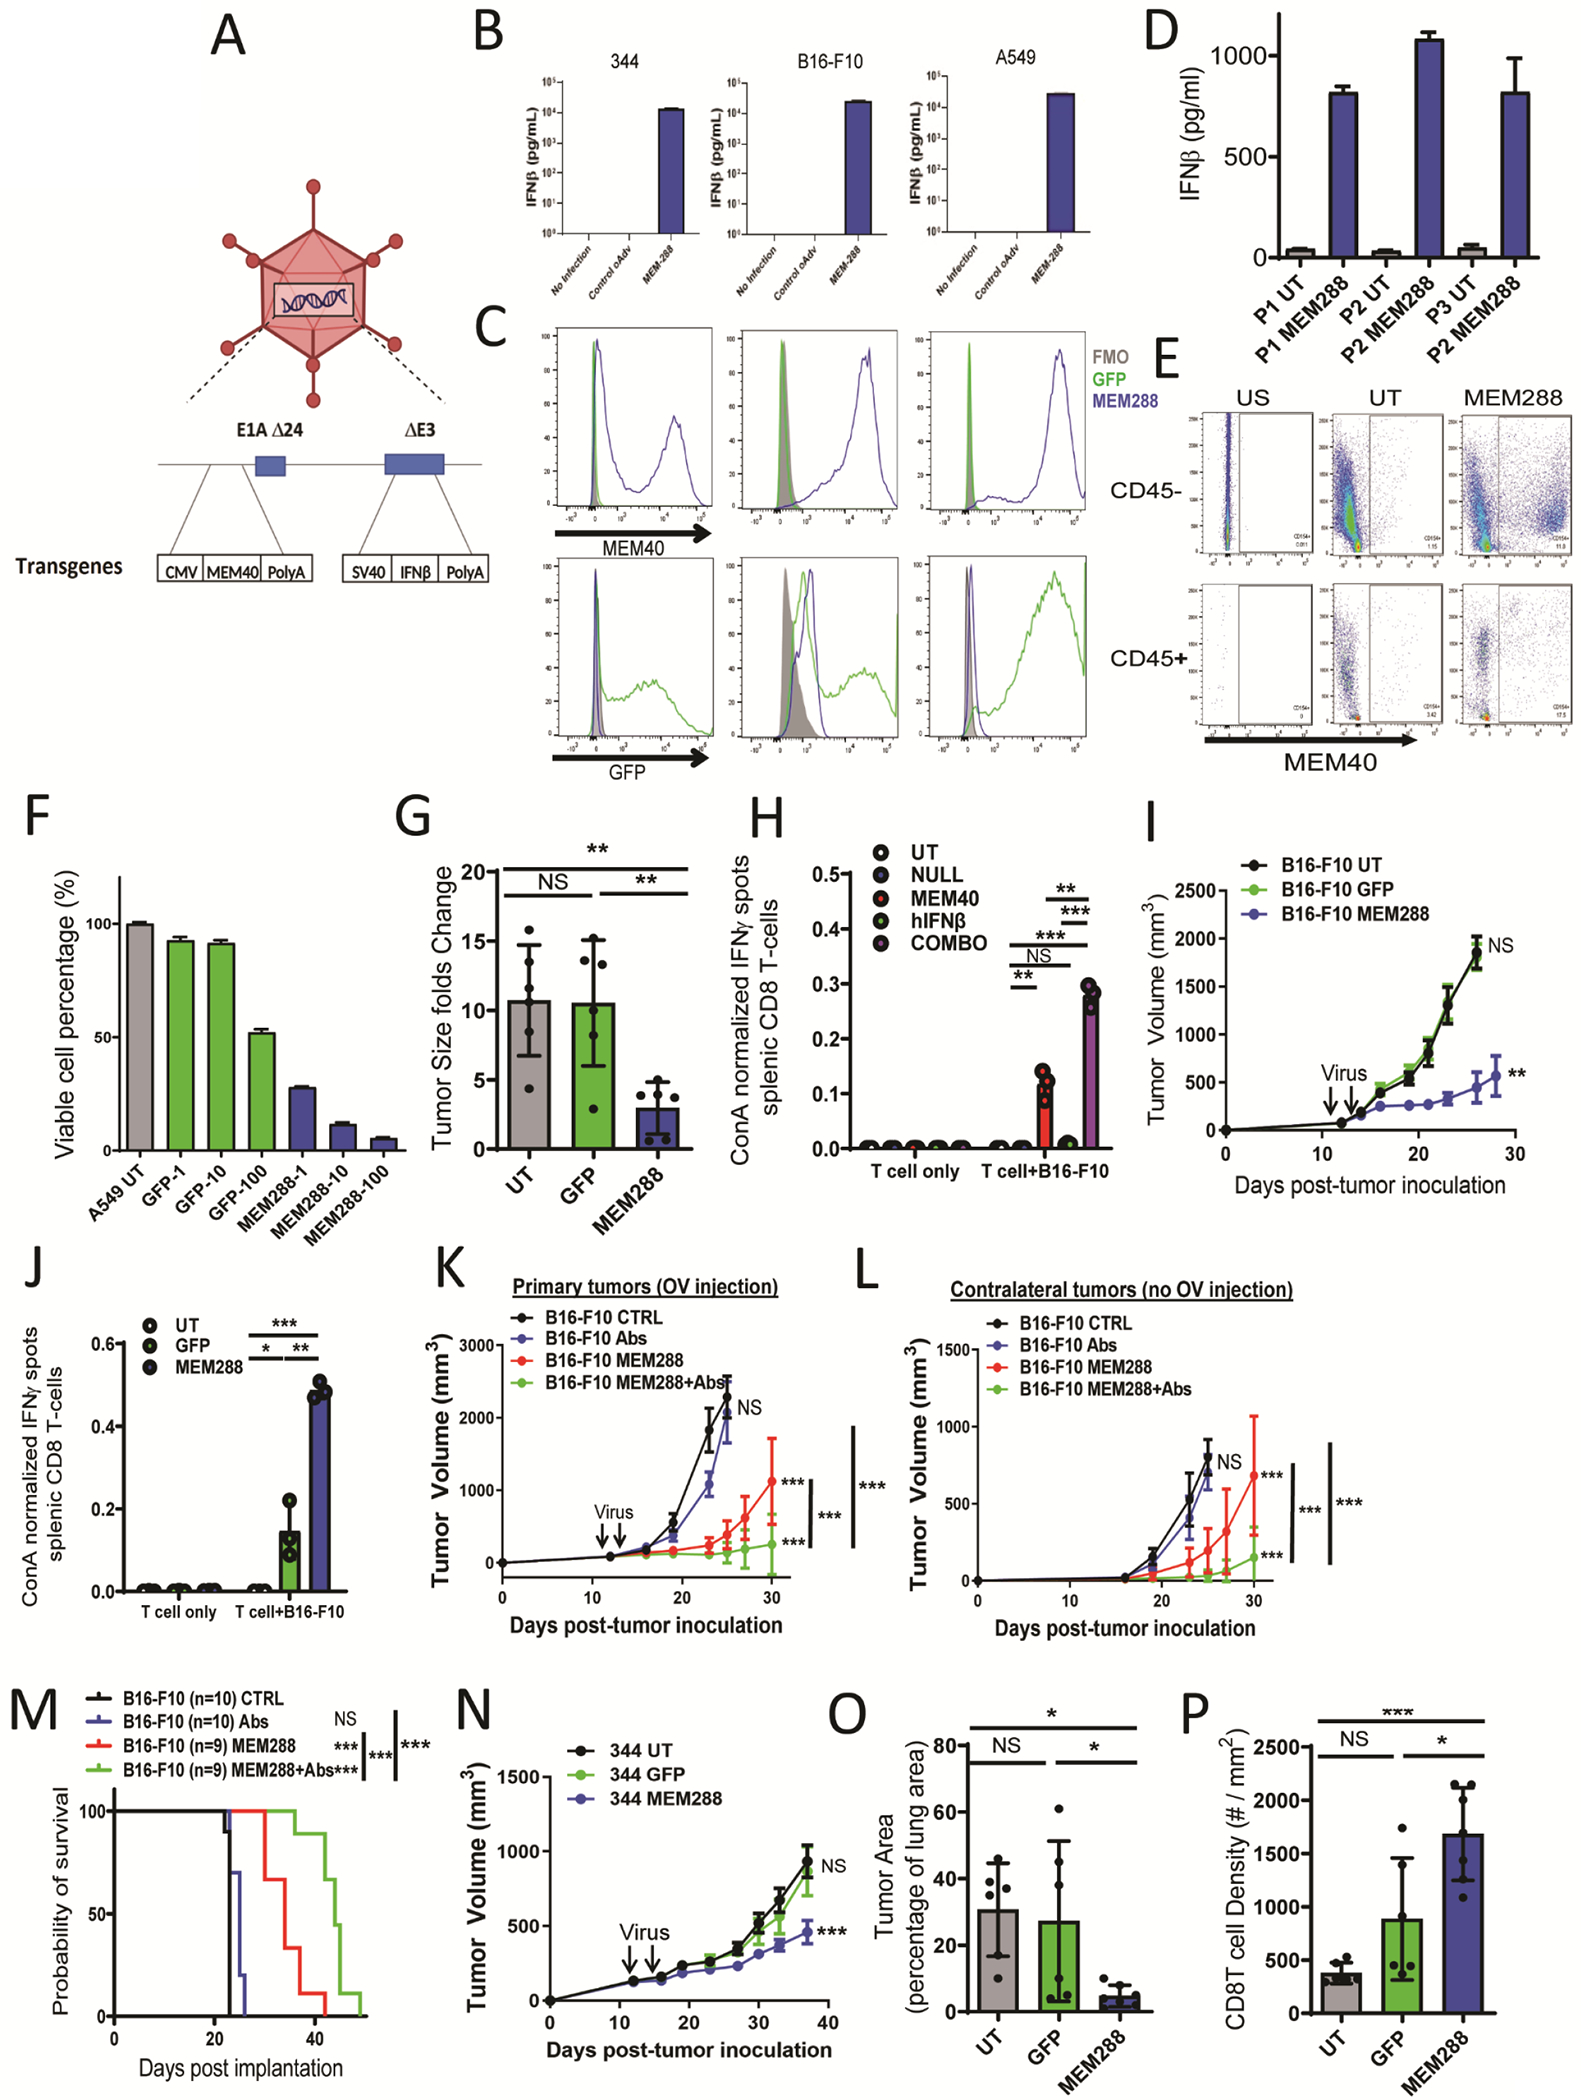
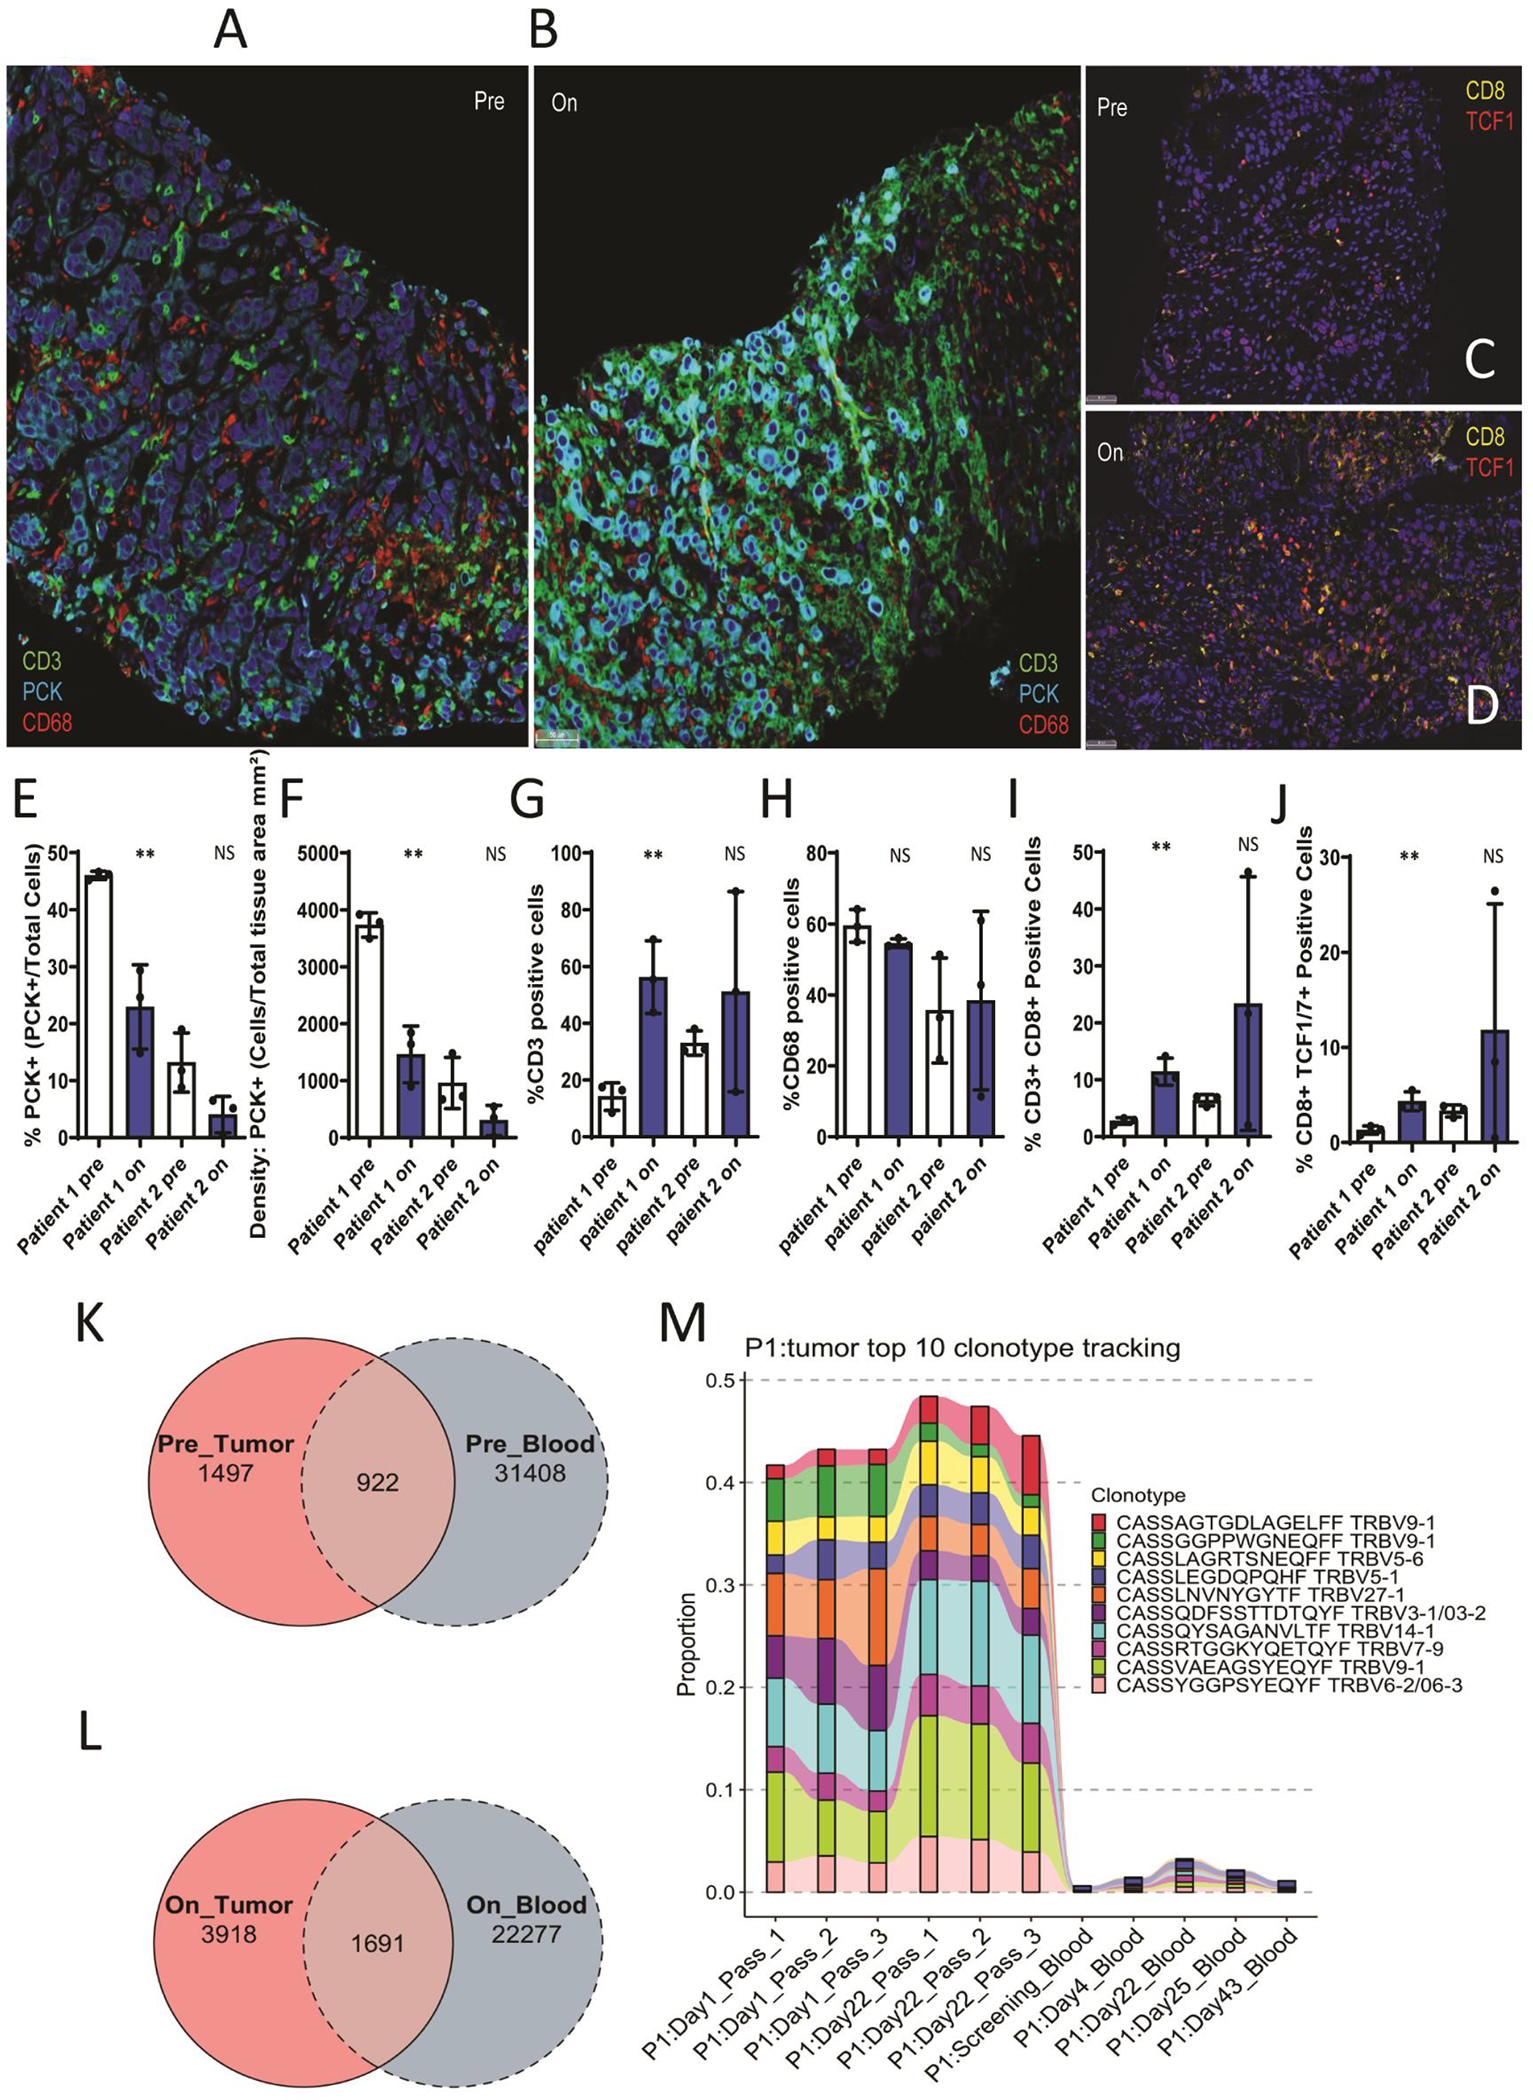
Oncolytic virus therapies induce the direct killing of tumor cells and activation of conventional dendritic cells (cDC); however, cDC activation has not been optimized with current therapies. We evaluated the adenoviral delivery of engineered membrane-stable CD40L (MEM40) and IFNβ to locally activate cDCs in mouse tumor models. Combined tumor MEM40 and IFNβ expression induced the highest cDC activation coupled with increased lymph node migration, increased systemic antitumor CD8+ T-cell responses, and regression of established tumors in a cDC1-dependent manner. MEM40 + IFNβ combined with checkpoint inhibitors led to effective control of distant tumors and lung metastases. An oncolytic adenovirus (MEM-288) expressing MEM40 + IFNβ in phase I clinical testing induced cancer cell loss concomitant with enhanced T-cell infiltration and increased systemic presence of tumor T-cell clonotypes in non-small cell lung cancer (NSCLC) patients. This approach to simultaneously target two major DC-activating pathways has the potential to significantly affect the solid tumor immunotherapy landscape.


Conflict of interest statement

Competing interests

The Moffitt Cancer Center and Memgen have filed patent applications related to this work on which AAB, SJA and MJC are inventors. The patent applications have been licensed to Memgen. AAB and SJA are Memgen Scientific Advisory Board members, MJC is an employee of Memgen. AAB receives grant support from Memgen.

Figures

Figure 1.
Figure 1.. MEM40 and IFNβ trigger strong activation of tumor cDCs.
(A) C57BL/6 mice were inoculated s.c. with 5*e5 B16-F10 cells. On D12, mice were subjected to an intratumoral injection with 10e9 Ad-Null (NULL), 5×10e8 Ad-Null + 5×10e8 Ad-MEM40 (MEM40), 5×10e8 Ad-Null + 5×10e8 Ad-mIFNβ (mIFNβ) or 5×10e8 Ad-MEM40 + 5×10e8 Ad-mIFNβ (COMBO) (n=3 mice/treatment) 3 days after which tumors (or draining lymph nodes, Figure 2) were used for flow cytometry or scRNA-seq. (B) Proportion of CD11c+MHC-II+CD103+ cDC1 among CD45+ cells and (C-F) mean fluorescence intensity (MFI) of indicated activation markers on cDC1 in individual mice 3 days after virus injection. All results are expressed as the means ± SEM. T-test was used to determine significance of differences compared to Ad-Null treated tumors and indicated by p-values (*p<0.05, **p<0.01), NS: not significant. Ad-Null and Ad-MEM40 were not significantly different. Representative results of 1 out of 2 independent experiments are shown. (G) UMAP projections of MHC-II+CD11c+ sorted cells showing 23 clusters colored and labeled by cell types. (H) Bubble plot of selected DC subtype markers genes in DC clusters. Color of dot represents Z-score normalized gene expression in each cluster from high (red) to low (blue). Size of dot represents the percentage of positive cells in each cluster. (I) UMAP projections of MHC-II+CD11c+ sorted cells showing major cell types. (J) percentage composition of cell types after the indicated treatments.
Figure 2.
Figure 2.. MEM40 + IFNβ promotes tumor DC trafficking and activation in draining lymph nodes.
(A) WT and CCR7−/− C57BL/6 mice were inoculated s.c. with 5*e5 B16-F10 cells. On D12, mice were subjected to an intratumoral injection with indicated viruses. Presence of CD11c+MHC-II+CD103+ cDC1 and CD11b+ cDC2 in tumors were determined 3 days after virus injection. (B) Pooled LNs of mice injected with indicated viruses in (A) were used to determine levels of indicated DC subsets: CD103+ cDC1, CD11b+ cDC2, and CD8α+ cDC1. (C) C57BL/6 mice were injected with Zs-Green expressing B16-F10 following which Zs-Green+ and Zs-Green tumor and LN DCs were determined. (D) Presence of CD103+ cDC1 and CD11b+ cDC2 in tumors were determined 3 days after virus injection. (E) Percentage of Zs-Green+ CD103+ cDC1 and CD11b+ cDC2 in tumors were determined out of total cDC1 or cDC2. (F) Percentage of Zs-Green+ in total DCs, (G) CD103+ cDC1, (H) CD11b+ cDC2 and (I) CD8α+ cDC1 in LNs were determined. Representative results of 1 out of 2 independent experiments are shown. T-test was used to determine significance of differences and indicated by p-values *p<0.05, **p<0.01, ***p<0.001. NS: not significant.
Figure 3.
Figure 3.. Distinct and synergistic impact of MEM40 and IFNβ on human DC activation markers.
(A) A549 were infected (with Ad-Null (NULL), Ad-MEM40 (MEM40), Ad-hIFNβ (hIFNβ) or Ad-MEM40 + Ad-hIFNβ (COMBO) at MOI=10 followed by cocultured with human Mo-DCs (CD14+ PBMC were purified and stimulated by IL-4 and GM-CSF for 6 days). 2 days later, all cells were collected for flow cytometry analysis. (B) The expression level of DC markers on the HLA-DR+CD11c+ population are shown along with the mean florescence intensity (MFI) from a single human donor. Results are representative of findings from 2 different donors. (C-D) Secretion of IL12p70 (C) and TNFα (D) was detected by ELISA (n=3). in the supernatant in same cells used for flow cytometry. Representative results of 1 out of 2 independent experiments are shown. All results are expressed as the means ± SEM. Statistical significance was determined by t-test and is indicated as *p<0.05, **p<0.01, ***p<0.001. NS: not significant. (E) RNA-seq was used to determine changes in gene expression after indicated treatments in HLA-DR+CD11c+ sorted DCs derived from monocytes of 3 healthy donors. DC treatment was as in “A”. Heatmap analysis of top ~80 named genes induced in COMBO vs. Ad-Null virus treatment is shown along with individual Ad-MEM40 and Ad-IFNβ treatments. The detection of IFNB1 and CD40LG is likely from contaminating A549 cells in the sorted HLA-DR+CD11c+ population. (F) Heatmap analysis is shown of indicated DC function and activation marker genes. (G) Hallmark pathways analysis of RNA-seq showing differential pathway activation in COMBO vs. Null treatments. Normalized enrichment scores (NES) and FDR controlled p-values are indicated.
Figure 4.
Figure 4.. Combined CD40 and type 1 IFN pathway activation in the TME promotes systemic antitumor T-cell responses: impact of CD40, IFNAR1 or BATF3 deficiency.
(A) C57BL/6 mice were inoculated s.c. with 5*e5 B16-F10 cells (n=5–6 per condition). On D12 and 16, these mice were subjected to 10e9 Ad-Null (NULL), 5×10e8 Ad-Null + 5×10e8 Ad-MEM40 (MEM40), 5×10e8 Ad-Null + 5×10e8 Ad-mIFNβ (mIFNβ) or 5×10e8 Ad-MEM40 + 5×10e8 Ad-mIFNβ (COMBO). PBS injection was used in untreated (UT) group. Significance of tumor growth difference was calculated using two-way ANOVA followed by Tukey multiple comparison test. *P-value was determined in comparison with Ad-Null group. The COMBO treatment also resulted in significantly reduced tumor growth compared to the individual MEM40 and IFNβ treatments (two-way ANOVA followed by Tukey’s multiple comparisons test indicated by vertical lines). (B-D) Percentage of CD8+ T cells, CD103+ cDC1 and CD11b+ cDC2 among live CD45+ cells in the tumor are shown following flow cytometry. (E) IFNγ ELISPOT of CD8+ T cells from spleens of mice (n=3) were cultured alone (T cells only) or with B16-F10. ELISPOT was performed 4 days after the second virus infection. The release of IFNγ by T cells was normalized to ConA treatment–induced release of IFNγ in the same sample T cells. Significance of difference was calculated using t-test. (F) 129 mice (n=4–6) were inoculated s.c. with 5*e5 344SQ cells (indicated as 344) and treated as mice in (A). *P-value (ANOVA) was determined in comparison with Ad-Null group. The COMBO treatment also resulted in significantly reduced tumor growth compared to the individual MEM40 and IFNβ treatments (two-way ANOVA followed by Tukey’s multiple comparisons test indicated by vertical lines). (G) Quantification of tumor burden of lung metastases in mice from “F” out of total lung area. (H) Typical H&E staining of tumors in lungs metastasized from the flank tumor of the mice. (I) Quantification of IFNγ ELISPOT from spleen CD8+ T cells of the 344SQ tumor–bearing mice at D22. (J) C57BL/6 background WT, CD40−/−, and IFNAR1−/− mice were inoculated s.c. with B16-F10 cells. IFNγ ELISPOT of CD8+ T cells from spleens of mice (n=3) were cultured alone (T cell only) or with B16-F10. ELISPOT was performed 4 days after the second virus infection. Individual virus injections were used. (K) COMBO virus was used in WT, CD40−/− and IFNAR1−/− mice. (L) Treatment with individual viruses or (M) COMBO virus in BATF3−/− mice. Significance of difference was calculated using t-test. Representative results of 1 out of 2 independent experiments are shown. All results are expressed as the means ± SEM. Statistical significance is indicated by p-values or as *p<0.05, **p<0.01, ***p<0.001. NS: not significant.
Figure 5.
Figure 5.. Combination of MEM40 + IFNβ and ICIs enhances abscopal antitumor response.
(A) Treatment regimen used in B16-F10 tumor bearing mice (n=7–8). Mice were injected with Ad-MEM40 + Ad-mIFNβ (Advs COMBO), anti-PD-1 (250 ug/mouse) and anti-CTLA-4 (100 ug/mouse) antibodies (Abs) or isotype control antibody (B16-Con) i.p. as indicated. (B-C) Tumor growth was determined on the primary site and contralateral site as indicated. Significance of tumor growth difference was calculated using two-way ANOVA followed by Tukey multiple comparison test. P-value was determined in comparison to CTRL group. Two-way ANOVA followed by Tukey’s multiple comparisons test show differences in individual treatment indicated by vertical lines. (D) Kaplan-Meier survival analysis showing overall survival of the mice in the experiment in (A). P-value was calculated by Mantel-Cox test. (E) 344SQ tumor–bearing mice were subjected to treatments as in (B) (n=4–6). (F) Quantification of tumor burden of lung metastases in mice from (E). All results are expressed as the means ± SEM. Statistical significance is indicated by p-values or as *p<0.05, **p<0.01, ***p<0.001. NS: not significant.
Figure 6.
Figure 6.. Generation and in vivo testing of MEM-288 oncolytic adenovirus.
(A) Schematic representation of MEM-288. (B-C) 344SQ, B16-F10 mouse cell lines and A549 human cell line were infected with OVs Ad-GFP (GFP) or MEM-288 (288) (MOI=10), secretion of IFNβ was detected by ELISA (B) and MEM40 and GFP was detected by flow cytometry (C). (D-E) Freshly resected human NSCLC tumors were injected with MEM-288. Secretion of IFNβ was detected by ELISA (D) and MEM40 was detected in CD45 and CD45+ cells by flow cytometry (E). (F) A549 human lung cancer cells were infected with indicated OVs Ad-GFP (GFP) or MEM-288 (288) at different indicated MOIs (1, 10, 100) for 2 days. Cell viability was determined by trypan blue staining assay. (G) A549-luciferase expressing tumors in SCID mice were injected with 2 injections of 10e9 of Ad-GFP or MEM-288 (one week apart) and bioluminescence imaging (BLI) was used to detect tumor growth over 3 weeks. Quantification of the change in BLI signal from before virus injection is shown. (H) IFNγ ELISPOT was performed using spleen CD8+ T cells after injection of B16-F10 tumors with replication-deficient Ad-(human) hIFNβ, Ad-MEM40 and the combination. (I) B16-F10 tumors were injected with oncolytic Ad-GFP or MEM-288 at 10e9 IU on D12 and 16 into the tumors (n=9). Significance of tumor growth difference was calculated using two-way ANOVA. (J) Quantification of IFNγ ELISPOT using spleen CD8+ T cells 4 days after the second virus infection. (K-L) Treatment regimen was as in Fig. 5A (n=9–10 per group). Mice were injected with MEM-288 at 10e9 IU on D12 and 16 into primary tumors and with anti-PD-1 and anti-CTLA-4 i.p. on D16, D19, D23 and 27. Two-way ANOVA followed by Tukey’s multiple comparisons test show differences in individual treatment indicated by vertical lines. (M) Kaplan-Meier survival nalysis showing overall survival of the mice. P-value was calculated by Mantel-Cox test. (N) 129 mice were inoculated s.c. with 5*e5 344 cells on the flank and subjected to oncolytic Ad-GFP, or MEM-288 at 10e9 IU on D12 and 16 into the tumors (n=6–7 per group). Tumor growth was determined on the primary site as indicated. (O) Quantification of tumor burden of lung metastases out of total lung area. (P) Quantification of CD8+ T-cell density in tumor indicated out of mm2 of tumor area. All results are expressed as the means ± SEM. Statistical significance was determined by t-test and is indicated by p-values or as *p<0.05, **p<0.01, ***p<0.001. NS: not significant.
Figure 7.
Figure 7.. MEM-288 modulation of the TME and systemic T-cell immunity in NSCLC.
(A-D) mIF was performed using pre- and on-treatment biopsies with indicated markers and DAPI on 2 patients. (E-J) Changes in PCK+ cell percentage and density, and percentage of indicated cell types out of total DAPI+ cells in pre- and on-treatment tumors. All results (n=3) are expressed as the means ± SEM. Statistical significance was determined by t-test and is indicated by p-values or as *p<0.05, **p<0.01, ***p<0.001. NS: not significant. (K-L) Shared clonotypes between tumors (all 3 passes), tumor and blood, and total blood clonotypes pre-treatment and on-treatment. (M) Top-10 tumor clonotypes in pre-treatment and on-treatment biopsies of 1 patient were tracked in peripheral blood at indicated timepoints.

References

    1. Chen DS, Mellman I. Elements of cancer immunity and the cancer-immune set point. Nature 2017;541(7637):321–30 doi 10.1038/nature21349. - DOI - PubMed
    1. Herbst RS, Soria JC, Kowanetz M, Fine GD, Hamid O, Gordon MS, et al. Predictive correlates of response to the anti-PD-L1 antibody MPDL3280A in cancer patients. Nature 2014;515(7528):563–7 doi 10.1038/nature14011. - DOI - PMC - PubMed
    1. Joyce JA, Fearon DT. T cell exclusion, immune privilege, and the tumor microenvironment. Science 2015;348(6230):74–80 doi 10.1126/science.aaa6204. - DOI - PubMed
    1. Tumeh PC, Harview CL, Yearley JH, Shintaku IP, Taylor EJ, Robert L, et al. PD-1 blockade induces responses by inhibiting adaptive immune resistance. Nature 2014;515(7528):568–71 doi 10.1038/nature13954. - DOI - PMC - PubMed
    1. Ribas A, Medina T, Kummar S, Amin A, Kalbasi A, Drabick JJ, et al. SD-101 in Combination with Pembrolizumab in Advanced Melanoma: Results of a Phase Ib, Multicenter Study. Cancer discovery 2018;8(10):1250–7 doi 10.1158/2159-8290.CD-18-0280. - DOI - PMC - PubMed

Publication types