. 2023 Mar 15;133(6):e161944.
doi: 10.1172/JCI161944.

A terpene nucleoside from M. tuberculosis induces lysosomal lipid storage in foamy macrophages

Affiliations

A terpene nucleoside from M. tuberculosis induces lysosomal lipid storage in foamy macrophages

Melissa Bedard et al. J Clin Invest. .

Abstract

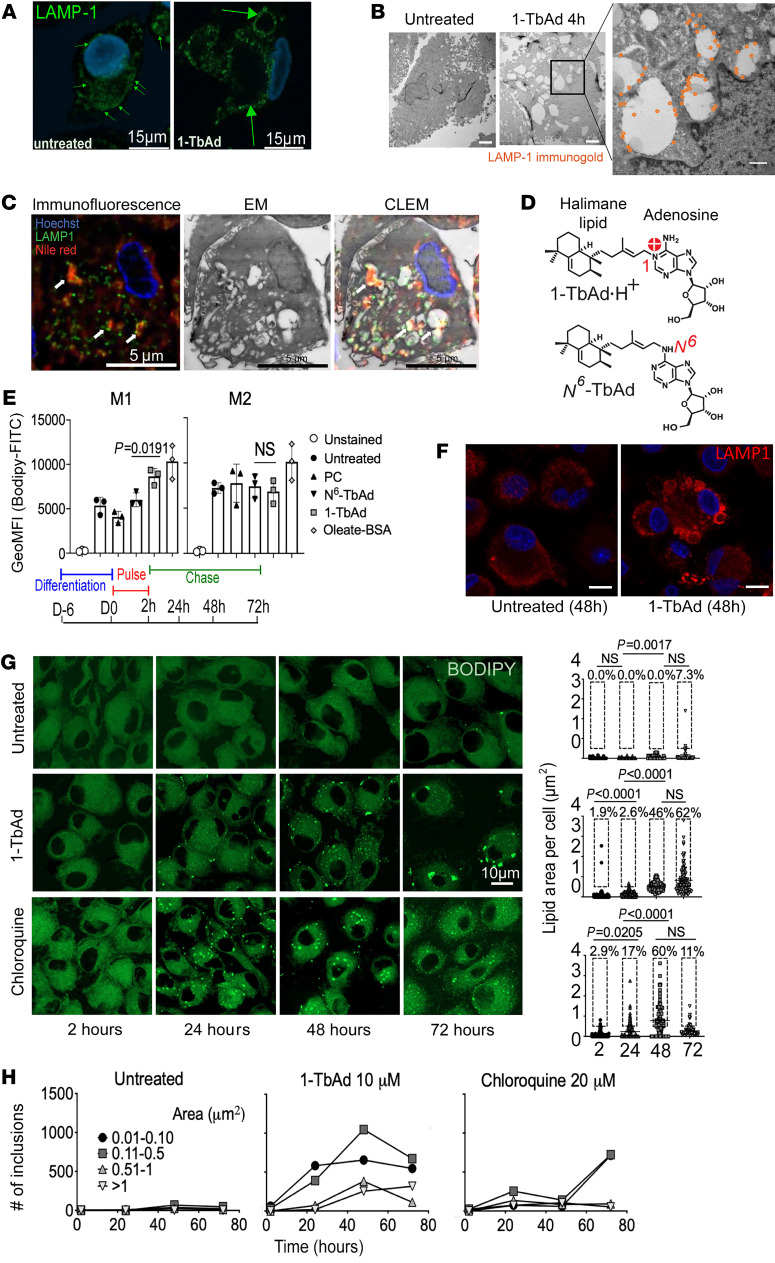
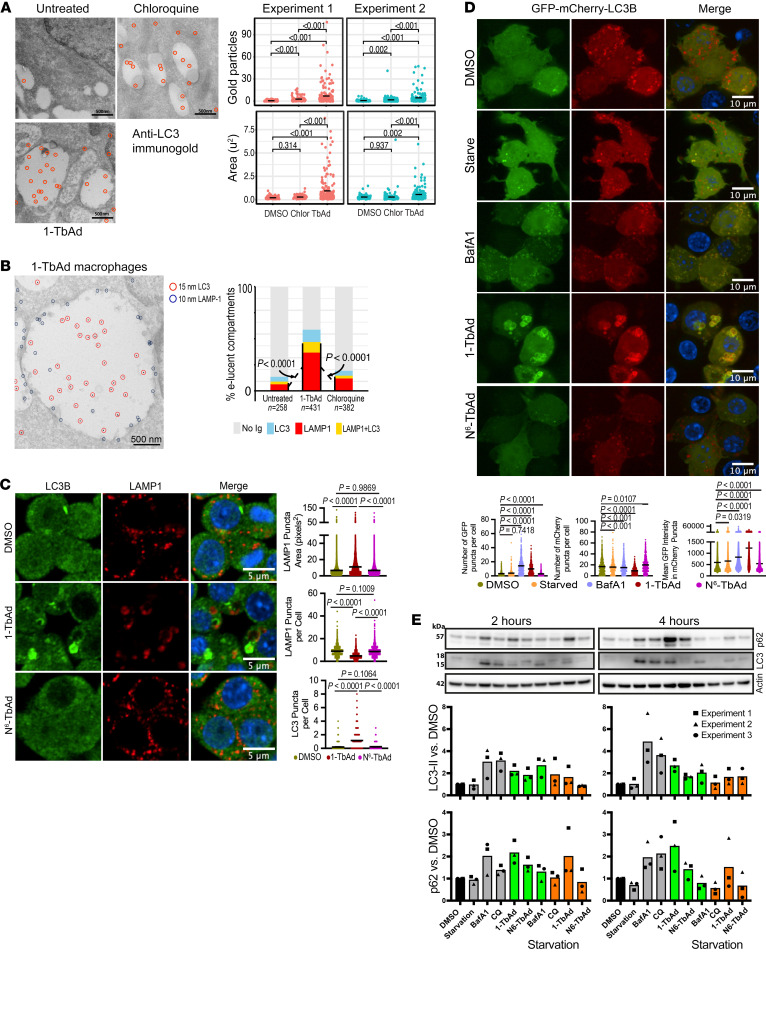
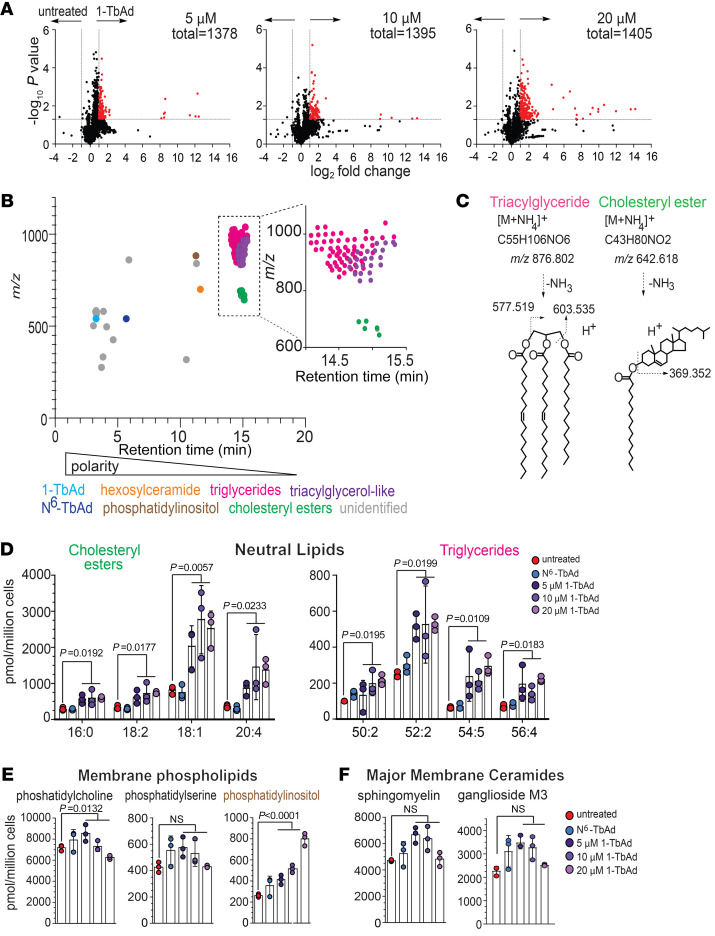
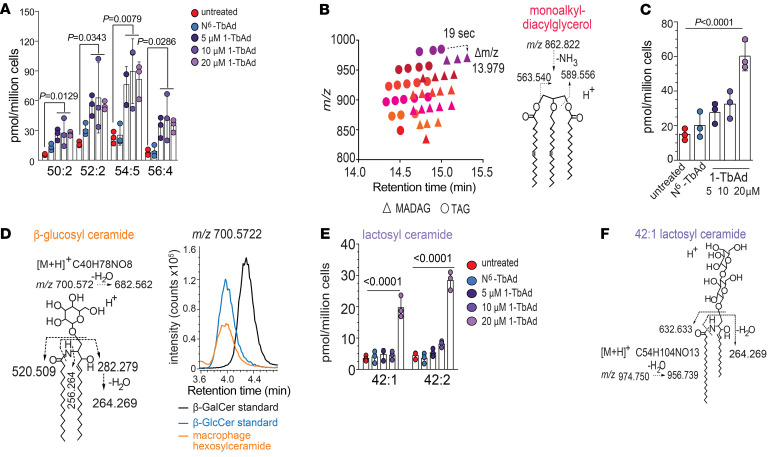
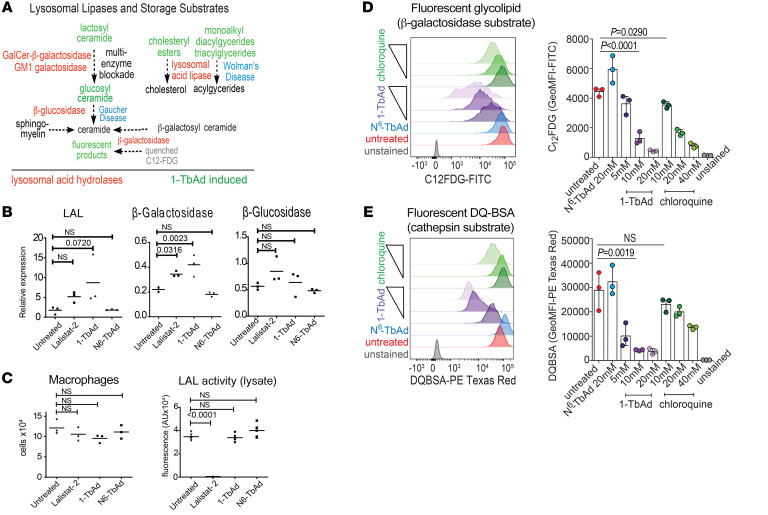
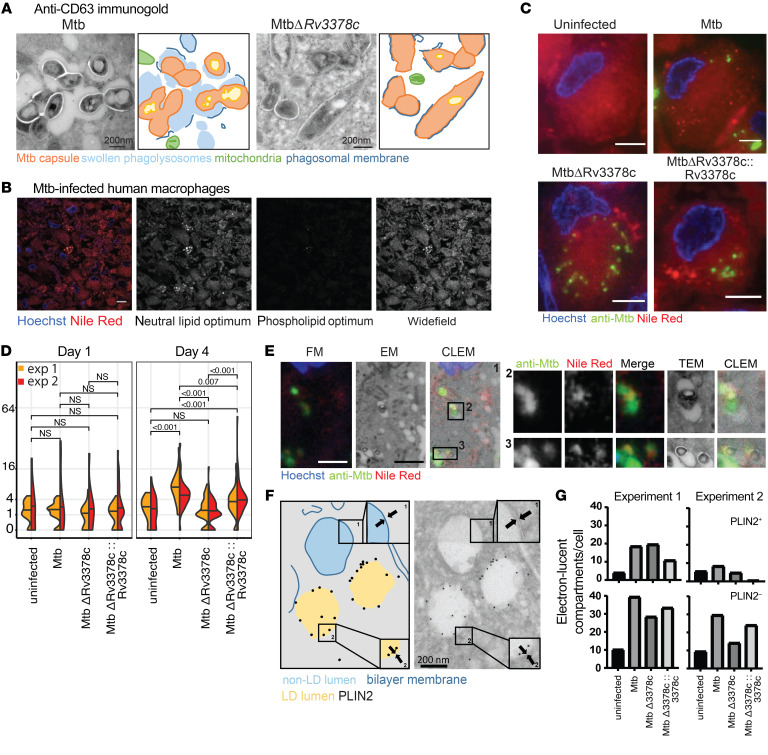
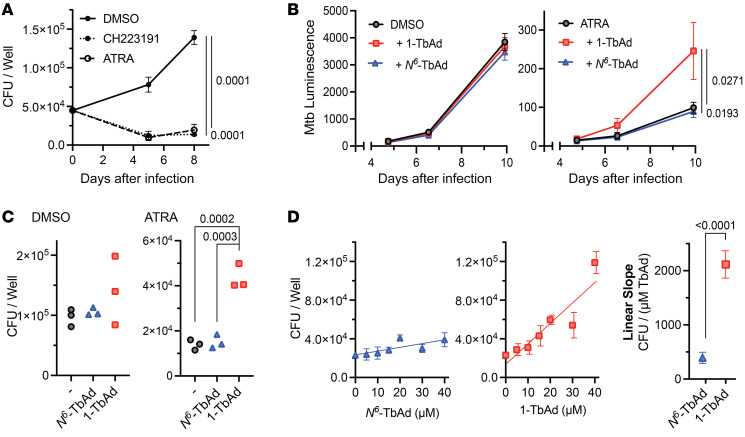
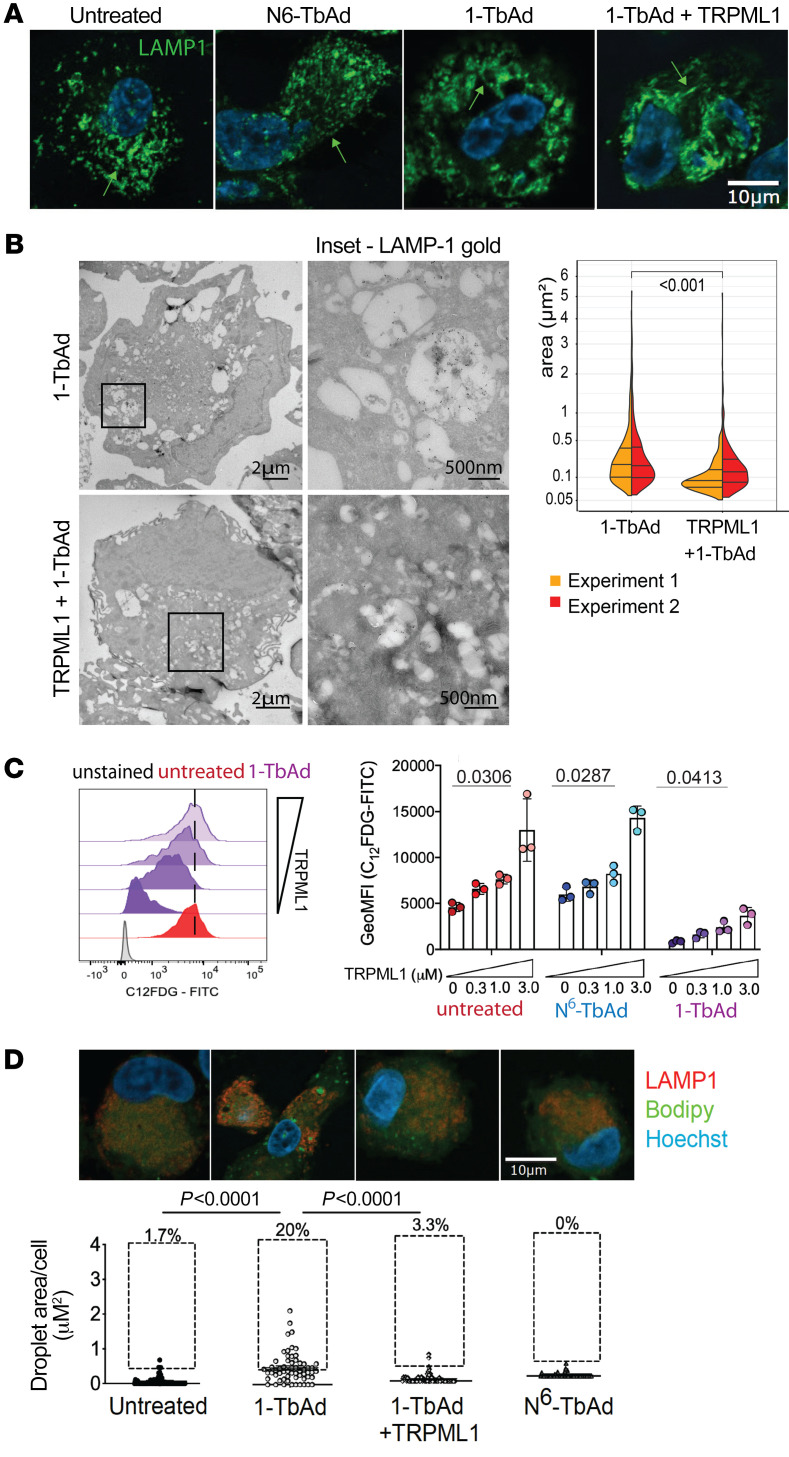
Induction of lipid-laden foamy macrophages is a cellular hallmark of tuberculosis (TB) disease, which involves the transformation of infected phagolysosomes from a site of killing into a nutrient-rich replicative niche. Here, we show that a terpenyl nucleoside shed from Mycobacterium tuberculosis, 1-tuberculosinyladenosine (1-TbAd), caused lysosomal maturation arrest and autophagy blockade, leading to lipid storage in M1 macrophages. Pure 1-TbAd, or infection with terpenyl nucleoside-producing M. tuberculosis, caused intralysosomal and peribacillary lipid storage patterns that matched both the molecules and subcellular locations known in foamy macrophages. Lipidomics showed that 1-TbAd induced storage of triacylglycerides and cholesterylesters and that 1-TbAd increased M. tuberculosis growth under conditions of restricted lipid access in macrophages. Furthermore, lipidomics identified 1-TbAd-induced lipid substrates that define Gaucher's disease, Wolman's disease, and other inborn lysosomal storage diseases. These data identify genetic and molecular causes of M. tuberculosis-induced lysosomal failure, leading to successful testing of an agonist of TRPML1 calcium channels that reverses lipid storage in cells. These data establish the host-directed cellular functions of an orphan effector molecule that promotes survival in macrophages, providing both an upstream cause and detailed picture of lysosome failure in foamy macrophages.

Keywords: Infectious disease; Macrophages; Microbiology; Tuberculosis.


Figures

Figure 1
Figure 1. 1-TbAd induces swelling of LAMP1 compartments and lipid overload in macrophages.
(A) LAMP1+ lysosomes in human M1 macrophages lacked visible lumina and thus appeared as puncta (small green arrows), but 1-TbAd treatment generated swollen lysosomes that appeared as rings (large green arrows). Scale bars: 15 μm. (B) Transmission EM (TEM) of human macrophages stained with LAMP1 immunogold (orange) shows swollen electron-lucent lysosomes with intralysosomal inclusions after treatment with 1-TbAd (10 μM) for 4 hours. Scale bars: 1 μm (left), 2 μm (middle), 500 nm (enlarged inset).(C) Macrophages treated as in B underwent deconvoluted CLEM. Arrows indicate colocalization of LAMP1 and lipid bodies. Scale bars: 5 μm. (D) Synthetic N6-TbAd is a 1-TbAd isomer that lacks the 1-linkage needed for lysosomotropic action. (E) Whole-cell BODIPY staining of monocyte-derived M1 and M2 macrophages treated with the indicated lipid or high-dose oleate-BSA as a positive control for lipid overload. (F) Human alveolar macrophages were treated with 10 mM 1-TbAd for 48 hours, leading to conversion of LAMP1 puncta to ringed structures. Scale bars: 5 μm. (G) A pulse-chase analysis of BODIPY staining in human M1 macrophages was tracked for total lipids, measured as the area per cell. BODIPY+ lipid inclusions were binned by size and tracked separately over time. Scale bar: 10 μm.
Figure 2
Figure 2. 1-TbAd causes the accumulation of autophagosomes due to blockage of autophagic flux.
(A and B) M1 macrophages treated with chloroquine or 1-TbAd (20 μM) for 2 hours were immunogold labeled for LC3, LAMP1, or both markers. The area (μm2) of electron-lucent compartments was measured and the number of gold particles were counted per compartment. Double-immunogold labeling was scored as no label (<3 particles) or labeled (>3 particles), with subgroups of LAMP1 single positive, LC3B single positive, and LAMP1 AND LC3B double positive. Single LC3 analysis used a linear model with a negative binomial fit, with P values determined by factorial ANOVA and Tukey’s post test. Linear mixed models treated the double label as a random effect variable (χ2 P << 0.0001). For single and double labels, P values were determined by least squares mean post-test after factorial ANOVA and adjustment by Tukey’s method. (C) RAW264.7 macrophages stimulated for 4 hours were analyzed by immunofluorescence for LC3B recruitment to LAMP1+ compartments. Scale bars: 5 μm. One representative experiment of 3 experiments is shown. P values were determined by Browne-Forsythe ANOVA followed by Games-Howell’s multiple comparisons. (D) RAW264.7 macrophages transiently expressing GFP-mCherry-LC3B were treated with vehicle (DMSO), BafA1, 1-TbAd, or N6-TbAd for 4 hours and then fixed. Black bars indicate the mean values and the data are representative of 3 experiments. *P < 0.05, ***P < 0.001, and ****P < 0.0001, by Browne-Forsythe ANOVA followed by Games-Howell’s multiple-comparison test. Scale bars: 10 μm. (E) In 3 experiments, RAW264.7 macrophages were stimulated for 2 hours or 4 hours and then subjected to Western blotting.
Figure 3
Figure 3. Lipidomic analysis of 1-TbAd–induced lipid storage in macrophages.
(A) Human macrophages were treated in biological triplicate and normalized to the cell number prior to lipid extraction. Positive-mode HPLC-MS lipidomics data sets were aligned, and intensity ratios for every detected lipid allowed the identification of changed molecular events (red, P < 0.05, >2-fold). (B) Unique changed molecular events were plotted by retention time and m/z, where structurally related molecules cluster. (C) Lead ions in TAG and CE clusters were identified on the basis of the mass of ammonium adducts and the diagnostic cleavage. (DF) The quantities of PC, PS, PI, and sphingomyelin (SM) were assigned on the basis of authentic standard curves (Supplemental Figure 7). The GM3 structure was solved by CID-MS and coelution with an authentic standard (Supplemental Figure 8). P values in DF were determined by 1-way ANOVA followed by a post test for linear trend.
Figure 4
Figure 4. 1-TbAd induces storage of known substrates in lysosomal storage diseases.
(A) Unknown lipids could be linked on a 1-to-1 basis with TAGs (dashed arrow) based on retention time (~19 s) and mass (13.979 mu) increments, which correspond to an ether linkage substituting an ester linkage, suggesting that the unknowns were MADAGs. (B) The MADAG structure was confirmed by CID-MS. (C) After quantitation using TAG as the external standard, the dose response to 1-TbAd of 4 MADAGs with the indicated chain length and saturation pattern was reported. P values were determined by 1-way ANOVA followed by post test for linear trend. (D) The 1-TbAd–induced hexosylceramide in macrophages matches the structure of β-glucosylceramide, based on CID-MS and coelution with an authentic internal standard. (E) A C42:2 dihexosylceramide induced by 1-TbAd was solved as LacCer, based on CID-MS and coelution with an authentic standard. The P values for A, C, and E were determined by 1-way ANOVA followed by Dunnett’s multiple-comparison test.
Figure 5
Figure 5. Analysis of 1-TbAd effects on enzymes and substrates known from human lysosomal storage diseases.
(A) The known relationships among substrates that define human genetic lysosomal storage diseases are indicated (53), emphasizing products that are 1-TbAd induced (green) or involved in eponymous lysosomal storage diseases (blue). (B) Human macrophages were treated with 20 μM 1-TbAd for 4 hours and subjected to RT-PCR. (C) Human M1 macrophages were treated with TbAd (20 μM) or lalistat-2 (100 μM), counted, and then lysed to fluorometrically measure turnover of P-PMHC as a quantitative measure of LAL action. P values were derived from an ordinary 1-way ANOVA with Dunnett’s multiple-comparison test. (D and E) Human macrophages were pretreated with the indicated compounds, followed by flow cytometric measurement of glycolipid (C12FDG) or protein (DQ-BSA) probes. P values were determined by the Kruskal-Wallis multiple-comparison test.
Figure 6
Figure 6. M. tuberculosis–produced 1-TbAd induces lipid accumulation in human macrophages.
(A) Human M1 macrophages were infected with M. tuberculosis or MtbΔRv3378c for 4 days, as reported previously (32), and were then subjected to anti-CD63 staining and annotated. Scale bars: 200 nm. (B) In a separate infection with WT M. tuberculosis, representative TEM images taken over 4 days showed lysosomal swelling. (CE) Immunofluorescence images of human M1 macrophages infected for 4 days were stained with Hoechst (blue), anti–M. tuberculosis protein (green), and lipids with Nile red (red). The Nile red images were captured in excitation/emission detection windows that allowed broad detection of lipids (wide-field, 532–538 nm/570 nm), as well as detection of neutral lipids (515 nm/585 nm) and phospholipids (554 nm/638 nm). Wide-field Nile red puncta were quantified in 2 experiments with 35–56 cells for each infection condition. P values in panel D were determined by a least-squares means post test with adjustment by Tukey’s method after fitting a generalized linear mixed model and factorial ANOVA (overall P < 0.001 for strain). Data from 2 experiments were pooled after determining that the model fit was unchanged. In panel E, CLEM analysis of human macrophages infected for 4 days identified infected compartments and the limiting membranes of infected phagosomes with visible bacilli, along with staining for lipids (Nile red) and anti–M. tuberculosis antisera. Scale bars: 5 μm (B, C, and E). FM, fluorescence microscopy. (F and G) Human macrophages were infected with M. tuberculosis for 4 days, followed by staining with anti-PLIN2 immunogold. High-magnification images (insets 1 and 2) show a membrane bilayer and monolayer, respectively. In 2 independent experiments, 3,661 electron-lucent compartments stained with (PLIN2+) and without (PLIN2) immunogold were counted in 9–17 cells per condition.
Figure 7
Figure 7. 1-TbAd reduces macrophage control of M. tuberculosis.
(AC) Mouse BMDMs were infected with M. tuberculosis (MOI = 2) for approximately 6 hours, pulsed with TbAd for 3 hours, and then treated with ATRA (10 μM), CH223191 (3 μM), or DMSO. Macrophages were infected with M. tuberculosis, with or without a 20 μM TbAd pulse, followed by measurement of CFU (A) bacterial luminescence reporters (B and C) for 10 days (C) or 7 days (B). (D) Macrophages were infected with WT M. tuberculosis, pulsed with TbAd, and treated with ATRA (10 μM) for 6 days prior to CFU measurement. Statistical comparisons in AC)were performed using an ordinary 1-way ANOVA with Tukey’s or Šídák’s multiple-comparison test (all comparisons tested, P values are shown where P < 0.05). Comparisons with multiple time points (A and B) were performed on AUC data. Statistical comparison of slopes in D was performed using an unpaired t test.
Figure 8
Figure 8. TRPML1 agonism prevents 1-TbAd effects on macrophages.
(A) Human M1 macrophages were pretreated with TRPML1 agonist for 1 hour, followed by incubation with 10 μM 1-TbAd for 4 hours. Scale bar: 10 μm. (B) Cells treated as in A were labeled with 10 nm immunogold and anti-LAMP1. Insets of representative images show electron-lucent compartment inclusions (upper right), while agonist-treated macrophages contained smaller electron-lucent compartments (lower right). The area (μm2) of electron-lucent lysosomal compartments was determined using the least-squares mean post test with adjustment by Tukey’s method after factorial ANOVA of a linear mixed model fit that treated each cell as a random effect variable. Scale bars: 2 μm and 500 nm (enlarged insets). (C) Human M1 macrophages loaded with the C12FDG were treated as in A in biological triplicate in 2 experiments. (D) Human M1 macrophages treated as in A were subjected to BODIPY and anti-LAMP1 staining followed by BODIPY quantitation with the Kruskal-Wallis test. The results are representative of 3 experiments. Scale bar: 10 μm.

Comment in

  • The fat is in the lysosome: How Mycobacterium tuberculosis tricks macrophages into storing lipids

References

    1. Yates RM, et al. The kinetics of phagosome maturation as a function of phagosome/lysosome fusion and acquisition of hydrolytic activity. Traffic. 2005;6(5):413–420. doi: 10.1111/j.1600-0854.2005.00284.x. - DOI - PubMed
    1. Xu H, Ren D. Lysosomal physiology. Annu Rev Physiol. 2015;77:57–80. doi: 10.1146/annurev-physiol-021014-071649. - DOI - PMC - PubMed
    1. Vandal OH, et al. Acid resistance in Mycobacterium tuberculosis. J Bacteriol. 2009;191(15):4714–4721. doi: 10.1128/JB.00305-09. - DOI - PMC - PubMed
    1. Chandra P, et al. Mycobacterium tuberculosis inhibits RAB7 recruitment to selectively modulate autophagy flux in macrophages. Sci Rep. 2015;5:16320. doi: 10.1038/srep16320. - DOI - PMC - PubMed
    1. Romagnoli A, et al. ESX-1 dependent impairment of autophagic flux by Mycobacterium tuberculosis in human dendritic cells. Autophagy. 2012;8(9):1357–1370. doi: 10.4161/auto.20881. - DOI - PMC - PubMed

Publication types

LinkOut - more resources