. 2023 Apr 3;133(7):e165863.
doi: 10.1172/JCI165863.

EMT-activated secretory and endocytic vesicular trafficking programs underlie a vulnerability to PI4K2A antagonism in lung cancer

Affiliations

EMT-activated secretory and endocytic vesicular trafficking programs underlie a vulnerability to PI4K2A antagonism in lung cancer

Xiaochao Tan et al. J Clin Invest. .

Abstract

Hypersecretory malignant cells underlie therapeutic resistance, metastasis, and poor clinical outcomes. However, the molecular basis for malignant hypersecretion remains obscure. Here, we showed that epithelial-mesenchymal transition (EMT) initiates exocytic and endocytic vesicular trafficking programs in lung cancer. The EMT-activating transcription factor zinc finger E-box-binding homeobox 1 (ZEB1) executed a PI4KIIIβ-to-PI4KIIα (PI4K2A) dependency switch that drove PI4P synthesis in the Golgi and endosomes. EMT enhanced the vulnerability of lung cancer cells to PI4K2A small-molecule antagonists. PI4K2A formed a MYOIIA-containing protein complex that facilitated secretory vesicle biogenesis in the Golgi, thereby establishing a hypersecretory state involving osteopontin (SPP1) and other prometastatic ligands. In the endosomal compartment, PI4K2A accelerated recycling of SPP1 receptors to complete an SPP1-dependent autocrine loop and interacted with HSP90 to prevent lysosomal degradation of AXL receptor tyrosine kinase, a driver of cell migration. These results show that EMT coordinates exocytic and endocytic vesicular trafficking to establish a therapeutically actionable hypersecretory state that drives lung cancer progression.

Keywords: Cancer gene therapy; Cell Biology; Lung cancer; Oncogenes; Oncology.


Conflict of interest statement

Conflict of interest: JMK has received consulting fees from Halozyme.

Figures

Figure 1
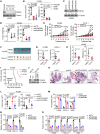
Figure 1. ZEB1 executes a PI4KB-to-PI4K2A enzymatic switch.
(A) Heatmap illustration of mRNA expression levels in TCGA LUAD and LUSC cohorts (n = 1,016 tumors). An EMT score calculated for each tumor, as described previously (65), was correlated with each PI4K family member or, as a comparison, with the EMT-activating transcription factor using Pearson’s coefficient (r value). (B) qPCR analysis of PI4K2A and PI4KB mRNA levels in human lung cancer cell lines classified as epithelial (E) or mesenchymal (M). (C and D) WB analysis of PI4K2A, PI4KB, and ZEB1 levels in epithelial (C) or mesenchymal (D) cells subjected to ZEB1 gain or loss of function, respectively. Relative densitometric values are shown under the gel lanes. α-Tubulin was used as a loading control. Empty vector (Vec), scrambled control (siCTL), and ZEB1 (siZEB1) siRNAs were used. (E) WB analysis of PI4K2A in cells transfected with miR mimics. (F) PI4K2A 3′-UTR reporter assays. H1299 cells were cotransfected with miR mimics and reporters containing WT or miR-182/-183 binding site mutant 3′-UTRs (n = 4 replicates per condition). (GI) PI4P ELISA in siRNA-transfected H1299 (G), H441 (H), and HCC827 (I) cells. Data indicate the mean ± SD from a single experiment incorporating biological replicate samples (n = 3, unless otherwise indicated) and are representative of at least 2 independent experiments. *P < 0.05, **P < 0.01, and ***P < 0.001, by 2-tailed Student’s t test for 2-group comparisons (B); 1-way ANOVA test for multiple comparisons (FI). miR-NC, negative control mimic.
Figure 2
Figure 2. ZEB1 executes a PI4K2B-to-PI4K2A enzymatic switch.
(A) qPCR analysis of ACBD3 mRNA levels in the cell lines (dots) described in Figure 1B. (B and C) WB analysis of ACBD3 protein levels in epithelial (B) and mesenchymal (C) cells subjected to ZEB1 gain or loss of function, respectively. (D and E) PI4P ELISA in mesenchymal (D) and epithelial (E) cells subjected to ACBD3 gain or loss of function, respectively. (F) Schema showing constructs containing MS2 binding sites (12X) fused downstream of a WT or mutant (MT) ACBD3 3′-UTR lacking the miR-34a–binding site (BS). (G) MS2-based RIP. MS2-UTR–associated miR-34a was quantified as fold enrichment values relative to MS2. miR-200b was included as a negative control. (H and I) WB analysis of ACBD3 and ZFP36L1 levels in cells transfected with miR mimics (H) or siRNAs (I). (J and K) WB analysis of ZFP36L1 levels in cell lysates (input), an MS2-based RIP complex (GFP), or a negative control IP (IgG). (L) Schema of the working model. ZEB1 executes a PI4KB-to-PI4K2A dependency switch by silencing miR-34a and miR-182/-183. Data indicate the mean ± SD from a single experiment incorporating biological replicate samples (n = 3, unless otherwise indicated) and are representative of at least 2 independent experiments. P values were determined by 2-tailed Student’s t test for 2-group comparisons (A, D, and E); 1-way ANOVA test for multiple comparisons.
Figure 3
Figure 3. PI4K2A is a therapeutic target in mesenchymal lung cancer cells.
(A) WB analysis confirming target gene deletion in PI4K2A-KO H1299 cells. (B) Orthotopic lung tumor size (left plot) and mediastinal and contralateral lung metastasis numbers (right plot) generated in nude mice (dots) by the intrathoracic injection of cells described in A. (C) WB analysis confirming target gene depletion in shRNA-transfected 344SQ cells. (D) Tumor weights (left plot) and lung metastasis numbers (right plot) generated in syngeneic, immunocompetent mice (dots) by subcutaneous injection of the cells described in C. (E) Daily subcutaneous tumor volume measurements (dots) in nude mice treated with PI-273 or vehicle (DMSO). (F and G) Tumor tissues removed at necropsy in E were imaged (F) and weighed (G). (H) Orthotopic lung tumor size (left plot) and metastasis numbers (right plot) in nude mice treated with PI-273 or vehicle. (I) Kaplan-Meier survival analysis of mice bearing orthotopic lung tumors treated with PI-273 or DMSO. (J) WB analysis demonstrating reconstitution of shPI4K2A-transfected H1299 cells (shUTR) with WT or enzyme-dead mutant (D308A) PI4K2A. Empty vector (Vec). (K) Orthotopic lung tumors (arrows) generated in nude mice by the cells in J. Scale bars: 5 mm. (L) Orthotopic lung tumor size (left plot) and metastasis numbers (right plot). (M) Annexin V/propidium iodide flow cytometric analysis of the apoptotic fraction in siRNA-transfected cells. (N) Colonies formed in soft agar by siRNA-transfected cells. Values are expressed relative to siCTL. (O) Boyden chamber migration and invasion assays on siRNA-transfected cells. Values are expressed relative to siCTL. Data indicate the mean ± SD from a single experiment incorporating biological replicate samples (n = 3, unless otherwise indicated) and are representative of at least 2 independent experiments. P values were determined by 2-tailed Student’s t test for 2-group comparisons (EH); 1-way ANOVA test for multiple comparisons (B, D, and LO; and log-rank test (I). shCTL, control shRNA.
Figure 4
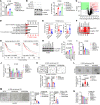
Figure 4. PI4K2A activates a prometastatic secretory program.
(A) Relative soft agar colony numbers. siRNA-transfected H1299 cells were treated with CM samples from siRNA-transfected H1299 cells. (B) Apoptosis assays on siRNA-transfected H1299 cells treated with CM samples. WB analysis of cleaved PARP1 (C-PARP1) and PI4K2A (gel). (C) Volcano plot illustration of proteins (dots) identified by LC-MS analysis of CM samples. P value (y axis) and fold change (x axis) are shown. PI4K2A-upregulated secreted proteins (pink quadrant) of interest are labeled. (D) Gene Ontology analysis of the pink quadrant in C. (E) Subcutaneous tumors (dots) were weighed (left plot) and subjected to flow cytometry to quantify CD31+ cells (middle plot) and cleaved-caspase 3+ (CC3+) cells (right plot). (F) Heatmap illustration of the correlation between mRNAs and EMT scores (Byers or Creighton) in TCGA LUAD cohort. r values were determined by Pearson’s correlation. (G) Kaplan-Meier survival analysis of TCGA LUAD and LUSC cohorts based on 6-gene signatures of secreted proteins. Tumors were scored as being above (high) or below (low) each cohort’s median values. (HJ) Apoptosis assays and WB analysis of cleaved PARP1 (gel) (H), soft agar colony formation assays (I), and Boyden chamber migration and invasion assays (J) were carried out on siRNA-transfected H1299 cells. (K) HUVEC migration in Boyden chambers. CM samples from siRNA-transfected H1299 cells were loaded into the lower wells. Scale bars: 200 μm. (L) HUVEC spheroid invasion assay. HUVEC spheroids were seeded in 3D collagen and treated with CM samples. Scale bar: 100 μm. (M) HUVEC tube formation assay in 3D Matrigel following treatment with CM samples. Scale bars: 100 μm. (N) HUVEC migration in Boyden chambers. CM from siRNA-transfected H1299 cells was loaded into the lower chambers. Data indicate the mean ± SD from a single experiment incorporating biological replicate samples (n = 3, unless otherwise indicated) and are representative of at least 2 independent experiments. *P < 0.05, **P < 0.01, and ***P < 0.001, by 2-tailed Student’s t test for 2-group comparisons (E); 1-way ANOVA test for multiple comparisons (A, B, and HN).
Figure 5
Figure 5. PI4K2A drives anterograde vesicular trafficking and promotes RAB6A+ vesicle fission.
(A) Single-channel and merged confocal micrographs of total and surface VSV-G in H1299 cells cotransfected with siRNAs and EGFP–VSV-G and imaged 30 minutes after transfer to the permissive temperature. Plot shows the ratio of surface VSV-G to total VSV-G in each cell (dot) 30 or 60 minutes after transfer to 32°C. Scale bar: 20 μm. (B) BRET measurement of PI4P in RAB6A+ vesicles in siRNA-transfected H1299 cells. Results are expressed as a ratio of the values from GSK-A1–treated and vehicle-treated (DMSO) cells at each time point (n = 5 replicates per group). (C) Confocal micrographs of RAB6A+ vesicles (blue arrows) and unfissioned RAB6A+ tubules (red arrows) emerging from the Golgi. Scale bar: 20 μm. Dotted lines indicate the cell boundaries. Results were quantified per cell (dot plots). (D) Venn diagram of PI42KA-interacting proteins identified by TurboID and IP approaches. Overlapping proteins are listed on the right. Reported PI4K2A-interacting proteins (69, 70) are shown in bold. (E) Schematic illustration of full-length and truncated PI4K2A constructs. WB assays on whole-cell lysates (WCLs) (input) or IP proteins isolated from H1299 cells transfected with MYC-tagged PI4K2A constructs (gel). Full-length (1–479) and truncated constructs are indicated under the gels. IgG was used as the control IP. (F) WB analysis of WCLs (WCL) and Golgi-enriched fractions (Golgi) from siRNA-transfected H1299 cells. (G) Confocal micrographs of SPP1+ vesicles (arrows) in siRNA-transfected H1299 cells costained with anti-SPP1 and anti–Golgin 97 antibodies. Scale bars: 50 μm. Dot plot shows the vesicle numbers per cell. (H) WB analysis of WCLs or enriched subcellular fractions from siRNA-transfected H1299 cells. Densitometric values were normalized to siCTL (graph). Data indicate the mean ± SD from a single experiment incorporating biological replicate samples (n = 3, unless otherwise indicated) and are representative of at least 2 independent experiments. ***P < 0.001, by 2-tailed Student’s t test for 2-group comparisons (B); 1-way ANOVA test for multiple comparisons (A, C, G, and H).
Figure 6
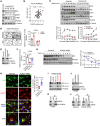
Figure 6. PI4K2A accelerates endocytic trafficking of SPP1 receptors.
(A) Intracellular levels of biotinylated Tfn in siRNA-transfected H1299 cells were quantified at the indicated time points after a 30-minute pulse. The percentage of the internalized Tfn pool was calculated relative to the initial loading (n = 4 samples per condition). (B) WB analysis of CD44, ITGB1, and AXL protein levels in WCLs (input) or streptavidin bead–enriched protein samples from H1299 cells that were transfected with PI4K2A/TurboID construct and treated with biotin. Controls included the PI4KB/TurboID construct (PI4KB) and Turbo alone (CTL). (C) WB analysis of WCLs (input) or anti-HA immunoprecipitates from H1299 cells transfected with HA-tagged PI4K2A. IgG was used as the control IP. (D) SPP1 protein-protein interaction network (STRING-db.org). (E) WB analysis of proteins isolated by streptavidin bead–based pulldowns carried out on H1299 cells treated with biotin-labeled recombinant SPP1. (F) Confocal micrographs of plasma membrane–bound ITGB1 (arrows, upper panels) and CD44 (arrows, lower panels) in nonpermeabilized siRNA-transfected H1299 cells stained with antibodies against endogenous ITGB1 or CD44. Scale bars: 10 μm. (G) WB analysis of cell membrane–enriched fractions (Mem.) and WCL. Densitometric values are shown under the gels. (H) WB analysis of cleaved PARP1 (gel) and flow cytometric analysis of annexin V/PI–stained cells (graph) to quantify apoptosis in siRNA-transfected H1299 cells. (I) Boyden chamber migration and invasion assays on siRNA-transfected cells. (J) Schematic illustration of the working model. PI4K2A coordinates exocytic and endocytic vesicular trafficking to activate an SPP1-dependent autocrine loop. Data indicate the mean ± SD from a single experiment incorporating biological replicate samples (n = 3, unless otherwise indicated) and are representative of at least 2 independent experiments. P values were determined by 1-way ANOVA test for multiple comparisons (A, H, and I).
Figure 7
Figure 7. PI4K2A stabilizes AXL.
(A) WB analysis of parental and PI4K2A-KO H1299 cells. Densitometric values are shown under the gels. Positive (EGFR) and negative (ITGB1) controls. (B) Correlation between AXL and PI4K2A protein levels in cell lines (dots). (C) WB analysis of parental and PI4K2A-KO H1299 cells treated with the AXL ligand Gas6. pAKT, phosphorylated AKT. Graphs show densitometric analysis of pAXL and pAKT levels normalized to t = 0 minutes. (D) Boyden chamber migration assays on parental and PI4K2A-KO H1299 cells treated with (+) or without (–) Gas6. (E) WB analysis of parental and PI4K2A-KO H1299 cells stably transfected with empty vector or AXL. (F) Boyden chamber migration assays on cells in E. (G) WB analysis of parental and PI4K2A-KO H1299 cells treated with cycloheximide (CHX). Graphs show the densitometric values. (H) Single-channel and merged confocal micrographs of parental and PI4K2A-KO cells costained with anti-AXL and anti-LAMP1 antibodies. Lysosomal AXL (inset, arrows) was quantified as the percentage of total AXL that colocalized with LAMP1 per field (n = 10 fields per condition). Scale bar: 10 μm. Original magnification, ×2.5 (enlarged insets). (I) WB analysis of PI4K2A-KO cells treated with proteasomal (MG132) or lysosomal (leupeptin or monensin) inhibitors. DMSO was used as the vehicle. l.e., long exposure duration; s.e., short exposure duration. (J) WB analysis of siRNA-transfected H1299 cells. Densitometric values are shown under the gel. (K) WB analysis of WCLs (input) and anti-HA immunoprecipitates from H1299 cells transfected with HA-tagged PI4K2A. IgG was used as the negative control IP. (L) WB analysis of WCLs (input) and anti-HSP90 immunoprecipitates from parental and PI4K2A-KO H1299 cells. IgG was used as the negative control IP. Data indicate the mean ± SD from a single experiment incorporating biological replicate samples (n = 3, unless otherwise indicated) and are representative of at least 2 independent experiments. **P < 0.01 and ***P < 0.001, by 2-tailed Student’s t test for 2-group comparisons (C, D, G, and H); 1-way ANOVA test for multiple comparisons (F).

Comment in

  • PI4K2A: a novel potential therapeutic target for lung cancer.
    Baldavira CM, Prieto TG, Nagai MA, Capelozzi VL. Baldavira CM, et al. Transl Lung Cancer Res. 2024 Jan 31;13(1):199-204. doi: 10.21037/tlcr-23-734. Epub 2024 Jan 12. Transl Lung Cancer Res. 2024. PMID: 38404996 Free PMC article. No abstract available.

References

    1. Li J, Stanger BZ. The tumor as organizer model. Science. 2019;363(6431):1038–1039. doi: 10.1126/science.aau9861. - DOI - PubMed
    1. Tan X, et al. p53 loss activates prometastatic secretory vesicle biogenesis in the Golgi. Sci Adv. 2021;7(25):eabf4885. doi: 10.1126/sciadv.abf4885. - DOI - PMC - PubMed
    1. Tan X, et al. PI4KIIIβ is a therapeutic target in chromosome 1q-amplified lung adenocarcinoma. Sci Transl Med. 2020;12(527):eaax3772. doi: 10.1126/scitranslmed.aax3772. - DOI - PMC - PubMed
    1. Halberg N, et al. PITPNC1 recruits RAB1B to the golgi network to drive malignant secretion. Cancer Cell. 2016;29(3):339–353. doi: 10.1016/j.ccell.2016.02.013. - DOI - PMC - PubMed
    1. Tan X, et al. A protumorigenic secretory pathway activated by p53 deficiency in lung adenocarcinoma. J Clin Invest. 2021;131(1):e137186137186. - PMC - PubMed

Publication types

MeSH terms

Substances