. 2023 Apr 3;133(7):e152401.
doi: 10.1172/JCI152401.

BAM15 treats mouse sepsis and kidney injury, linking mortality, mitochondrial DNA, tubule damage, and neutrophils

BAM15 treats mouse sepsis and kidney injury, linking mortality, mitochondrial DNA, tubule damage, and neutrophils

Naoko Tsuji et al. J Clin Invest. .

Abstract

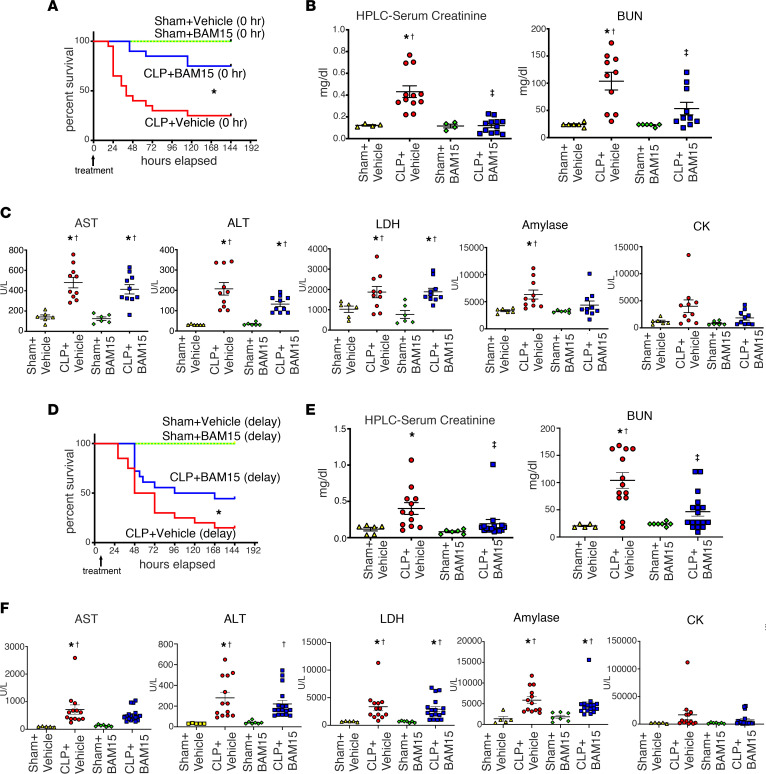
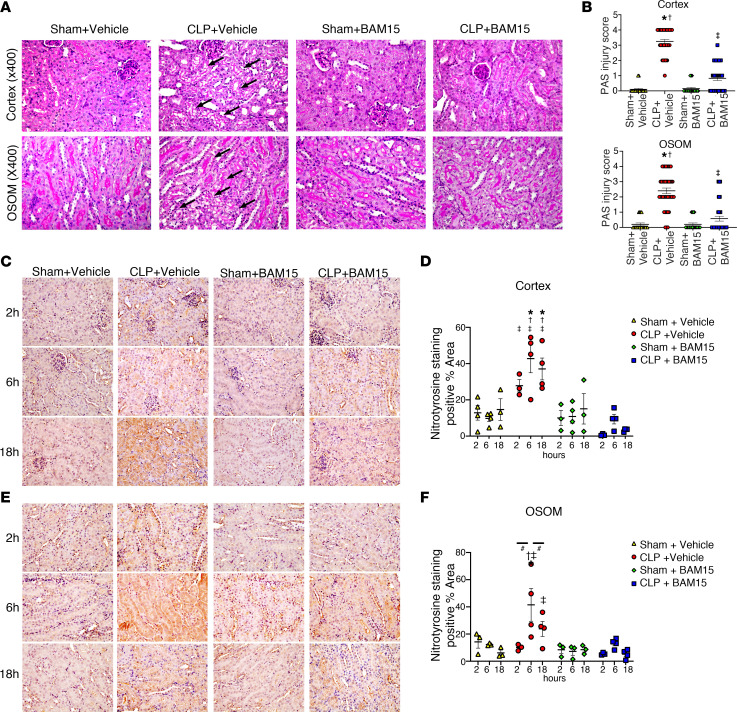
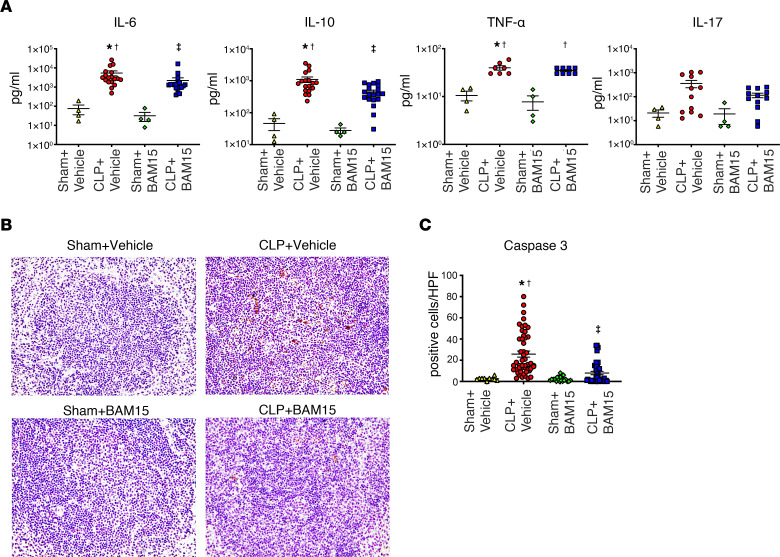
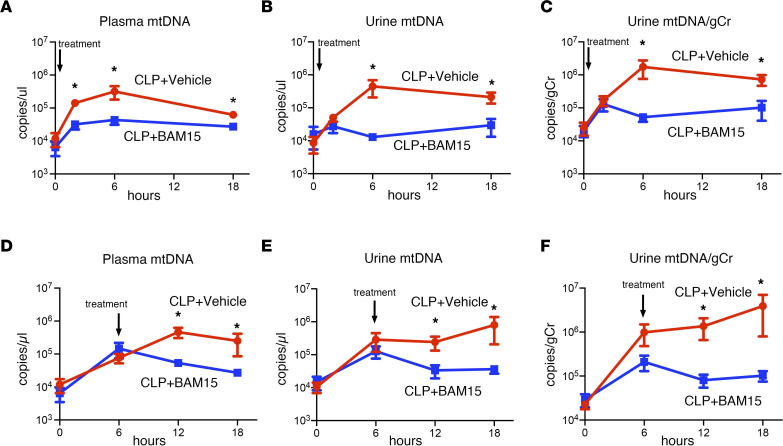
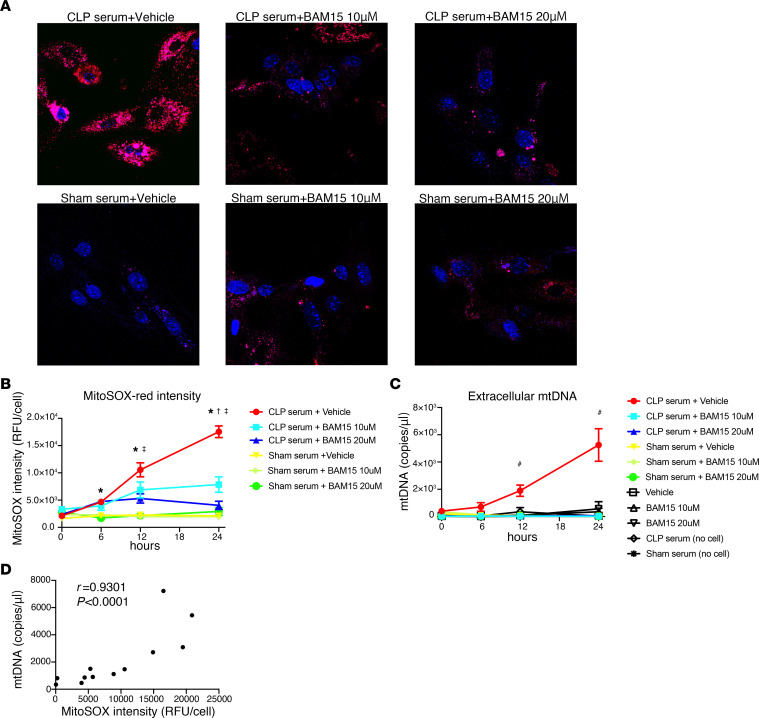
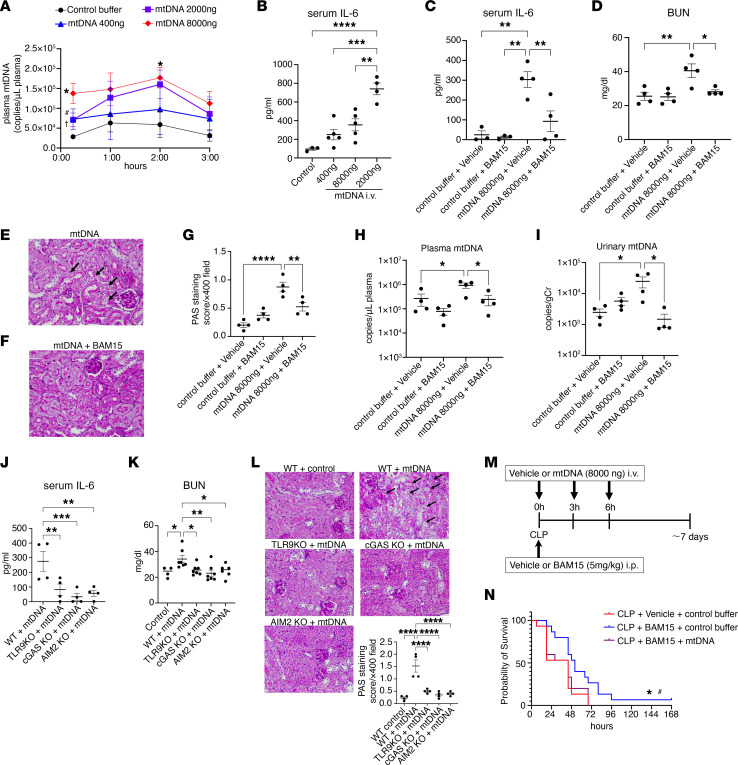
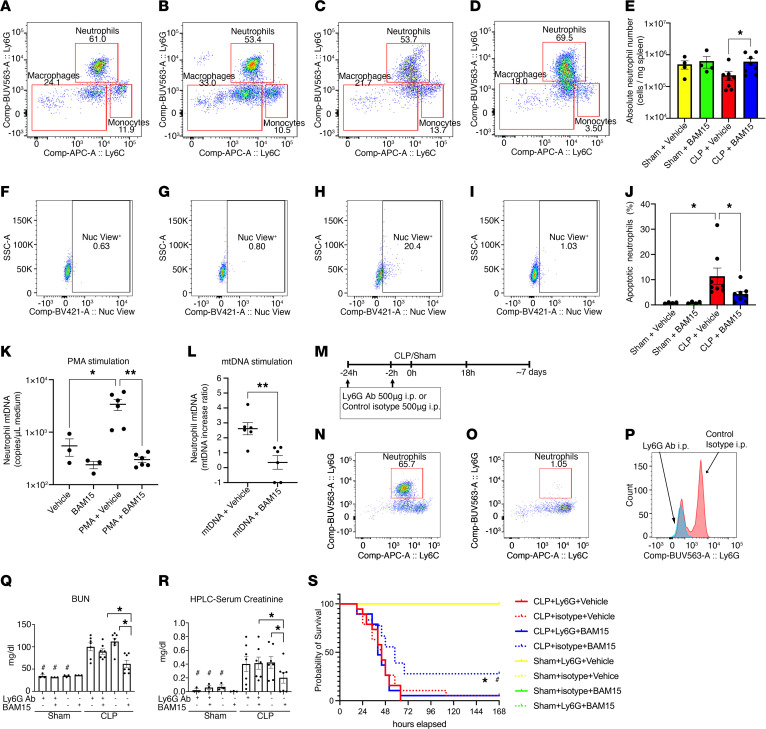
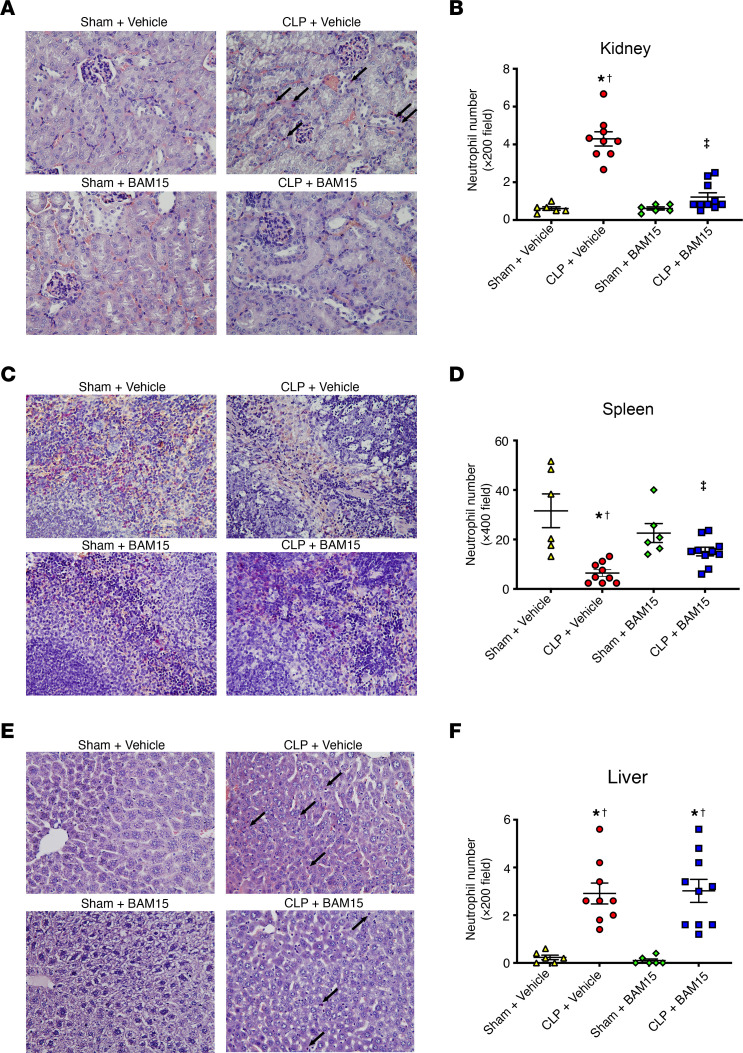
Sepsis pathogenesis is complex and heterogeneous; hence, a precision-medicine strategy is needed. Acute kidney injury (AKI) following sepsis portends higher mortality. Overproduction of mitochondrial ROS (mtROS) is a potential mediator of sepsis and sepsis-induced AKI. BAM15, a chemical uncoupler, dissipates mitochondrial proton gradients without generating mtROS. We injected BAM15 into mice at 0, 6, or 12 hours after cecal ligation and puncture (CLP), and these mice were treated with fluids and antibiotics. BAM15 reduced mortality, even after 12 hours, when mice were ill, and BAM15 reduced kidney damage and splenic apoptosis. Serial plasma and urinary mitochondrial DNA (mtDNA) levels increased after CLP and decreased after BAM15 administration (at 0 or 6 hours). In vitro septic serum proportionately increased mtROS overproduction and mtDNA release from kidney tubule cells, which BAM15 prevented. BAM15 decreased neutrophil apoptosis and mtDNA release; neutrophil depletion counteracted BAM15 benefits. Further, mtDNA injection in vivo replicated inflammation and kidney injury, which was prevented by BAM15. A large dose of exogenous mtDNA reversed protection by BAM15. We conclude that BAM15 is an effective preventive and therapeutic candidate in experimental sepsis and that BAM15 and mtDNA, a potential drug-companion diagnostic/drug-efficacy pair for clinical sepsis, are mechanistically linked via mtROS.

Keywords: Innate immunity; Mitochondria; Nephrology.


Conflict of interest statement

Conflict of interest: The authors have declared that no conflict of interest exists.

Figures

Figure 1
Figure 1. BAM15 treatment improves mortality and AKI in septic mice, even with delayed administration.
(A) Kaplan-Meier curves of male mice subjected to sham or CLP surgery treated with vehicle (at 0 hours) and mice subjected to sham or CLP surgery treated with BAM15 (5 mg/kg, at 0 hours) for 7 days. Sham+vehicle/BAM15, n = 4 each; CLP+vehicle/BAM15, n = 20 each. log-rank test. *P < 0.05, CLP+vehicle versus other groups. (B and C) Serum creatinine measured by HPLC. BUN (B), aspartate transferase (AST), alanine transaminase (ALT), lactate dehydrogenase (LDH), amylase, and creatinine kinase (CK) (C) by biochemical examination at 18 hours after mice were subjected to sham or CLP surgery and treated with vehicle (at 0 hours) or BAM15 (5 mg/kg, at 0 hours). Data are represented as mean ± SEM of each group (sham+vehicle, n = 4–6, CLP+vehicle, n = 10–12; sham+BAM15, n = 4–6; CLP+BAM15, n = 10–12). Šidák’s multiple-comparison test following 1-way ANOVA. *Versus sham+vehicle, P < 0.05; versus sham+BAM15, P < 0.05; versus CLP+vehicle, P < 0.05. (D) Kaplan-Meier curves for 7 days of mice subjected to sham or CLP surgery and treated with vehicle (at 6 hours) or BAM15 (5 mg/kg, at 6 hours). Sham+vehicle/BAM15, n = 4 each; CLP+vehicle (n = 20), BAM15 (n = 19). log-rank test. *CLP+vehicle versus other groups, P < 0.05. (EF) Serum creatinine measured by HPLC. BUN (E) and AST, ALT, LDH, amylase, and CK (F) measured by biochemical examination at 18 hours after mice subjected to sham or CLP surgery were treated with vehicle (at 6 hours) or BAM15 (5 mg/kg, at 6 hours). Data are represented as mean ± SEM of each group (sham+vehicle, n = 5; CLP+vehicle, n = 13; sham+BAM15, n = 7; CLP+BAM15, n = 17). Dunn’s multiple-comparison test following Kruskal-Wallis test. *Versus sham+vehicle, P < 0.05; versus sham+BAM15, P < 0.05; versus CLP+vehicle, P < 0.05.
Figure 2
Figure 2. BAM15 reduces injury and oxidative damage via RNS in septic kidney.
Periodic acid–Schiff staining of cortex and OSOM in kidneys at 18 hours after mice subjected to sham or CLP surgery were treated with vehicle (at 0 hours) or BAM15 (5 mg/kg, at 0 hours). (A) Representative images of cortex and OSOM. Arrows show vacuolization in proximal tubule cells. Original magnification, ×400. (B) Tubular damage score in cortex and OSOM of kidney at 18 hours after being subjected to sham (4 mice each, total 20 fields of ×400) or CLP surgery (8 mice each, total 40 fields of ×400) treated with vehicle (at 0 hours) or BAM15 (5 mg/kg, at 0 hours). Data are represented as mean ± SEM. Dunn’s multiple-comparison test following Kruskal-Wallis test. *Versus sham+vehicle, P < 0.05; versus sham+BAM15, P < 0.05; versus CLP+vehicle, P < 0.05. (AD) Representative nitrotyrosine images and positive area rate of cortex (C and D) and OSOM (E and F) in kidney at 2, 6, and 18 hours after being subjected to sham or CLP surgery and treated with vehicle (at 0 hours) or BAM15 (5 mg/kg, at 0 hours). Original magnification, ×400. The positive area rate was calculated by Fiji/ImageJ (NIH) software. Each circle represents the average of positive area of 3 to 4 fields per mouse kidney (3 to 4 mice/group). Bars show mean ± SEM. Tukey’s multiple-comparison test following 2-way ANOVA test. *Versus sham+vehicle, P < 0.05; versus sham+BAM15, P < 0.05; versus CLP+vehicle, P < 0.05; #comparison between time points, P < 0.05.
Figure 3
Figure 3. BAM15 inhibits production of some cytokines and splenic apoptosis.
(A) Cytokines in serum at 18 hours after mice subjected to sham or CLP surgery were treated with vehicle (at 0 hours) or BAM15 (5 mg/kg, at 0 hours). n = 4 (sham+vehicle), n = 7–18 (CLP+vehicle), n = 4 (sham+BAM15), n = 8–19 (CLP+BAM15) mice. (B) Cleaved caspase-3 staining in the spleen at 18 hours after mice subjected to sham or CLP surgery were treated with vehicle (at 0 hours) or BAM15 (5 mg/kg, at 0 hours). Original magnification, ×400. (C) Positive cells of cleaved caspase-3 in the spleen of mice subjected to sham (n = 4 mice each, total 20 fields of 400×) or CLP surgery (8 mice each, total 40~50 fields of ×400) treated with vehicle (at 0 hours) or BAM15 (5 mg/kg, at 0 hours) at 18 hours. Data are represented as mean ± SEM. Dunn’s multiple-comparison test following Kruskal Wallis test. *Versus sham+vehicle, P < 0.05; versus sham+ AM15, P < 0.05; versus CLP+vehicle, P < 0.05.
Figure 4
Figure 4. Both early and delayed BAM15 treatment decrease circulating mtDNA.
(AC) Time course of plasma mtDNA levels (A) and urine mtDNA (B) and urine mtDNA adjusted to creatinine excretion (C) at 18 hours after CLP (n = 8 each) mice were treated with vehicle (at 0 hours) or BAM15 (5 mg/kg, at 0 hours). (DF) Time course of plasma mtDNA level (D) and urine mtDNA (E) and urine mtDNA adjusted to the creatinine excretion (F) in CLP mice (n = 8 each) treated with vehicle (at 6 hours) or BAM15 (5 mg/kg, at 6 hours).Data are represented as mean ± SEM. Analysis between groups at each time point was performed with Šidák’s multiple-comparison test following mixed-effects analysis. *P < 0.05.
Figure 5
Figure 5. BAM15 inhibits production of mtROS in mPPTCs linked with decreasing mtDNA released from mPPTCs.
(A and B) Serial live-cell imaging of mtROS in mPPTCs incubated with sham or CLP serum treated with vehicle or BAM15 (10 μM or 20 μM). (A) Representative images of mtROS of mPPTCs in each group at 24 hours after incubation. Red, MitoSOX Red; blue, Hoechst 33342. Original magnification, ×400. (B) Time course of fluorescence intensity of MitoSOX Red serially measured. Data are represented as mean ± SEM. Tukey’s multiple-comparison test following 2-way ANOVA test. n = 18–31 (CLP serum+vehicle), n = 16–24 (CLP serum+BAM15, 10 μM), n = 19–24 (CLP serum+BAM15, 20 μM), n = 18–32 (sham serum+vehicle), n = 9–13 (sham serum+BAM15, 10 μM), and n = 8–13 (sham serum+BAM15, 20 μM) for 3 biological replicates per condition. *Versus each serum from mice subjected to sham surgery group, P < 0.05; versus CLP serum+10 μM BAM15, P < 0.05; versus CLP serum+20 μM BAM15, P < 0.05. (C) Time course of extracellular mtDNA levels of the supernatant shown in B. Controls were medium with CLP/sham serum or supernatants of PTCs treated with only vehicle/BAM15. #CLP serum+vehicle versus each other group, P < 0.05. Tukey’s multiple-comparison test following 2-way ANOVA test. (D) Correlation between extracellular mtDNA level and the corresponding MitoSOX Red intensity in the mPPTCs incubated with CLP serum treated with vehicle. n = 8 from 0, 6, 12, and 24 hours on 2 biological replicates. r value is Pearson’s correlation coefficient.
Figure 6
Figure 6. BAM15 effect on kidney injury and systemic inflammation caused by mtDNA as DAMPs in vivo.
(A) Circulating mtDNA levels after injection of mtDNA (400 ng, 2,000 ng, or 8,000 ng) into naive mice. n = 3–4 each. Data are represented as mean ± SEM. *P < 0.05, mtDNA, 8,000 ng versus control; #P < 0.05, mtDNA, 2,000 ng versus control; P < 0.05, mtDNA, 400 ng versus control, unpaired t test. (B) IL-6 levels in serum at 3 hours after injection of mtDNA (400, 2,000, or 8,000 ng) into naive mice. n = 3–5 each. Data are represented as mean ± SEM. *P < 0.05; **P < 0.01; ***P < 0.001; ****P < 0.0001, Tukey’s multiple-comparison test following 1-way ANOVA. (CI) BAM15 effect (5 mg/kg, i.p., at 0 hours) at 3 hours after injection of mtDNA (8,000 ng) into naive mice on serum IL-6 level (C), BUN (D), PAS staining (E and F), and scoring (G) of kidney cortex, and mtDNA level in plasma (H) and urine (I). Original magnification, ×400. n = 3–5 each. Data are represented as mean ± SEM. *P < 0.05; **P < 0.01; ****P < 0.0001, Šidák’s multiple-comparison test following 1-way ANOVA. (JL) Serum IL-6 levels (J), BUN (K), and PAS staining and scoring (L) in WT, TLR9-KO, cGAS-KO, and AIM2-KO mice at 3 hours after injection of mtDNA (8,000 ng). n = 4 each for IL-6 and PAS staining. n = 6 for BUN. Data are represented as mean ± SEM. *P < 0.05; **P < 0.01; ***P < 0.001. Šidák’s multiple-comparison test following 1-way ANOVA. (M) Study design for survival study of mtDNA (8,000 ng) injection at 0, 3, and 6 hours after CLP surgery. (N) Kaplan-Meier curves of CLP mice treated for 7 days with vehicle or BAM15 (5 mg/kg, at 0 hours) following injection of mtDNA (8,000 ng) or control buffer. n = 15 each. log-rank test. *P < 0.05, CLP+vehicle+control versus CLP+BAM15+control; #P < 0.05, CLP+BAM15+mtDNA versus CLP+BAM15+control buffer.
Figure 7
Figure 7. BAM15 decreases neutrophil apoptosis and mtDNA release; neutrophil depletion counteracted BAM15 benefits.
(AD) Gating of Ly6G+ neutrophils in granulocytes (CD45+CD11b+) of spleen at 18 hours of sham+vehicle (A), sham+BAM15 (B), CLP+vehicle (C), and CLP+BAM15 (5 mg/kg, at 0 hours) (D). (E) Absolute neutrophil number in each group. Sham groups, n = 4 each; CLP groups, n = 8 each. Each circle represents a log-transformed average of duplicated samples. (FI) Apoptotic cells in neutrophils of spleen at 18 hours of sham+vehicle (F), sham+BAM15 (G), CLP+vehicle (H), and CLP+BAM15 (I), and percentage of these apoptotic neutrophils in each group (J). n = 4 for each sham group; n = 8 for each CLP group. *P < 0.05. (K and L) Extracellular mtDNA in medium of Ly6G+ neutrophils treated with PMA (K) or mtDNA (25 μg/ml) (L) with or without BAM15. Data are represented as mean ± SEM. Holm-Šidák multiple-comparison test following 1-way ANOVA (E, J, K); t test (L). *P < 0.05; **P < 0.001. (M) Study design of CLP with neutrophil depletion. (NP) Ly6G+ neutrophil population in isotype control–treated (N) or Ly6G Ab–treated (O) spleen at 18 hours after sham surgery, and histogram of Ly6G expression (P). BUN (Q); Serum creatinine (R). Sham groups, n = 3 each; CLP groups, n = 7 each. Data are represented as mean ± SEM. Šidák’s multiple-comparison test following 1-way ANOVA. #P < 0.05, CLP versus sham in each treatment group; *P < 0.05, between CLP groups. (S) Kaplan-Meier curves for 7 days of mice subjected to sham or CLP surgery treated with vehicle or BAM15 (5 mg/kg at 0 hours) following Ly6G Ab or isotype control treatment. Sham groups, n = 3 each; CLP groups, n = 20 each. log-rank test. *P < 0.05, CLP+isotype+vehicle versus CLP+isotype+BAM15. #P < 0.05, CLP+Ly6GAb+BAM15 versus CLP+isotype+BAM15.
Figure 8
Figure 8. Neutrophil infiltration in kidney, spleen, and liver in septic mice.
(AF) Representative images and number of neutrophils (arrows) in kidney (A), spleen (C), and liver (E) 18 hours after sham/CLP mice were treated with vehicle or AM15 (5 mg/kg, at 0 hours) using naphthol AS-D chloroacetate esterase staining. Neutrophils are stained pink. Original magnification, ×400. Data are represented as mean ± SEM. n = 6 mice for sham surgery groups; n = 9–10 mice for CLP groups. Neutrophils were counted in ×200 fields (n = 5) for kidney (B) and liver (F), and ×400 fields (n = 5) for spleen (D) and averaged per mouse. Dunn’s multiple-comparison test following Kruskal-Wallis test. *Versus sham+vehicle, P < 0.05; versus sham+BAM15, P < 0.05; versus CLP+vehicle, P < 0.05.

Similar articles

Cited by

References

    1. Rudd KE, et al. Global, regional, and national sepsis incidence and mortality, 1990-2017: analysis for the Global Burden of Disease Study. Lancet. 2020;395(10219):200–211. doi: 10.1016/S0140-6736(19)32989-7. - DOI - PMC - PubMed
    1. Murugan R, et al. Acute kidney injury in non-severe pneumonia is associated with an increased immune response and lower survival. Kidney Int. 2010;77(6):527–535. doi: 10.1038/ki.2009.502. - DOI - PMC - PubMed
    1. Hoste EA, et al. Epidemiology of acute kidney injury in critically ill patients: the multinational AKI-EPI study. Intensive Care Med. 2015;41(8):1411–1423. doi: 10.1007/s00134-015-3934-7. - DOI - PubMed
    1. Kimmel PL, et al. How community engagement is enhancing NIDDK research. Clin J Am Soc Nephrol. 2019;14(5):768–770. doi: 10.2215/CJN.14591218. - DOI - PMC - PubMed
    1. Reddy K, et al. Subphenotypes in critical care: translation into clinical practice. Lancet Respir Med. 2020;8(6):631–643. doi: 10.1016/S2213-2600(20)30124-7. - DOI - PubMed

Publication types

Substances