. 2023 Mar 15;133(6):e162139.
doi: 10.1172/JCI162139.

PP2Ac/STRN4 negatively regulates STING-type I IFN signaling in tumor-associated macrophages

Affiliations

PP2Ac/STRN4 negatively regulates STING-type I IFN signaling in tumor-associated macrophages

Winson S Ho et al. J Clin Invest. .

Abstract

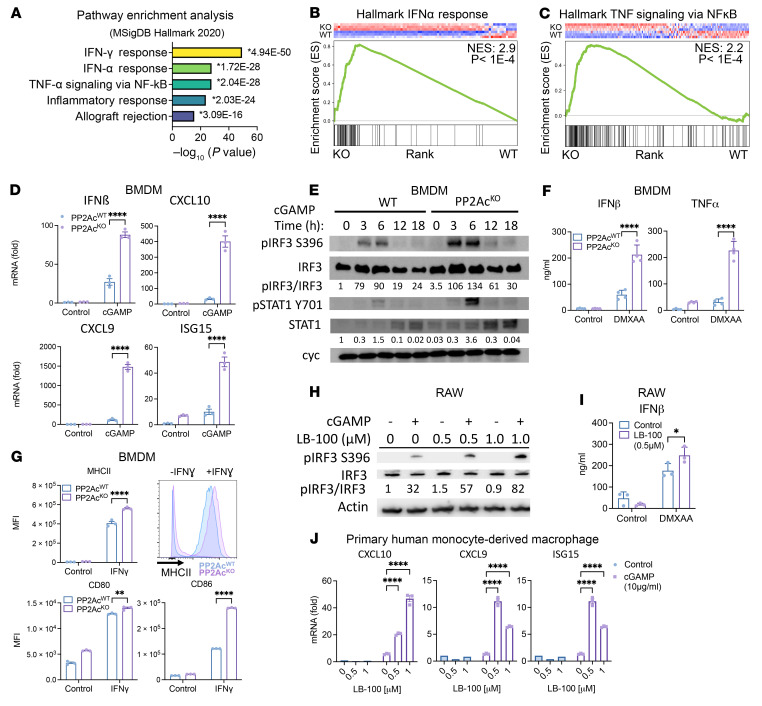
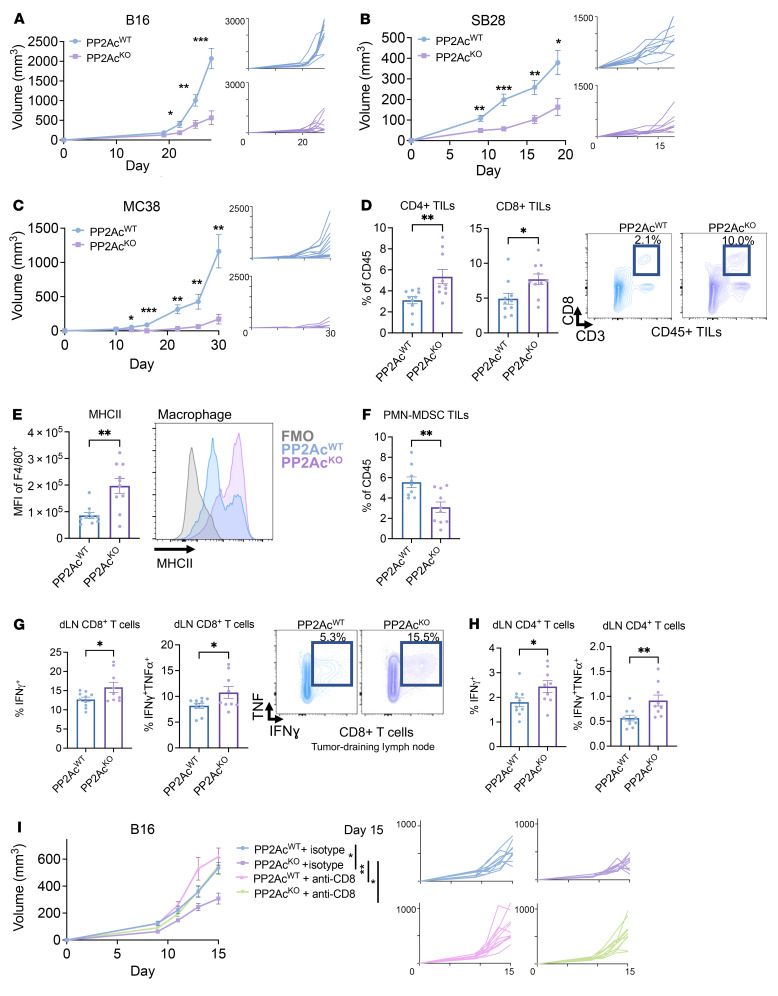
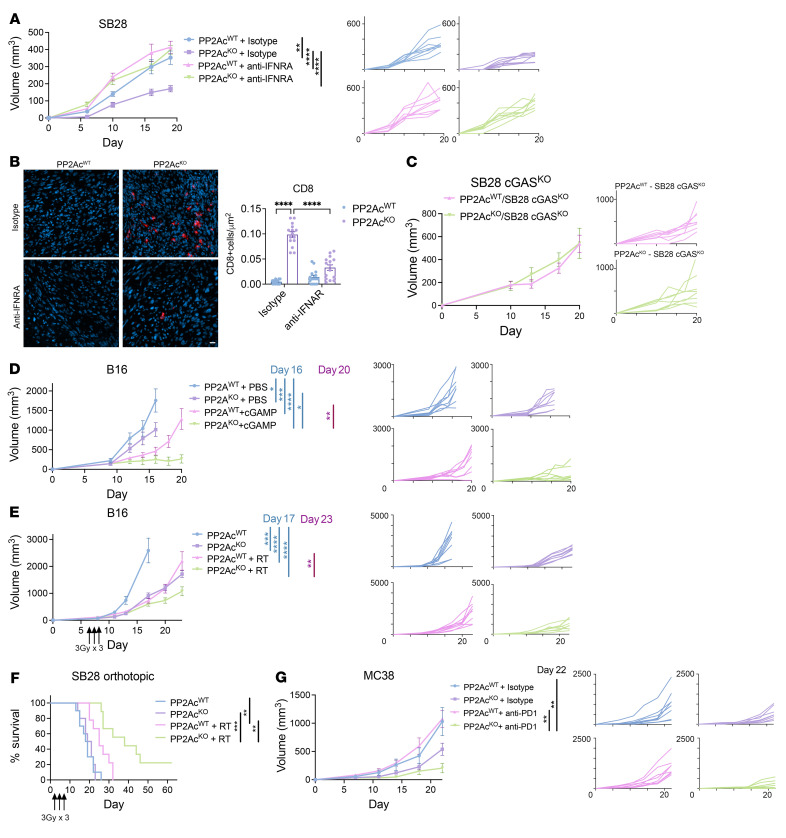
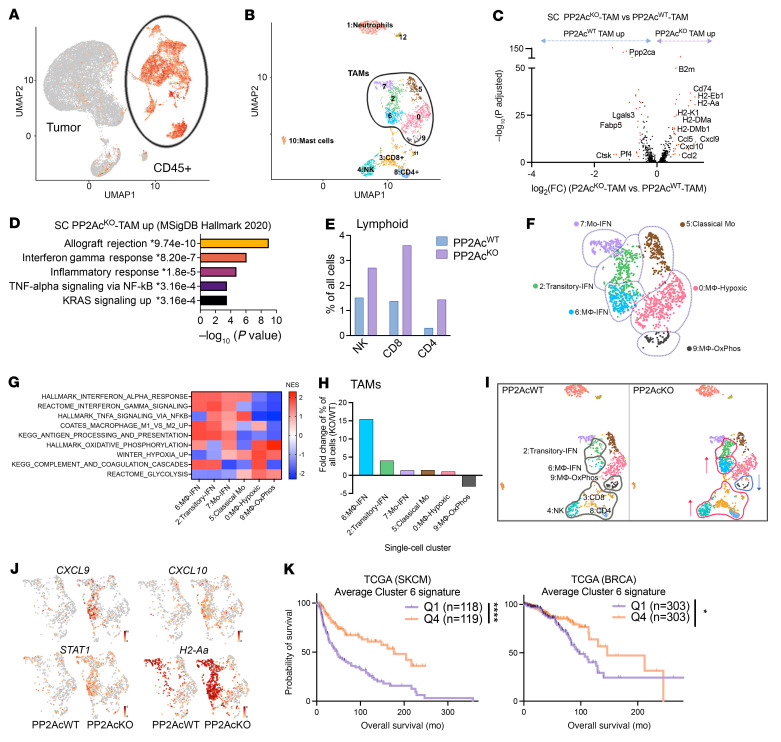
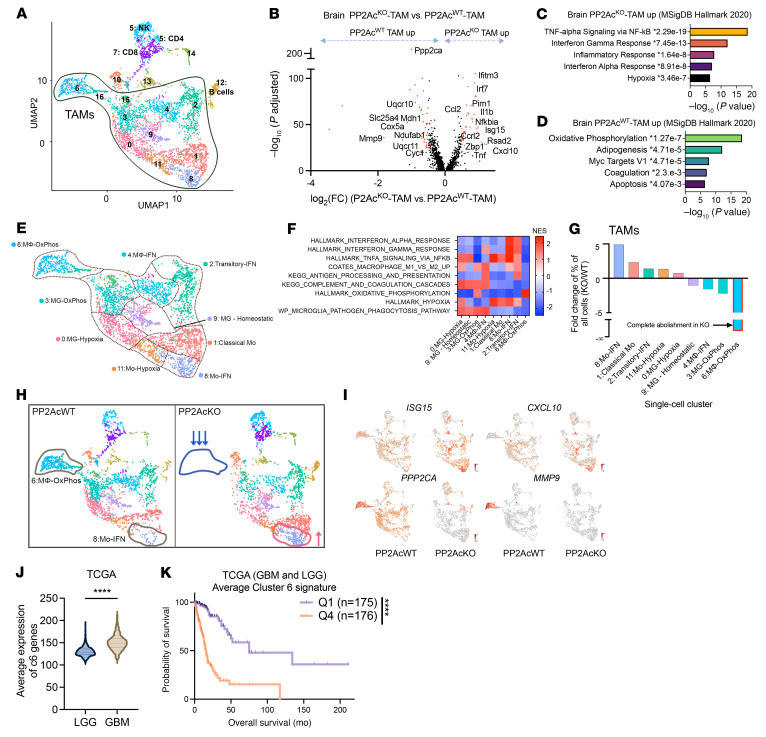
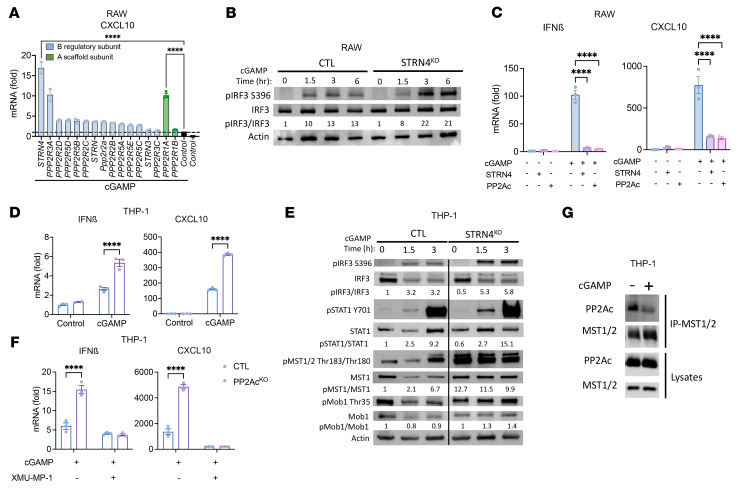
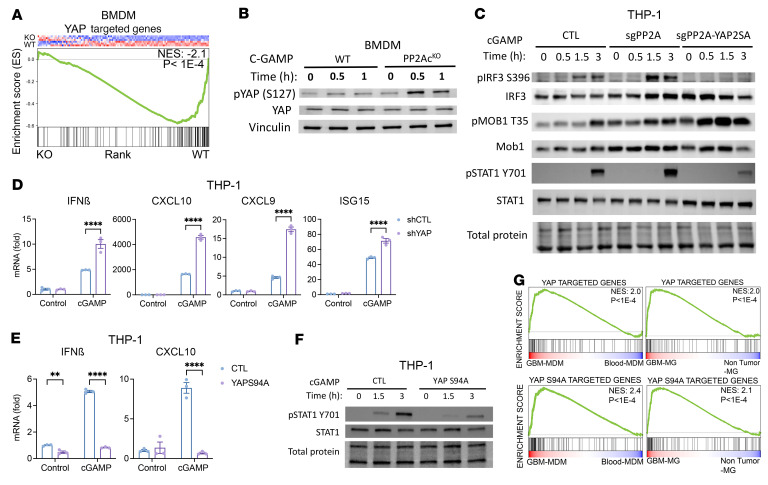
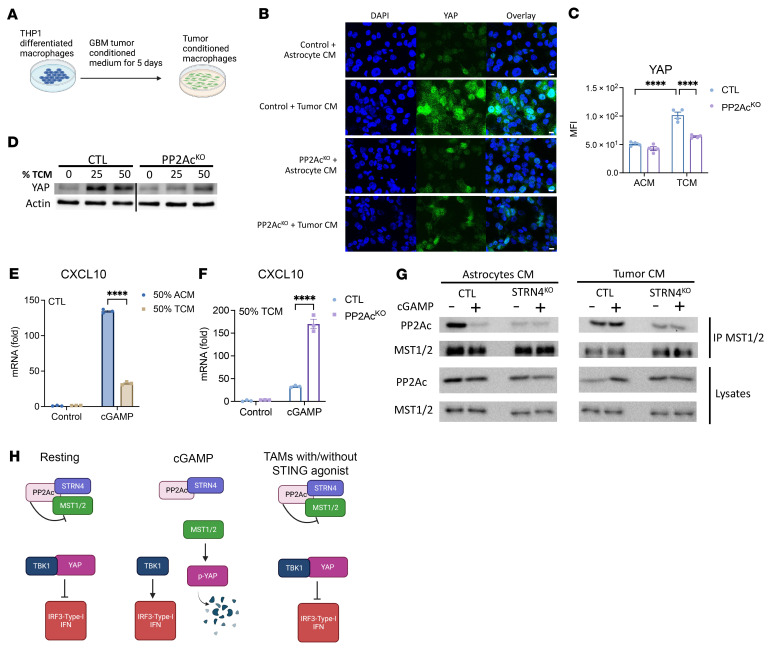
Stimulator of IFN genes type I (STING-Type I) IFN signaling in myeloid cells plays a critical role in effective antitumor immune responses, but STING agonists as monotherapy have shown limited efficacy in clinical trials. The mechanisms that downregulate STING signaling are not fully understood. Here, we report that protein phosphatase 2A (PP2A), with its specific B regulatory subunit Striatin 4 (STRN4), negatively regulated STING-Type I IFN in macrophages. Mice with macrophage PP2A deficiency exhibited reduced tumor progression. The tumor microenvironment showed decreased immunosuppressive and increased IFN-activated macrophages and CD8+ T cells. Mechanistically, we demonstrated that Hippo kinase MST1/2 was required for STING activation. STING agonists induced dissociation of PP2A from MST1/2 in normal macrophages, but not in tumor conditioned macrophages. Furthermore, our data showed that STRN4 mediated PP2A binding to and dephosphorylation of Hippo kinase MST1/2, resulting in stabilization of YAP/TAZ to antagonize STING activation. In human patients with glioblastoma (GBM), YAP/TAZ was highly expressed in tumor-associated macrophages but not in nontumor macrophages. We also demonstrated that PP2A/STRN4 deficiency in macrophages reduced YAP/TAZ expression and sensitized tumor-conditioned macrophages to STING stimulation. In summary, we demonstrated that PP2A/STRN4-YAP/TAZ has, in our opinion, been an unappreciated mechanism that mediates immunosuppression in tumor-associated macrophages, and targeting the PP2A/STRN4-YAP/TAZ axis can sensitize tumors to immunotherapy.

Keywords: Cancer immunotherapy; Immunology; Macrophages; Oncology.


Figures

Figure 1
Figure 1. PP2A negatively regulates STING-Type I IFN signaling pathway.
(A) Pathway enrichment analysis of RNA-Seq of PP2AcKO and PP2AcWT BMDM treated with cGAMP (10 μg/mL) for 4 hours (n = 3 per group) showing the top 5 enriched pathways ranked with highest –log10 P value using differentially upregulated genes in PP2AcKO compared with PP2AcWT BMDM (Log2 fold change (log2FC) > 1, FDR < 0.01). * indicates the P value for each individual pathway. (B and C) GSEA plots for Type I IFN (B) and TNF (C) signatures between cGAMP-treated PP2AcKO versus PP2AcWT BMDM. (D) BMDM were harvested 4 hours after cGAMP stimulation (10 μg/mL). Expression of IFNβ and IFN response genes (CXCL10, CXCL9, and ISG15) were measured via reverse transcription PCR. (E) Protein expression of BMDM was analyzed by immunoblotting after cGAMP (10 μg/mL) treatment. (F) PP2AcKO and PP2AcWT BMDM were stimulated with DMXAA (10 μg/mL) for 48 hours, cytokine concentrations were measured in culture supernatant. (G) PP2AcKO and PP2AcWT BMDM were treated with IFNγ (10 ng/mL) for 24 hours, expressions of CD80, CD86, and MHCII were measured by FACS. Representative FACS plot of MHCII expression ± IFNγ treatment. (H) RAW cells were pretreated with the PP2A inhibitor LB-100 for 2 hours before stimulated with cGAMP (10 μg/mL) for 4 hours. Protein expression was analyzed by immunoblotting. (I) RAW cells were pretreated with LB-100 for 2 hours before stimulated with DMXAA (10 μg/mL) for 48 hours. Cytokine concentrations were measured in culture supernatant. (J) PBMCs were treated with M-CSF (50 ng/mL) for 6 days to derive macrophages. Cells were then pretreated with LB-100 at the indicated dosage for 1.5 hours prior to cGAMP (10 μg/mL) treatment. Expression of IFN response genes (CXCL10, CXCL9, and ISG15) were measured via real time PCR. Data are from 1 experiment representative of at least 2 (BI) and 1 (J) independent experiments with similar results. Error bars depict SEM. P values were calculated by unpaired 2-tailed t test *P < 0.05,**P < 0.01, ***P < 0.001, ****P < 0.0001.
Figure 2
Figure 2. Macrophage PP2Ac deficiency reduces tumor growth and alters the tumor immune microenvironment.
(AC) LysMcrePP2Acfl/fl or WT C57BL/6 mice were inoculated with 0.1 × 10⁶ (A) B16, (B) SB28, or (C) 1 × 10⁶ MC38 cells s.c. (n = 8–10). (DG) B16 tumors were implanted s.c. in LysMcrePP2Acfl/fl or WT mice. Mice were euthanized on day 10. Tumors were harvested for tumor infiltrating leukocyte (TIL) profiling (DF) and tumor-draining lymph node (tumor-dLN) (G and H) by flow cytometry (n = 9–10). (D) Quantification of CD4+ and CD8+ TILs and representative FACS plot. (E) Quantification of MHCII+ expression in tumor infiltrating macrophages (F4/80+) with representative FACS plot. (F) Quantification of Ly6G+Ly6Clo PMN-MDSC in TILs. (GH) Quantitation of IFNγ-producing or IFNγ/TNF dual–producing dLN-resident CD8+ (G) and CD4+ (H) T cells as percentages of total CD8+ and CD4+ T cells, respectively. IFNγ and/or TNF production was stimulated exvivo with PMA/ionomycin in conjunction with protein transport inhibitor for 4 hours prior to staining. Representative FACS plots of dLN CD8+ T cells after stimulation. (I) LysMcrePP2Acfl/fl or WT C57BL/6 mice were treated with anti-CD8 depletion antibody or isotype control. Mice were given 250 μg i.p. on day –3, –2, and –1, then inoculated with 0.1 × 10⁶ B16 cells s.c. (day 0) (n = 8). Depleting antibody or isotype was then given 2 × per week until endpoint. Data are from 1 experiment representative of at least 2 (AH) and 1 (I) independent experiments with similar results. Error bars depict SEM. P values were calculated by unpaired 2-tailed t test (*P < 0.05, **P < 0.01, ***P < 0.001, ****P < 0.0001).
Figure 3
Figure 3. Macrophage PP2Ac deficiency synergizes with STING agonist, radiation, and immune checkpoint blockade.
(A) LysMcrePP2Acfl/fl or WT C57BL/6 mice were inoculated with 0.1 × 10⁶ SB28 cells s.c. (n = 8). Mice were given intra-tumoral injection of anti-IFNAR-1 or isotype control (100 μg) on days 0 and 2, and then 2 times per week. (B) At survival endpoint, histological analysis was performed, staining for CD8 (red) and nucleus (4,6-diamidino-2-phenylindole (DAPI), blue). Scale bar: 10 μm. CD8 cells per field of view from 3 areas of interest on 3 independent samples (n = 9) were quantified. (C) LysMcrePP2Acfl/fl or WT mice were inoculated with 0.1 × 10⁶ SB28 cGASKO (n = 8) cells s.c. (D) LysMcrePP2Acfl/fl or WT mice were inoculated with 0.1 × 10⁶ B16 cells s.c. At day 4, mice were randomized (n = 7-8) into intratumoral injection of PBS or cGAMP (3 μg) at days 4, 8, and 11. (E) LysMcrePP2Acfl/fl or WT mice were inoculated with 0.1 × 10⁶ B16 cells s.c. At day 7, mice were randomized to with or without radiation (n = 8). For the radiation groups, tumors were locally irradiated with 3Gy daily for 3 consecutive days (3 × 3Gy). (F) LysMcrePP2Acfl/fl or WT mice were inoculated with 3 × 10⁴ SB28 cells in the brain. At day 5, mice were randomized to with or without radiation (n = 9–10). Cumulative survival of mice over time. (G) LysMcrePP2Acfl/fl or WT mice were inoculated with 1 × 10⁶ MC38 cells s.c. At day 7, animals were randomized to treatment with anti-PD-1 or IgG1 isotype (200 μg) antibodies via i.p injection, given twice a week. Data are from 1 experiment representative of at least 2 (for CG) or 1 (for A and B) independent experiments with similar results. Mantel-Cox log-rank tests were used for survival analysis. Error bars depict SEM. P values were calculated by 1-way ANOVA with Tukey’s multiple comparison test. *P < 0.05, **P < 0.01, ***P < 0.001, ****P < 0.0001.
Figure 4
Figure 4. scRNA-Seq of s.c. SB28 tumor.
LysMcrePP2Acfl/fl or WT mice were inoculated with SB28 tumor subcutaneously (0.1 × 10⁶ cells) or orthotopically in the brain (3 × 10⁴ cells). On day 18, 3 tumors per group were pooled and analyzed by scRNA-Seq. (A) UMAP analyses were performed on 26,023 cells from all 4 groups. (B) UMAP of CD45+ immune cells of s.c tumors. Canonical markers were used to identify major immune populations. (C) Volcano plots showing DEGs (−log10 (adjusted P) > 2, log2FC > 0.5) in CD68+TAMs between tumors from LysMcrePP2Acfl/fl or WT mice. P values were adjusted using Bonferroni’s correction. Upregulated genes related to antigen presentation and IFN signaling are labelled. (D) Pathway enrichment analysis performed using Enrichr on upregulated DEGs in tumors from LysMcrePP2Acfl/fl mice. Top 5 enriched biological processes ranked by –log(P). (E) Percentage of lymphoid (CD4, CD8, and NK) cells of all cells. (F) Overview of TAM subsets with 6 subclusters: subcluster 0, hypoxic macrophage; subcluster 2, transitory-IFN; subcluster 5, classical monocyte; subcluster 6, IFN macrophage; subcluster 7, IFN monocytes; and subcluster 9, oxidative phosphorylation (Ox-Phos) macrophage. (G) Heatmap of Normalized Enrichment Score (NES) from GSEA of TAMs cluster. (H) Fold change in frequency of the 6 TAMs clusters. (I) UMAP of immune cells highlighting the clusters that are altered between tumors from LysMcrePP2Acfl/fl or WT mice. (J) UMAP of TAMS highlight IFN-response genes (CXCL9, CXCL10, STAT1, and H2-Aa) in TAMs from LysMcrePP2Acfl/fl or WT mice. (K) Average expression level of cluster 6 gene signatures associated with survival of patients with melanoma and breast cancer from TCGA bulk RNA-Seq data set (SKCM and BRCA respectively). Mantel-Cox log-rank tests were used for survival analysis. *P < 0.05, ****P < 0.0001.
Figure 5
Figure 5. scRNA-Seq of i.c. SB28 tumor.
(A) UMAP of CD45+ immune cells of i.c tumors in Figure 4A. Canonical markers were used to identify major immune populations. (B) Volcano plots showing DEGs (−log10 (adjusted P) > 20, log2FC > 0.5) in CD68+TAMs between tumors from LysMcrePP2Acfl/fl or WT mice. P value adjusted using Bonferroni’s correction. Upregulated genes related to IFN signaling, and downregulated genes related to oxidation phosphorylation are labelled. (C and D) Pathway enrichment analyses using Enrichr showing upregulated (C) and downregulated (D) DEGs of TAMs in tumors from LysMcrePP2Acfl/fl mice. Top 5 enriched biological processes ranked by –log(P). (E) Overview of TAM subsets with 9 subclusters identified: subcluster 0, hypoxic macrophage; subcluster 1, classical monocytes; subcluster 2, transitory-IFN; subcluster 3, Ox-Phos microglia; subcluster 4, IFN macrophage; subcluster 6, Ox-Phos macrophage; subcluster 8, IFN monocytes; subcluster 9, homeostasis microglia; and subcluster 11, hypoxic monocytes. (F) Heatmap of Normalized Enrichment Score (NES) from GSEA identified pathway enrichment in each TAM cluster. (G) Fold change in frequency of the 9 TAMs clusters. (H) UMAP of immune cells highlighting the clusters that are altered between tumors from LysMcrePP2Acfl/fl or WT mice. (I) UMAP of TAMS highlight IFN-response genes (CXCL10 and ISG15), MMP9 and PP2Ac in TAMs from LysMcrePP2Acfl/fl or WT mice. (J) Average expression of cluster 6 gene signature is higher in high grade glioma (n = 171) than in low grade glioma (n = 530) from TCGA data set. P value calculated by 2-tailed unpaired t test (****P < 0.0001). (K) Average expression level of cluster 6 gene signature is associated with worse survival in patients with glioma using TCGA bulk RNA-Seq data set (merged LGG and HGG). Mantel-Cox log-rank tests were used for survival analysis. ****P < 0.0001.
Figure 6
Figure 6. STRN4, a regulatory B subunit of PP2A, negatively regulates STING-Type I IFN by modulation of Hippo kinase MST1/2 and YAP/TAZ.
(A) siRNA screen identified PP2A subunits involved in cGAS-STING response. RAW cells were transfected with siRNA of each of 14 regulatory and 2 scaffold subunits of PP2A. 48 hours after transfection, cells were treated with cGAMP (10 μg/mL) for 4 hours. CXCL10 expression was measured via real time PCR. Fold change is relative to nontargeting siRNA. (B) CTL and STRN4KO RAW cells were treated with cGAMP (10 μg/mL), protein expression was analyzed by immunoblotting at different time points after stimulation. (C) RAW cells were transfected with overexpression plasmids for STRN4 or PP2Ac. 48 hours after transfection, cells were treated with cGAMP (10 μg/mL) for 4 hours. Expression of IFNβ and CXCL10 was measured via real time PCR. (D) CTL and STRN4KO THP-1 differentiated macrophages were treated with cGAMP (10 μg/mL) for 4 hours. Expression of IFNβ and CXCL10 was measured via quantitative PCR. (E) CTL and STRN4KO THP-1 differentiated macrophages were treated with cGAMP (10 μg/mL). Protein expression was analyzed by immunoblotting at different time points after stimulation. (F) THP-1 differentiated macrophages were treated with MST-1 inhibitor, XMU-MP-1 (1 μM), for 2 hours, before stimulation with cGAMP (10 μg/mL). 4 hours later, expression of IFNβ and CXCL10 was measured via real time PCR. (G) THP-1 differentiated macrophages were treated with or without cGAMP (10 μg/mL) and 1.5 hours later protein was collected. MST1/2 antibody was used for co-IP and blotted for PP2Ac and MST1/2. Data are from 1 experiment representative of 3 (for BE) and 2 (for A and G) independent experiments with similar results. Lanes (E and F) separated by black vertical line were run on the same gel but were noncontiguous. Error bars depict SEM. P values were calculated by 2-tailed unpaired t test. ***P < 0.001, ****P < 0.0001.
Figure 7
Figure 7. YAP/TAZ mediates STRN4-PP2Ac regulation of STING signaling in macrophage.
(A) GSEA of YAP targeted genes in PP2AcKO versus PP2AcWT BMDM treated with cGAMP using RNA-Seq data set from Figure 1A. (B) PP2AcKO and PP2AcWT BMDMs were treated with cGAMP and protein expression was analyzed. (C) CTL, PP2AcKO and YAP overexpressed PP2AcKO THP-1 differentiated macrophages were treated with cGAMP and protein expression was analyzed. (D) shYAP THP-1 differentiated macrophages were treated with cGAMP for 4 hours and ISGs expression was measured. (E) YAPs94A overexpressed THP-1 differentiated macrophages were treated with cGAMP for 4 hours. ISGs expression was measured (F) YAPs94A overexpressed THP-1 differentiated macrophages were treated with cGAMP and protein expression was analyzed. (G) Publicly available RNA-Seq data set of sorted MDM and MG from human glioma samples, and blood MDM and nontumor MG were obtained. GSEA of YAP WT- and YAPS94A-targeted genes in GBM MDM versus blood MDM and GBM MG versus nontumor MG. Data are from 1 experiment representative of 3 independent experiments. Error bars depict SEM. P values were calculated by 1-way ANOVA with Tukey’s multiple comparison test. *P < 0.05, ****P < 0.0001.
Figure 8
Figure 8. Tumor-induced YAP expression to suppress STING signaling in macrophage.
(A) Scheme of experimental workflow. (B) Histological analysis of CTL and PP2AKO THP-1 differentiated macrophages stained for YAP (green) and nucleus (DAPI, blue). Scale bar: 10 μm. Image representative of 4 independent regions (n = 4). (C) Quantification of YAP fluorescent intensity in selected regions. (D) YAP expression in TCM treated CTL and PP2AKO THP-1 differentiated macrophages. (E and F) After 5 days in ACM or TCM, CTL or PP2AcKO THP-1–differentiated macrophages were treated with cGAMP for 4 hours. CXCL10 expression was measured. (G) After 5 days in ACM or TCM, CTL or STRN4KO THP-1–differentiated macrophages were treated with cGAMP for 1.5 hours. MST1/2 antibody was used for co-IP and blotted for PP2Ac and MST1/2. (H) Model of PP2Ac/STRN4 mediated STING-IFN suppression in TAMs. cGAMP given at 10 μg/mL. Data are from 1 experiment representative of 3 independent experiments. Error bars depict SEM. P values were calculated by 1-way ANOVA with Tukey’s multiple comparison test. ****P < 0.0001.

References

    1. Deng L, et al. STING-Dependent cytosolic DNA sensing promotes radiation-induced type I Interferon-dependent antitumor immunity in immunogenic tumors. Immunity. 2014;41(5):843–852. doi: 10.1016/j.immuni.2014.10.019. - DOI - PMC - PubMed
    1. Burdette DL, Vance RE. STING and the innate immune response to nucleic acids in the cytosol. Nat Immunol. 2013;14(1):19–26. doi: 10.1038/ni.2491. - DOI - PubMed
    1. Woo SR, et al. STING-dependent cytosolic DNA sensing mediates innate immune recognition of immunogenic tumors. Immunity. 2014;41(5):830–842. doi: 10.1016/j.immuni.2014.10.017. - DOI - PMC - PubMed
    1. Sun L, et al. Cyclic GMP-AMP synthase is a cytosolic DNA sensor that activates the type I interferon pathway. Science. 2013;339(6121):786–791. doi: 10.1126/science.1232458. - DOI - PMC - PubMed
    1. Yum S, et al. TBK1 recruitment to STING activates both IRF3 and NF-κB that mediate immune defense against tumors and viral infections. Proc Natl Acad Sci U S A. 2021;118(14):e2100225118. doi: 10.1073/pnas.2100225118. - DOI - PMC - PubMed

Publication types