. 2023 Mar 22;8(6):e156057.
doi: 10.1172/jci.insight.156057.

Stabilization of E-cadherin adhesions by COX-2/GSK3β signaling is a targetable pathway in metastatic breast cancer

Affiliations

Stabilization of E-cadherin adhesions by COX-2/GSK3β signaling is a targetable pathway in metastatic breast cancer

Kuppusamy Balamurugan et al. JCI Insight. .

Abstract

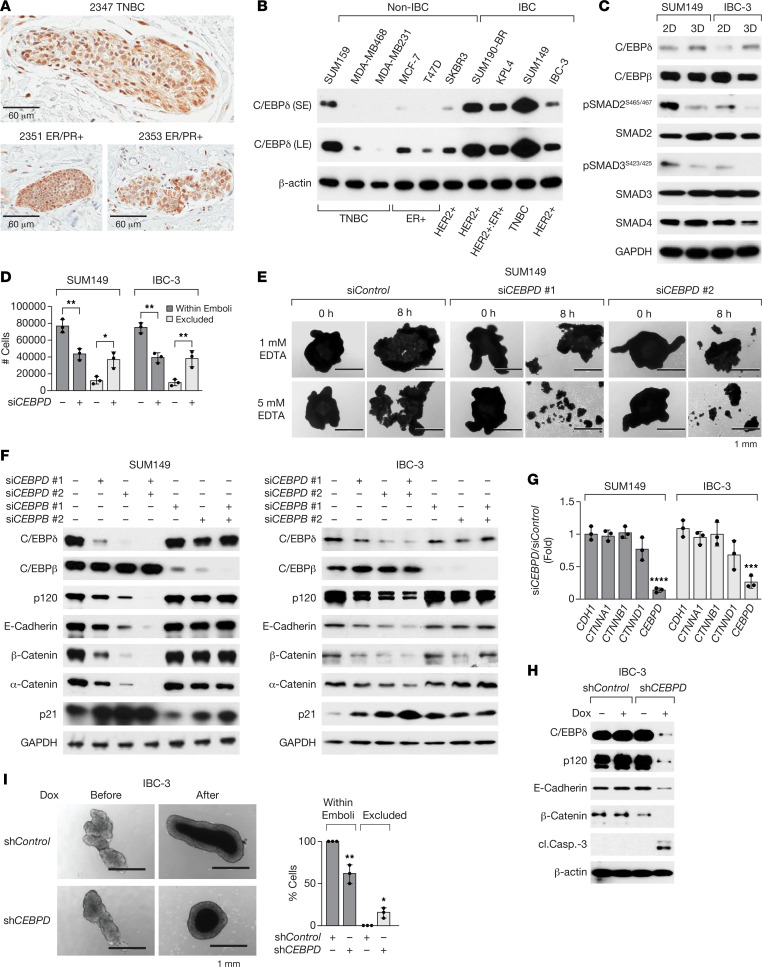
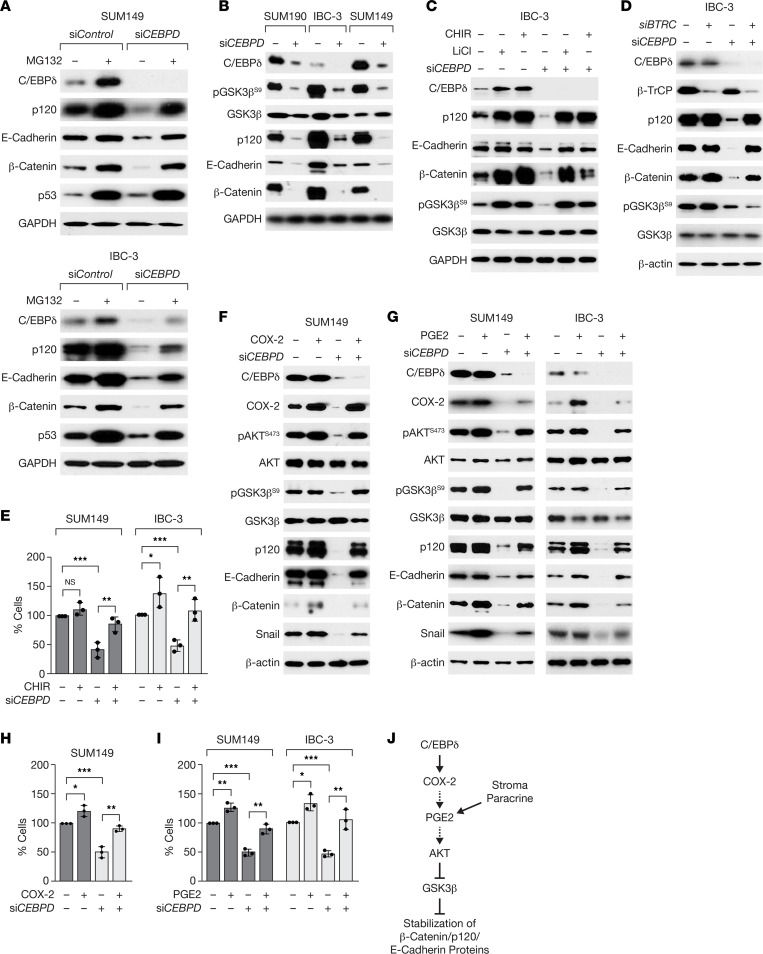
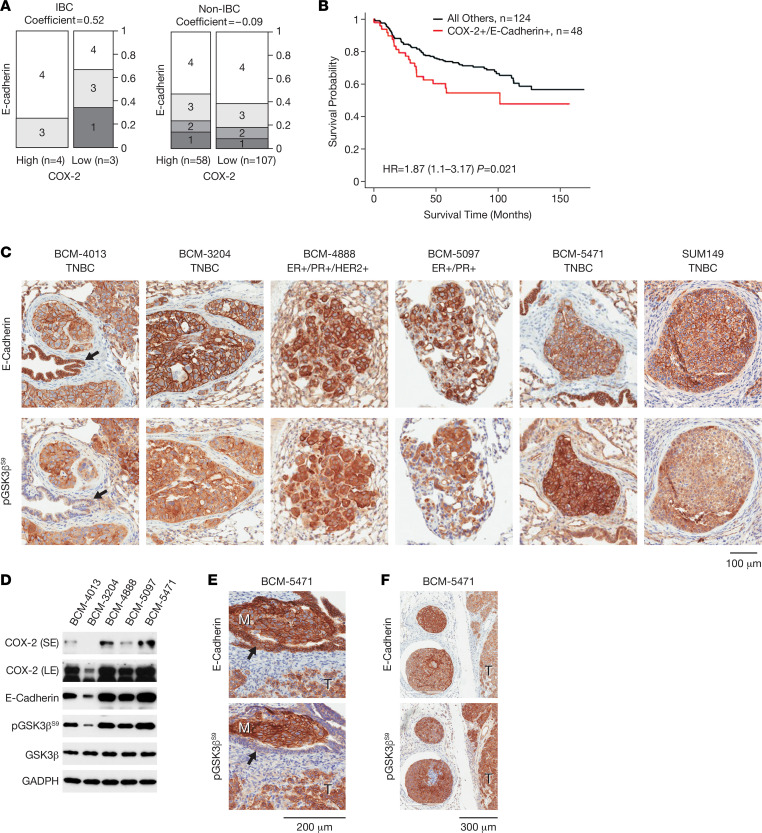
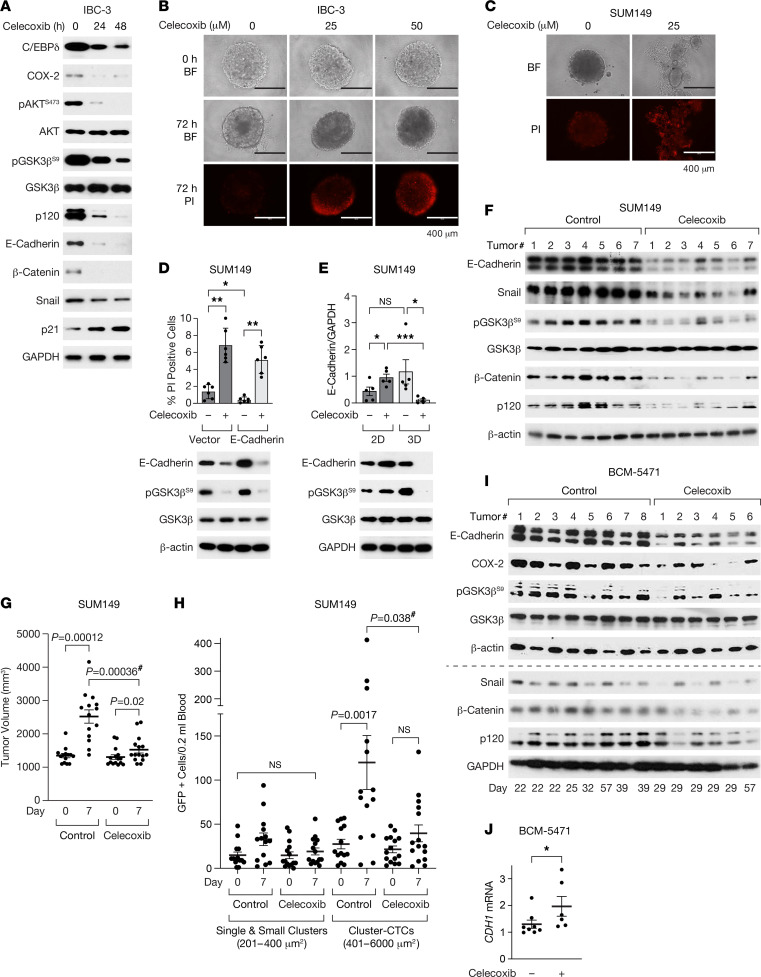
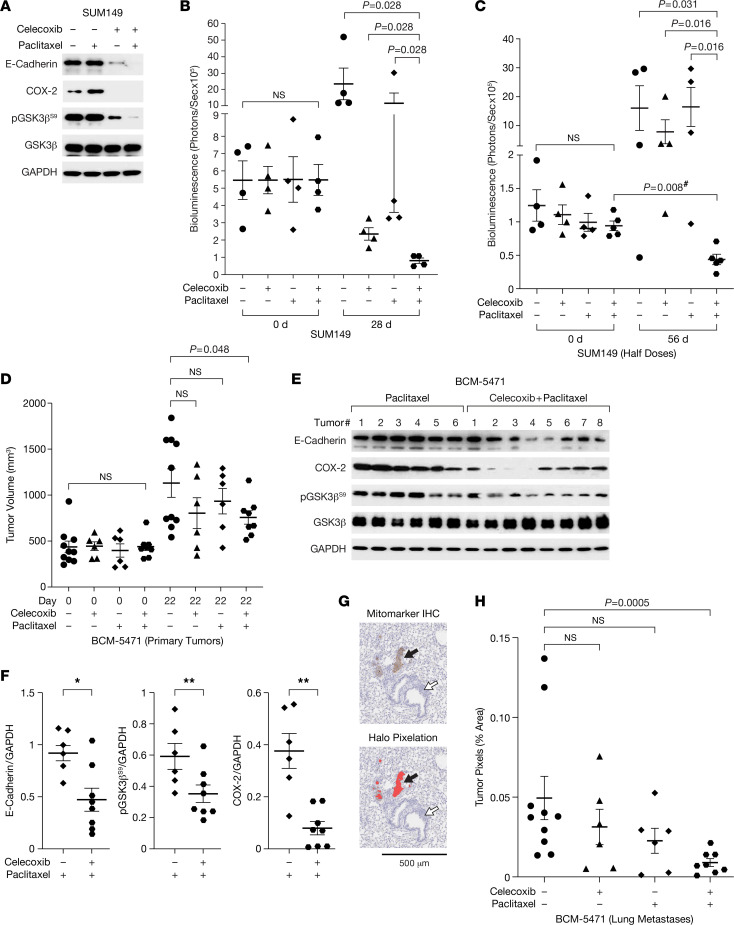
Metastatic progression of epithelial cancers can be associated with epithelial-mesenchymal transition (EMT) including transcriptional inhibition of E-cadherin (CDH1) expression. Recently, EM plasticity (EMP) and E-cadherin-mediated, cluster-based metastasis and treatment resistance have become more appreciated. However, the mechanisms that maintain E-cadherin expression in this context are less understood. Through studies of inflammatory breast cancer (IBC) and a 3D tumor cell "emboli" culture paradigm, we discovered that cyclooxygenase 2 (COX-2; PTGS2), a target gene of C/EBPδ (CEBPD), or its metabolite prostaglandin E2 (PGE2) promotes protein stability of E-cadherin, β-catenin, and p120 catenin through inhibition of GSK3β. The COX-2 inhibitor celecoxib downregulated E-cadherin complex proteins and caused cell death. Coexpression of E-cadherin and COX-2 was seen in breast cancer tissues from patients with poor outcome and, along with inhibitory GSK3β phosphorylation, in patient-derived xenografts (PDX) including triple negative breast cancer (TNBC).Celecoxib alone decreased E-cadherin protein expression within xenograft tumors, though CDH1 mRNA levels increased, and reduced circulating tumor cell (CTC) clusters. In combination with paclitaxel, celecoxib attenuated or regressed lung metastases. This study has uncovered a mechanism by which metastatic breast cancer cells can maintain E-cadherin-mediated cell-to-cell adhesions and cell survival, suggesting that some patients with COX-2+/E-cadherin+ breast cancer may benefit from targeting of the PGE2 signaling pathway.

Keywords: Breast cancer; Cell Biology; Cell migration/adhesion; Oncology; Signal transduction.


Conflict of interest statement

Conflict of interest: AJE has unlicensed patents related to the use of K14 as a biomarker in breast cancer and to the use of antibodies as cancer treatments (patent nos. US20140336282A1, US20220160868A1). AJE’s spouse is an employee of Immunocore.

Figures

Figure 1
Figure 1. C/EBPδ is expressed in IBC emboli in vivo and IBC cell lines in vitro and promotes cell-to-cell adhesion and E-cadherin protein expression.
(A) C/EBPδ immunostaining in emboli from 3 IBC patient tissues. Scale bars: 60 μm. (B) Western blot analysis of C/EBPδ expression in whole cell extracts of the indicated cell lines and BC subtypes. S/LE, short/long exposure. (C) Western blot analysis of indicated proteins in SUM149 and IBC-3 cell lines that were cultured on plastic (2D) or as emboli (3D) for 4 days. (D) Quantification of SUM149 or IBC-3 cells, transfected with siControl (–) or siCEBPD (+) oligos, that aggregated into large clusters (“within emboli”) or remained as single cells/smaller clusters (“excluded”) after 3 days in 3D culture (n = 3, mean ± SEM; *P < 0.05, **P < 0.01 compared with siControl). (E) Images of similarly sized emboli from SUM149 cells, transfected with control or 2 independent siCEBPD oligos, before and after treatment with EDTA for 8 hours (representative of 3 experiments). (F) Western blot analysis of the indicated proteins in established emboli of SUM149 and IBC-3 cells that had been transfected with siRNAs as indicated. (G) qPCR analysis of CDH1 (E-cadherin), CTNNA1 (α-catenin), CTNNB1 (β-catenin), CTNND1 (p120), and CEBPD mRNA levels in emboli of SUM149 and IBC-3 cells transfected with siCEBPD relative to siControl-transfected (n = 3, mean ± SEM; ***P < 0.001, ****P < 0.0001 compared with siControl). (H) Western blot analysis of IBC-3 cells with stable expression of the indicated inducible shRNA and after culture in 3D for 3 days plus 3 days in the presence of doxycycline (Dox, 100 ng/mL; cl.Casp.-3, cleaved caspase-3). (I) Left: Images of representative emboli as in H and the same embolus before and after treatment with Dox (10 ng/mL) for 7 days. Scale bar: 1 mm. Right: Quantification of the number of cells in emboli after treatment normalized to untreated control as 100% (n = 3, mean ± SEM; *P < 0.05; **P < 0.01).
Figure 2
Figure 2. C/EBPδ promotes expression of E-cadherin complex proteins through COX-2–mediated GSK3β inhibition.
(A) Western blot analysis of emboli from SUM149 and IBC-3 cells transfected with siRNA as indicated and treated with 20 μM MG132 for 6 hours. p53 was used as a control for MG132 treatment (83). (B) Western blot analysis of the indicated proteins in emboli from SUM190, IBC-3, and SUM149 cells that were transfected with control or siCEBPD oligos. (C) Western blot analysis of the indicated proteins in emboli from IBC-3 cells transfected with control (–) or siCEBPD oligos and treated with LiCl (10 mM) or CHIR (5 μM) for 6 hours. (D) Western blot analysis of the indicated proteins in emboli from IBC-3 cells transfected with control (–) or siCEBPD along with siBTRC (β-TrCP) oligos. (E) Analysis of the number of cells in emboli of SUM149 or IBC-3 cells that were transfected with siControl (–) or siCEBPD oligos and 24 hours later seeded in 3D for 3 days ± 1 μM CHIR (n = 3, mean ± SEM; *P < 0.05, **P < 0.01, ***P < 0.001). (F) Western blot analysis of the indicated proteins from SUM149 cells transfected with control (–) or siCEBPD (+) oligos and COX-2 expression plasmid followed by culture in 3D for 3 days. (G) Western blot analysis of the indicated proteins in SUM149 and IBC-3 emboli by cells transfected as in A followed by culture in 3D for 3 days ± PGE2 (1 μM). (H) Number of cells in SUM149 emboli as in F (% of control, n = 3, mean ± SEM; *P < 0.05, **P < 0.01, ***P < 0.001). (I) Number of cells in emboli of SUM149 and/or IBC-3 cells as in G (n = 3, mean ± SEM; *P < 0.05, **P < 0.01, ***P < 0.001). (J) Model summarizing the signaling pathway described in this study and indicating that PGE2 may be generated by autocrine or paracrine/stromal mechanisms.
Figure 3
Figure 3. The COX-2/GSK3β/E-cadherin pathway is conserved in a subset of breast cancers in vivo.
(A) Bar graph showing proportion of samples by different degrees of IHC staining of COX-2 and E-cadherin in IBC (n = 7) and non-IBC (n = 165) tumor tissues. Numbers 1–4 within boxes (along with dark to lighter shades of gray) denotes low to high expression levels of E-cadherin. Columns represent high (score 3–4) versus low (score 1–2) COX-2 expressing samples. Width of columns and scale denotes relative proportion of samples with different combinations of scores. “Coefficient” refers to Pearson correlation coefficient for COX-2 and E-cadherin expression. (B) Kaplan-Meier plot with the hazard ratio (HR) and 95% CI from a Cox regression analysis comparing patients with high expression of both, COX-2 and E-cadherin, against all other patients (reference group). Patients with high COX-2 and E-cadherin expression (denoted as COX-2+/E-cadherin+) in their tumors have a significantly decreased breast cancer-specific survival when compared with all other patients (P = 0.021). (C) Immunostaining of E-cadherin and pGSK3βS9 on serial sections of lung metastases from PDX primary tumors of the indicated breast cancer subtypes and an experimental metastasis by SUM149 cells. Black arrows indicate bronchial epithelium (BCM-4013). (D) Western blot analysis of tumor tissue extracts from the indicated PDX models. S/LE, short/long exposure. (E) Immunostaining as in C of BCM-5471 showing a micrometastasis within a mammary duct (M, metastasis; T, tumor; arrow, mouse mammary epithelium). Scale bar: 200 μm. (F) BCM-5471 as in C showing emboli-like structures next to primary tumor (T). Scale bar: 300 μm.
Figure 4
Figure 4. The COX-2 inhibitor celecoxib downregulates E-cadherin protein in vivo and reduces SUM149 tumor growth and cluster CTCs.
(A) Western blot analysis of IBC-3 emboli established after 3 days of culture in 3D followed by treatment for the indicated times with 50 μM celecoxib (0 hours = 48 hours DMSO). (B) Images of representative IBC-3 emboli after 3 days of culture (0 hours) and the same emboli following another 72 hours with celecoxib and stained with propidium iodide (PI) to label dying cells as indicated (representative of 3 experiments; BF, bright-field). Scale bar: 400 μm. (C) Representative images of SUM149 cells cultured in 3D ± celecoxib for 72 hours and stained with PI (representative of 3 experiments; BF, bright-field). Scale bar: 400 μm. (D) Assessment of cell death by PI staining (top panel) and Western blot analysis (bottom panel) from SUM149 cells that were transfected with empty vector or E-cadherin–expressing plasmid followed by culture in 3D for 1 day and treated with celecoxib for additional 3 days (n = 3, mean ± SEM; *P < 0.05, **P < 0.01). (E) Western blot analysis (bottom panel) of SUM149 cells cultured on plastic (2D) or as emboli (3D) for 3 days followed by treatment with celecoxib for another 3 days, and quantification of E-cadherin from 5 independent experiments (n = 5; *P < 0.05, ***P < 0.001). (F and G) Western blot (F) and tumor volume (G) analysis of SUM149-GFP-Luc orthotopic tumors from mice fed control chow or celecoxib chow for 7 days starting at tumor volumes > 1,000 mm3 (n =14–15, paired or unpaired [indicated with #] 2-sided Wilcoxon rank-sum test). (H) CTC analysis of peripheral blood drawn from mice as in F and G (n =14–15, paired or unpaired [indicated with #] 2-sided Wilcoxon rank-sum test). (I and J) Western blot (I) and CDH1 mRNA (J) analysis of BCM-5471 PDX tumors from mice that were fed control chow or celecoxib chow for the indicated number of days (determined by study end points) starting when tumor volumes were 300–600 mm3 (n = 6–8; *P = 0.029 by unpaired 2-sided Wilcoxon rank-sum test).
Figure 5
Figure 5. Celecoxib combination with paclitaxel attenuates experimental and spontaneous lung metastases.
(A) Western blot analysis of the indicated proteins in SUM149 emboli after exposure to 50 μM celecoxib and/or 10 nM paclitaxel for 3 days (total time in 3D, 6 days). (B) Quantification of bioluminescence in the lungs of mice (n = 4) with experimental metastases of SUM149-GFP-Luc cells before (day 0) or after 28 days of treatment with celecoxib (1,000 mg/kg chow) and/or paclitaxel (10 mg/kg i.v.). *P = 0.028 by unpaired 2-sided Wilcoxon rank-sum test. (C) Quantification of bioluminescence in mice (n = 4–5) as in B after 56 days of treatment with celecoxib (500 mg/kg chow) and/or paclitaxel (5 mg/kg i.v.). P values as indicated by unpaired or paired (indicated with #) 2-sided Wilcoxon rank-sum test. (D) Tumor volume measurements of BCM-5471 PDX in mice on day 0 and 22 of treatment as in B (n = 6–10, P values as indicated by 2-sided t test). (E) Western blot analysis of BCM-5471 PDX tumors from mice in D after treatment with paclitaxel ± celecoxib. (F) Quantification of E-cadherin, pGSK3βS9, and COX-2 signals in E (n = 6–8, mean ± SEM; P values by unpaired 2-sided Wilcoxon rank-sum test; *P < 0.05, **P < 0.01). (G) Light microscope image of a mouse lung section from the experiment in D showing representative micrometastases immunostained with human-specific “mitomarker“ (top panel) and their pixilation by the Halo image analysis software (bottom panel). The black arrow points to a micrometastasis. The white arrow points to bronchial tissue. Scale bar: 500 μm. (H) Quantification of tumor cell pixels in representative sections of lungs from mice as in G (% of total lung area, n = 6–10; P = 0.0005 by unpaired Wilcoxon rank-sum test).

References

    1. Lim B, et al. Inflammatory breast cancer biology: the tumour microenvironment is key. Nat Rev Cancer. 2018;18(8):485–499. doi: 10.1038/s41568-018-0010-y. - DOI - PubMed
    1. Morrow RJ, et al. Challenging a misnomer? The role of inflammatory pathways in inflammatory breast cancer. Mediators Inflamm. 2017;2017:4754827. - PMC - PubMed
    1. Wang X, et al. Targeting signaling pathways in inflammatory breast cancer. Cancers (Basel) 2020;12(9):2479. doi: 10.3390/cancers12092479. - DOI - PMC - PubMed
    1. Chattopadhyay I, et al. Exploring the crosstalk between inflammation and epithelial-mesenchymal transition in cancer. Mediators Inflamm. 2021;2021:9918379. - PMC - PubMed
    1. Gupta A, et al. Role of E-cadherins in development of lymphatic tumor emboli. Cancer. 2003;97(9):2341–2347. doi: 10.1002/cncr.11332. - DOI - PubMed

Publication types