. 2023 Feb 9;18(2):e0281233.
doi: 10.1371/journal.pone.0281233. eCollection 2023.

TFIID dependency of steady-state mRNA transcription altered epigenetically by simultaneous functional loss of Taf1 and Spt3 is Hsp104-dependent

Affiliations

TFIID dependency of steady-state mRNA transcription altered epigenetically by simultaneous functional loss of Taf1 and Spt3 is Hsp104-dependent

Ryo Iwami et al. PLoS One. .

Abstract

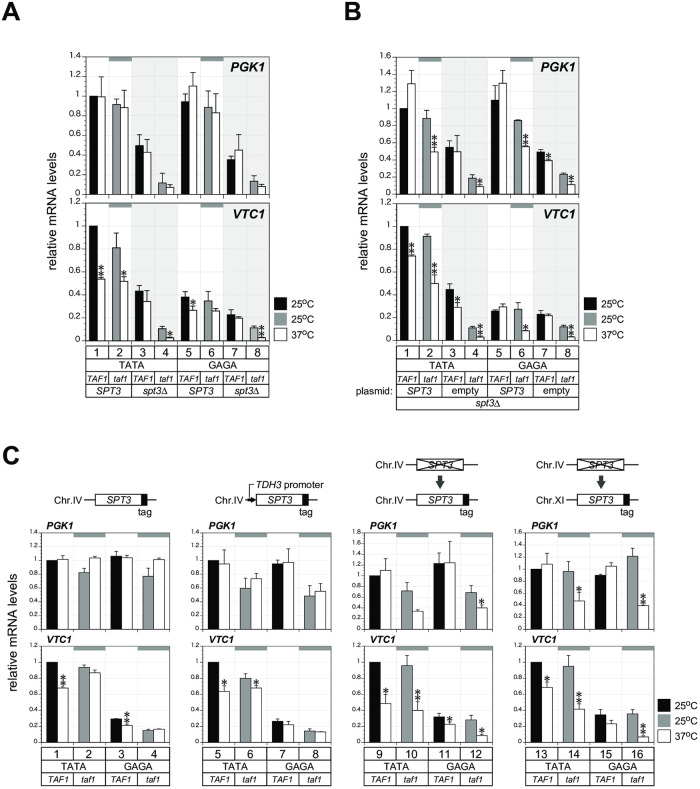
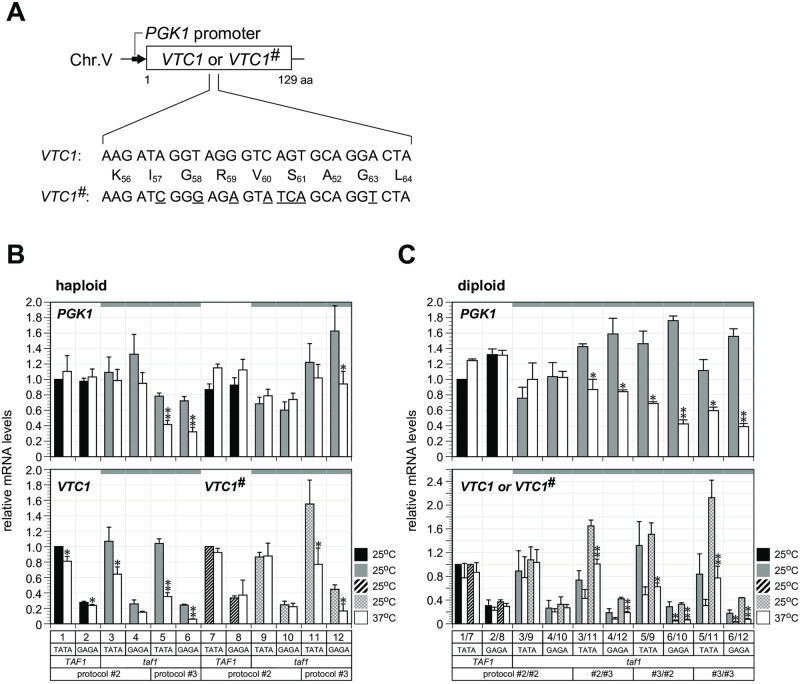
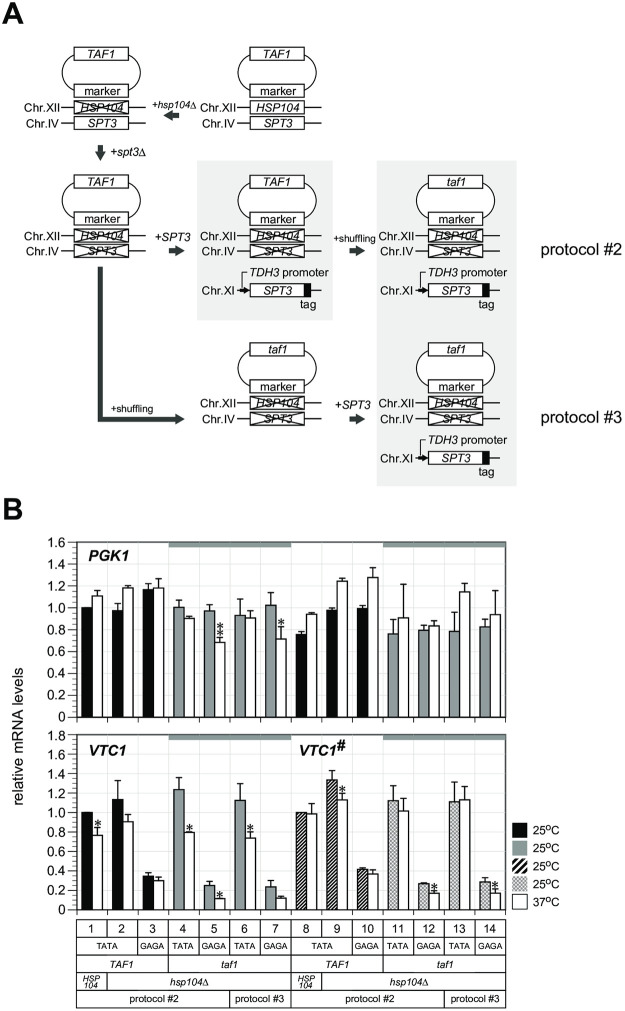
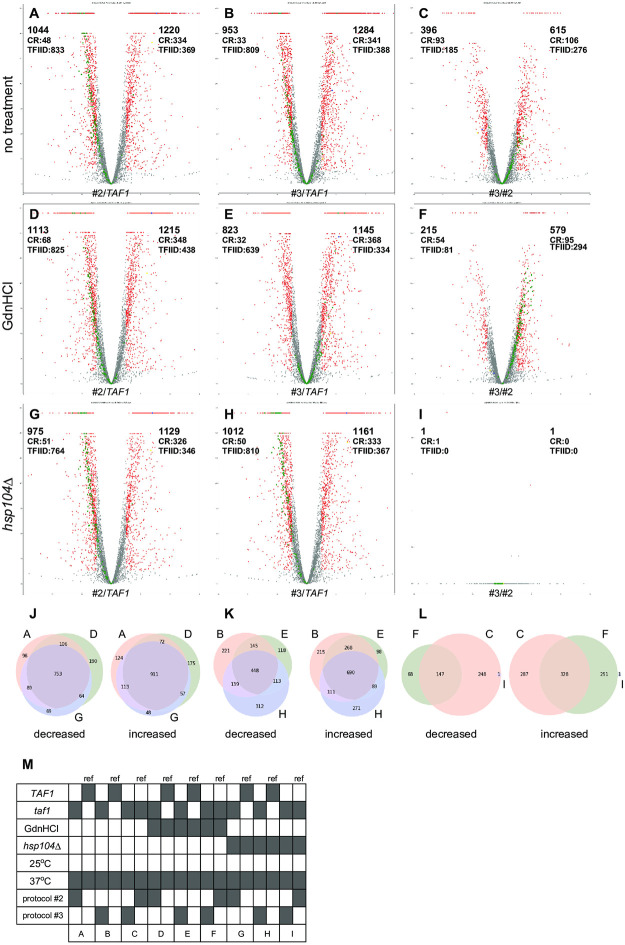
In Saccharomyces cerevisiae, class II gene promoters have been divided into two subclasses, TFIID- and SAGA-dominated promoters or TFIID-dependent and coactivator-redundant promoters, depending on the experimental methods used to measure mRNA levels. A prior study demonstrated that Spt3, a TBP-delivering subunit of SAGA, functionally regulates the PGK1 promoter via two mechanisms: by stimulating TATA box-dependent transcriptional activity and conferring Taf1/TFIID independence. However, only the former could be restored by plasmid-borne SPT3. In the present study, we sought to determine why ectopically expressed SPT3 is unable to restore Taf1/TFIID independence to the PGK1 promoter, identifying that this function was dependent on the construction protocol for the SPT3 taf1 strain. Specifically, simultaneous functional loss of Spt3 and Taf1 during strain construction was a prerequisite to render the PGK1 promoter Taf1/TFIID-dependent in this strain. Intriguingly, genetic approaches revealed that an as-yet unidentified trans-acting factor reprogrammed the transcriptional mode of the PGK1 promoter from the Taf1/TFIID-independent state to the Taf1/TFIID-dependent state. This factor was generated in the haploid SPT3 taf1 strain in an Hsp104-dependent manner and inherited meiotically in a non-Mendelian fashion. Furthermore, RNA-seq analyses demonstrated that this factor likely affects the transcription mode of not only the PGK1 promoter, but also of many other class II gene promoters. Collectively, these findings suggest that a prion or biomolecular condensate is generated in a Hsp104-dependent manner upon simultaneous functional loss of TFIID and SAGA, and could alter the roles of these transcription complexes on a wide variety of class II gene promoters without altering their primary sequences. Therefore, these findings could provide the first evidence that TFIID dependence of class II gene transcription can be altered epigenetically, at least in Saccharomyces cerevisiae.


Conflict of interest statement

The authors have declared that no competing interests exist.

Figures

Fig 1
Fig 1. Taf1/TFIID dependence of PGK1 transcription is dependent on the method used for SPT3 taf1-N568Δ strain construction.
(A) RT-qPCR analyses to measure mRNA levels of PGK1 (top panel) or VTC1 (bottom panel) in the eight strains expressing the VTC1 reporter driven by the TATA box-intact PGK1 promoter (lanes 1–4) or the GAGA mutant (lanes 5–8), as indicated below the bottom panel. In these strains, chromosomal TAF1 was deleted and then substituted with plasmid-encoded TAF1 (odd-numbered lanes) or taf1-N568Δ (even-numbered lanes), while chromosomal SPT3 was either intact (lanes 1, 2, 5, and 6) or deleted (lanes 3, 4, 7, and 8), as indicated below the bottom panel. The strains used are YTK16989 (lane 1), YTK16993 (lane 2), YTK17025 (lane 3), YTK17029 (lane 4), YTK16995 (lane 5), YTK16999 (lane 6), YTK17031 (lane 7), and YTK17035 (lane 8). Strains were cultivated at 25ºC and further incubated at 37ºC for 2 h in synthetic medium containing 2% glucose, as indicated at the right side of the VTC1 panel. mRNA levels (mean ± SD of three biological replicates) were quantified and normalized to SCR1 signal. All data are presented relative to that of lane 1 (25°C). The significance of differences between cultivation at 25°C and 37°C was assessed for each strain by t-test: * p < 0.05; ** p < 0.01. Reporter VTC1 mRNA was more heat-sensitive than endogenous PGK1 mRNA, even in the wild type strain (lane 1), as already shown by Northern blot analyses in a previous study [25]. The results from spt3Δ cells are shaded (lanes 3–4 and 7–8), while those obtained from SPT3 taf1 cells are labeled with gray bars at the top of the graph (lanes 2 and 6). (B) RT-qPCR analyses to measure mRNA levels of PGK1 (top panel) or VTC1 (bottom panel) in the eight strains carrying the VTC1 reporter driven by the PGK1 promoter, in which the TATA box was intact (lanes 1–4) or substituted with the GAGA sequence (lanes 5–8), as indicated below the bottom panel. In these strains, chromosomal TAF1 was deleted and substituted with plasmid-encoded TAF1 (odd-numbered lanes) or taf1-N568Δ (even-numbered lanes), while chromosomal SPT3 was deleted and then substituted with plasmid-encoded V5 epitope-tagged SPT3 (lanes 1, 2, 5, and 6) or empty vector (lanes 3, 4, 7, and 8), as indicated below the bottom panel. Notably, SPT3 expression plasmid or empty vector was introduced into taf1Δ spt3Δ strains carrying TAF1 or taf1-N568Δ expression plasmids. The strains used were YTK17039 (lane 1), YTK17047 (lane 2), YTK17037 (lane 3), YTK17045 (lane 4), YTK17051 (lane 5), YTK17059 (lane 6), YTK17049 (lane 7), and YTK17057 (lane 8). Cultivation and data presentation were conducted as described in A. (C) RT-qPCR analyses to measure mRNA levels of PGK1 (top panel) or VTC1 (bottom panel) in the sixteen strains carrying the VTC1 reporter driven by the PGK1 promoter in which the TATA box was intact (lanes 1, 2, 5, 6, 9, 10, 13, and 14) or substituted with the GAGA sequence (lanes 3, 4, 7, 8, 11, 12, 15, and 16), as indicated below the bottom panel. The strains used in the first (lanes 1–4) or second (lanes 5–8) panel were generated by replacing chromosomal SPT3 in the strains used in A (lanes 1, 2, 5, and 6) with V5 epitope-tagged SPT3 driven by the SPT3 promoter (lanes 1–4) or by the ectopic TDH3 promoter (lanes 5–8). Similarly, the strains used in the third panel (lanes 9–12) or fourth panel (lanes 13–16) were generated by integrating V5 epitope-tagged SPT3 driven by the SPT3 promoter into the original SPT3 locus (lanes 9–12) or the AUR1 locus (lanes 13–16) of the strains used in A (lanes 3, 4, 7, and 8), respectively. The strains used were YTK18751 (lane 1), YTK18778 (lane 2), YTK18766 (lane 3), YTK18789 (lane 4), YTK20400 (lane 5), YTK20415 (lane 6), YTK20413 (lane 7), YTK20425 (lane 8), YTK19100 (lane 9), YTK19102 (lane 10), YTK19105 (lane 11), YTK19108 (lane 12), YTK19261 (lane 13), YTK19267 (lane 14), YTK19265 (lane 15), and YTK19272 (lane 16). Cultivation and data presentation were conducted as described in A.
Fig 2
Fig 2. Examination of Taf1/TFIID dependence of PGK1 transcription using the allele-specific VTC1 reporter system.
(A) Strains used in experiments to examine allele-specific expression of the PGK1 promoter were constructed by replacing the VTC1 reporter with the VTC1# reporter carrying eight silent mutations (underlined). Promoter activities were analyzed by RT-qPCR using primers specific for each VTC1 reporter allele. (B) RT-qPCR analysis to measure mRNA levels of PGK1 (top panel) or VTC1/VTC1# (bottom panel) in the twelve haploid strains carrying VTC1 (lanes 1–6) or the VTC1# reporter (lanes 7–12) driven by the PGK1 promoter in which the TATA box was intact (odd-numbered lanes) or substituted with the GAGA sequence (even-numbered lanes), as indicated below the bottom panel. These strains were generated by construction protocol #2 (lanes 1–4 and 7–10) or #3 (lanes 5–6 and 11–12), as indicated below the bottom panel and described in S1A Fig. The strains used are YTK19317 (lane 1), YTK19319 (lane 2), YTK19401 (lane 3), YTK19402 (lane 4), YTK19489 (lane 5), YTK19492 (lane 6), YTK19663 (lane 7), YTK19665 (lane 8), YTK19664 (lane 9), YTK19666 (lane 10), YTK19716 (lane 11), and YTK19717 (lane 12). Cultivation and data presentation were conducted as described in Fig 1A. (C) RT-qPCR analysis to measure PGK1 mRNA levels (top panel) or VTC1/VTC1# mRNA levels (bottom panel) in the ten diploid strains carrying both of the VTC1 and VTC1# reporters driven by the PGK1 promoter in which the TATA box was intact (lanes 1/7, 3/9, 3/11, 5/9, and 5/11) or substituted with the GAGA sequence (lanes 2/8, 4/10, 4/12, 6/10, and 6/12), as indicated below the bottom panel. These diploid strains YTK19748 (lanes 1/7), YTK19749 (lanes 2/8), YTK19765 (lanes 3/9), YTK19766 (lanes 4/10), YTK19767 (lanes 3/11), YTK19768 (lanes 4/12), YTK19746 (lanes 5/9), YTK19747 (lanes 6/10), YTK19763 (lanes 5/11), and YTK19764 (lanes 6/12), were obtained by crossing the two specific haploid strains listed in each lane of B. For instance, YTK19748 (lanes 1/7) was obtained by crossing YTK19317 (lane 1 in B) and YTK19663 (lane 7 in B). The other lanes are also numbered accordingly. Cultivation and data presentation were conducted as described in Fig 1A, except that the two sets of data measured individually for each reporter allele were presented together in one lane.
Fig 3
Fig 3. Effect of the hsp104Δ mutation on Taf1/TFIID dependence of the PGK1 promoter via protocol #3.
(A) Schematic outline of strain construction protocols #2 and #3 in strains harboring the hsp104Δ mutation. These protocols were the same as described in S1A Fig, except that the starting strain carried the hsp104Δ mutation. (B) RT-qPCR analysis to measure PGK1 mRNA levels (top panel) or VTC1/VTC1# mRNA levels (bottom panel) in the 14 haploid strains carrying VTC1 (lanes 1–7) or the VTC1# reporter (lanes 8–14) driven by the PGK1 promoter in which the TATA box was intact (lanes 1, 2, 4, 6, 8, 9, 11, and 13) or substituted with the GAGA sequence (lanes 3, 5, 7, 10, 12, and 14), as indicated below the bottom panel. These strains were generated by protocol #2 (lanes 1–5 and 8–12) or #3 (lanes 6–7 and 13–14), respectively, as indicated below the bottom panel and as described in A. The strains used were YTK19317 (lane 1), YTK20037 (lane 2), YTK20039 (lane 3), YTK20038 (lane 4), YTK20040 (lane 5), YTK20049 (lane 6), YTK20050 (lane 7), YTK19663 (lane 8), YTK20041 (lane 9), YTK20043 (lane 10), YTK20042 (lane 11), YTK20044 (lane 12), YTK20051 (lane 13), and YTK20052 (lane 14).
Fig 4
Fig 4. Volcano plot analyses of the gene expression profiles of #2 and #3 strains reveal HSP104 dependency of differential gene expression.
TPM data of the RNA-seq analyses obtained from two biological replicates of six strains with and without taf1 or hsp104Δ mutations after cultivation under various conditions, which are indicated in the bottom panel, were averaged and subjected to volcano plot analyses. Fold changes of gene expression in the #2 strain or #3 strain relative to that in the TAF1 strain are shown in A and B, respectively. Similarly, fold changes of gene expression in the #3 strain relative to that in the #2 strain are shown in C. The analogous three sets of comparisons were conducted for the TPM data derived from strains cultivated in the presence of Gdn-HCl (D, E, F) or the hsp104Δ mutation (G, H, I). In A–I, the genes considered to be significantly differentially expressed (> 2-fold change, p < 0.05) are indicated with red dots, while ribosomal protein genes, ~95% of which are TFIID-dependent genes [10], are indicated with green dots. Furthermore, the numbers of class II genes or those of the subclasses CR or TFIID-dependent, that were significantly differentially expressed, are shown in the upper left or upper right corners of A–I. The overlaps among these differentially expressed class II genes across A, D, and G (#2 strain versus TAF1), B, E, and H (#3 strain versus TAF1) and C, F, and I (#3 strain versus #2 strain) are visualized by Venn diagrams in J, K, and L, respectively. The cultivation conditions and comparison details for A-I are summarized in M. The strains used were YTK19317 (A, B, D, E), YTK19401 (A, C, D, F), YTK19489 (B, C, E, F), YTK20037 (G, H), YTK20038 (G, I), and YTK20049 (H, I). Cultivation was performed as described in Fig 1A and S4 Fig.

Similar articles

References

    1. Rhee HS, Pugh BF. Genome-wide structure and organization of eukaryotic pre-initiation complexes. Nature. 2012;483(7389):295–301. doi: 10.1038/nature10799 . - DOI - PMC - PubMed
    1. Thomas MC, Chiang CM. The general transcription machinery and general cofactors. Crit Rev Biochem Mol Biol. 2006;41(3):105–78. doi: 10.1080/10409230600648736 . - DOI - PubMed
    1. Ben-Shem A, Papai G, Schultz P. Architecture of the multi-functional SAGA complex and the molecular mechanism of holding TBP. FEBS J. 2021;288(10):3135–47. Epub 20200929. doi: 10.1111/febs.15563 . - DOI - PubMed
    1. Hahn S, Young ET. Transcriptional regulation in Saccharomyces cerevisiae: transcription factor regulation and function, mechanisms of initiation, and roles of activators and coactivators. Genetics. 2011;189(3):705–36. doi: 10.1534/genetics.111.127019 . - DOI - PMC - PubMed
    1. Roeder RG. 50+ years of eukaryotic transcription: an expanding universe of factors and mechanisms. Nat Struct Mol Biol. 2019;26(9):783–91. Epub 20190822. doi: 10.1038/s41594-019-0287-x . - DOI - PMC - PubMed

Publication types

MeSH terms

Substances

LinkOut - more resources