. 2023 Feb 9;18(2):e0281452.
doi: 10.1371/journal.pone.0281452. eCollection 2023.

Application-specific approaches to MicroCT for evaluation of mouse models of pulmonary disease

Affiliations

Application-specific approaches to MicroCT for evaluation of mouse models of pulmonary disease

Elizabeth F Redente et al. PLoS One. .

Abstract

The advent of micro-computed tomography (microCT) has provided significant advancement in our ability to generate clinically relevant assessments of lung health and disease in small animal models. As microCT use to generate outcomes analysis in pulmonary preclinical models has increased there have been substantial improvements in image quality and resolution, and data analysis software. However, there are limited published methods for standardized imaging and automated analysis available for investigators. Manual quantitative analysis of microCT images is complicated by the presence of inflammation and parenchymal disease. To improve the efficiency and limit user-associated bias, we have developed an automated pulmonary air and tissue segmentation (PATS) task list to segment lung air volume and lung tissue volume for quantitative analysis. We demonstrate the effective use of the PATS task list using four distinct methods for imaging, 1) in vivo respiration controlled scanning using a flexiVent, 2) longitudinal breath-gated in vivo scanning in resolving and non-resolving pulmonary disease initiated by lipopolysaccharide-, bleomycin-, and silica-exposure, 3) post-mortem imaging, and 4) ex vivo high-resolution scanning. The accuracy of the PATS task list was compared to manual segmentation. The use of these imaging techniques and automated quantification methodology across multiple models of lung injury and fibrosis demonstrates the broad applicability and adaptability of microCT to various lung diseases and small animal models and presents a significant advance in efficiency and standardization of preclinical microCT imaging and analysis for the field of pulmonary research.


Conflict of interest statement

The authors have declared that no competing interests exist.

Figures
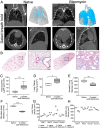
Fig 1
Fig 1. Respiration-gated imaging in bleomycin induced fibrosis.
(A) microCT images from a respiration-gated scan of a saline and a bleomycin-instilled mouse 3 weeks post-instillation imaged on a Bruker Skyscan 1276 at 35 μm resolution. Representative images of coronal (top left), transverse (bottom left), and sagittal (bottom right) slices and a 3D surface rendering of aerated (gray) and tissue (blue) volume overlay (top right) are shown. (B) Representative images of lung tissue sections stained with Masson’s Trichrome (Magnification 2X (left) and 20X (right). (C) Hydroxyproline content in lungs. PATS task list quantification of (D) lung tissue volume (E) aerated lung volume and (F) structure linear density. Scatterplots of comparing (G) lung tissue volumes and (H) aerated lung volumes calculated from automated ROI generation (Auto 1 = CTAn (Bruker) and Auto 2 = Amira-Avizo (ThermoFisher) compared ROIs generated manually by two individuals. Open symbols = naïve lung values. Closed symbols = bleomycin lung values. n = 5 mice/group. Graphed as box and whisker plot (min, max with mean). *p<0.05, **p<0.01, ***p<0.001, 2-tailed t-test with Welch’s correction.
Fig 2
Fig 2. Correlation analysis between automated and manually generated ROIs.
Respiration-gated Imaging in bleomycin induced fibrosis. Heat maps of: (A) aerated lung volume comparisons by R2 and R (Pearson’s correlation) for naïve and bleomycin-treated mice. (B) Lung tissue volume comparisons by R2 and R (Pearson’s correlation) for naïve and bleomycin-treated mice. Auto 1 = CTAn (Bruker) and Auto 2 = Amira-Avizo (ThermoFisher) automated generation of ROI. Man1 and Man2 = two independent generations of manual ROIs.
Fig 3
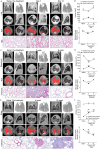
Fig 3. Longitudinal Imaging during the development, resolution and progression of lung disease.
For longitudinal studies, mice were scanned on a Bruker Skyscan 1276 at 35 μm resolution. (A) Representative image of naïve mice scanned prior to instillation with LPS (left panels, pre-treatment), 7 days post-instillation (middle panels), and 14 days post-instillation (right panels). Images include coronal (top left), transverse (middle left), and sagittal (middle right) slices and a 3D surface rendering of aerated (gray) and tissue (blue) volume overlay (top right). PATS generated ROI for aerated lung (red, left) and lung tissue (red, right) are shown. Representative H&E images (Total Magnification 20X). (n = 3 mice/group). (B) Quantification of the aerated lung volume, tissue lung volume and structure linear density using the PATS task list. (C) Representative images of naïve mice scanned prior to instillation with bleomycin (left panels, pre-treatment), 3 weeks post-instillation (middle panels), and 8 weeks post-instillation (right panels). Images include coronal (top left), transverse (middle left), and sagittal (middle right) slices and a 3D surface rendering of aerated (gray) and tissue (blue) volume overlay (top right). PATS generated ROI for aerated lung (red, left) and lung tissue (red, right) are shown. Representative Masson’s Trichrome images (Total Magnification 20X). (n = 5 mice/group). (D) Quantification of the aerated lung volume, tissue lung volume and structure linear density using the PATS task list. (E) Representative images of naïve mice scanned prior to instillation with silica (left panels, pre-treatment), 8 weeks post-instillation (middle panels), and 12 weeks post-instillation (right panels). Images include coronal (top left), transverse (middle left), and sagittal (middle right) slices and a 3D surface rendering of aerated (gray) and tissue (blue) volume overlay (top right). PATS generated ROI for aerated lung (red, left) and lung tissue (red, right) are shown. Representative Masson’s Trichrome images (Total Magnification 20X). (n = 5 mice/group). (F) Quantification of aerated and lung tissue volumes, tissue lung volume and structure linear density using the PATS task list. *p<0.05, **p<0.01, ***p<0.001, ##p<0.01 compared to 8-week data. Open circles = aerated lung volume. Close circles = lung tissue volume. Graphed mean±SEM. *p<0.05, **p<0.01, ***p<0.001, 2-tailed t-test with Welch’s correction.
Fig 4
Fig 4. Post-mortem imaging after nitrogen inflation.
(A) microCT images obtained using a Bruker Skyscan 1176 of the lungs of naïve (n = 4) or silica-instilled mice (n = 6) following nitrogen inflation. Representative images of coronal (top left), transverse (bottom left), and sagittal (bottom right) slices and a 3D surface rendering of aerated (gray) and tissue (blue) volume overlay (top right). Quantification of the (B) aerated lung volume, (C) lung tissue volume and (D) structure linear density are provided using the PATS task list. Graphed as box and whisker plot (min, max with mean). *p<0.05, ns = not significant. 2-tailed t-test with Welch’s correction.
Fig 5
Fig 5. Post-mortem imaging of fixed ex vivo lungs.
(A) microCT images from chemically dried lungs scanned using a Bruker Skyscan 1176 at 9 μm resolution from naïve mice (left panels) (n = 4), and mice 8 weeks post silica-instillation (right panels) (n = 6). Representative images of coronal (top left), transverse (bottom left), and sagittal (bottom right) slices and a 3D surface rendering of tissue volume (top right) are shown. Quantification of (B) structure thickness, (C) lung tissue volume and (D) structure linear density were generated using the ex vivo task list. Graphed as box and whisker plot (min, max with mean). *p<0.05, ***p<0.001, 2-tailed t-test with Welch’s correction.
Fig 6
Fig 6. Summary and considerations of imaging modalities.
A flow chart of assessment for study requirements to determine the appropriate imaging approach and associated limitations for: longitudinal-, respiration-gated-, nitrogen-inflation- and ex vivo-imaging.

Similar articles

Cited by

References

    1. Wu EK, Eliseeva S, Rahimi H, Schwarz EM, Georas SN. Restrictive lung disease in TNF-transgenic mice: correlation of pulmonary function testing and micro-CT imaging. Exp Lung Res. 2019;45(7):175–87. Epub 2019/07/19. doi: 10.1080/01902148.2019.1636899 . - DOI - PMC - PubMed
    1. Dekoster K, Decaesteker T, Berghen N, Van den Broucke S, Jonckheere AC, Wouters J, et al.. Longitudinal micro-computed tomography-derived biomarkers quantify non-resolving lung fibrosis in a silicosis mouse model. Sci Rep. 2020;10(1):16181. Epub 2020/10/02. doi: 10.1038/s41598-020-73056-6 . - DOI - PMC - PubMed
    1. Shofer S, Badea C, Auerbach S, Schwartz DA, Johnson GA. A micro-computed tomography-based method for the measurement of pulmonary compliance in healthy and bleomycin-exposed mice. Exp Lung Res. 2007;33(3–4):169–83. Epub 2007/06/15. doi: 10.1080/01902140701364458 . - DOI - PMC - PubMed
    1. Rodt T, von Falck C, Dettmer S, Halter R, Maus R, Ask K, et al.. Micro-computed tomography of pulmonary fibrosis in mice induced by adenoviral gene transfer of biologically active transforming growth factor-beta1. Respir Res. 2010;11:181. Epub 2010/12/24. doi: 10.1186/1465-9921-11-181 . - DOI - PMC - PubMed
    1. Vande Velde G, De Langhe E, Poelmans J, Dresselaers T, Lories RJ, Himmelreich U. Magnetic resonance imaging for noninvasive assessment of lung fibrosis onset and progression: cross-validation and comparison of different magnetic resonance imaging protocols with micro-computed tomography and histology in the bleomycin-induced mouse model. Invest Radiol. 2014;49(11):691–8. Epub 2014/05/30. doi: 10.1097/RLI.0000000000000071 . - DOI - PubMed

Publication types