

Rapid quantification assay of hepatitis B virus DNA in human serum and plasma by Fully Automated Genetic Analyzer μTASWako g1
- PMID: 36758029
- PMCID: PMC9910706
- DOI: 10.1371/journal.pone.0278143
Rapid quantification assay of hepatitis B virus DNA in human serum and plasma by Fully Automated Genetic Analyzer μTASWako g1
Abstract
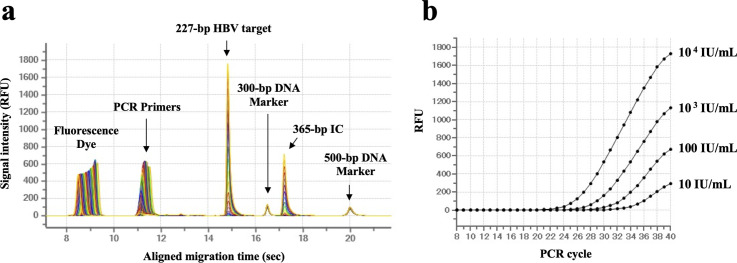
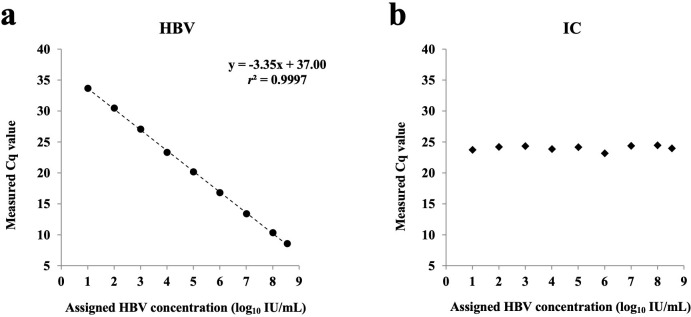
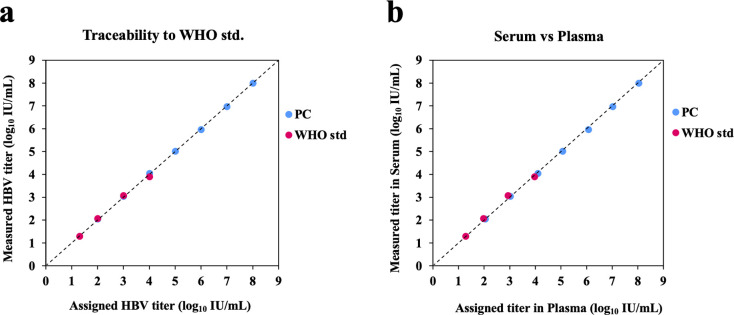
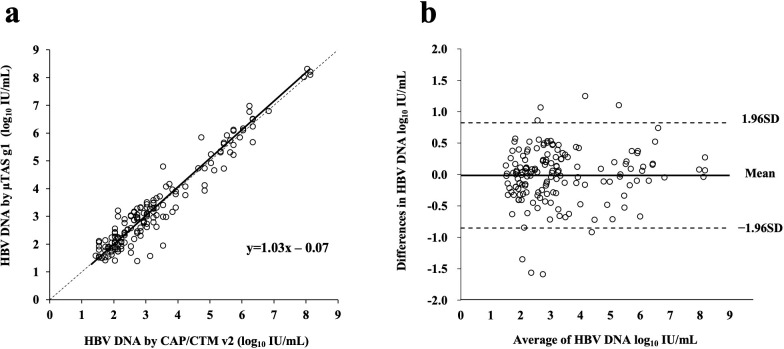
Real-time monitoring of serum hepatitis B virus (HBV) levels is essential for the management of patients with chronic HBV infection in clinical practice, including monitoring the resistance of anti-HBV nucleotide analog or the detection of HBV reactivation. In this context, serum HBV deoxyribonucleic acid (DNA) quantification should be rapidly measured. A rapid HBV DNA quantification assay was established on the Fully Automated Genetic Analyzer, μTASWako g1. The assay performs automated sample preparation and DNA extraction, followed by the amplification and detection of quantitative polymerase chain reaction (PCR) combined with capillary electrophoresis (qPCR-CE) on integrated microfluidic chip. This study aimed to evaluate the analytical and clinical performance of HBV DNA assay on the μTASWako g1 platform in human serum and EDTA-plasma. The HBV DNA assay has a linear quantitative range from 20 to 108 IU/mL of HBV DNA with standard deviation (SD) of ≤0.14 log10 IU/mL. The limits of detection of the assay were 4.18 for the serum and 4.35 for EDTA-plasma. The HBV assay demonstrated the equivalent performance in both human serum and EDTA-plasma matrices. The HBV genotypes A to H were detected with an accuracy of ±0.34 log10 IU/mL. In quantification range, the HBV DNA assay was correlated with Roche cobas AmpliPrep/cobas TaqMan Ver2.0 (CAP/CTM v2) (r = 0.964). The mean difference (μTASWako g1-CAP/CTM v2) of the reported HBV DNA was -0.01 log10 IU/mL. Overall, the sensitivity, accuracy, and precision of the μTASWako g1 HBV assay were comparable to the existing commercial HBV DNA assay, and the assay can be completed within 110 min. This evaluation suggests that the HBV DNA assay on the μTASWako g1 is potentially applied for alternative method of the HBV viral load test, in particular with the advantage of the HBV DNA result availability within 2 h, improving the HBV infection management.
Copyright: © 2023 Watanabe et al. This is an open access article distributed under the terms of the Creative Commons Attribution License, which permits unrestricted use, distribution, and reproduction in any medium, provided the original author and source are credited.
Conflict of interest statement
The authors have declared that no competing interests exist.
Figures
Similar articles
-
Performance of the Assays for Hepatitis B Virus DNA using the μTASWako g1 in Comparison with the COBAS TaqMan Test.Clin Lab. 2023 Dec 1;69(12). doi: 10.7754/Clin.Lab.2023.230312. Clin Lab. 2023. PMID: 38084700
-
Performance of version 2.0 of the Cobas AmpliPrep/Cobas TaqMan real-time PCR assay for hepatitis B virus DNA quantification.J Clin Microbiol. 2010 Oct;48(10):3641-7. doi: 10.1128/JCM.01306-10. Epub 2010 Aug 18. J Clin Microbiol. 2010. PMID: 20720031 Free PMC article.
-
Evaluation of the COBAS AmpliPrep-total nucleic acid isolation-COBAS TaqMan hepatitis B virus (HBV) quantitative test and comparison to the VERSANT HBV DNA 3.0 assay.J Clin Microbiol. 2006 Apr;44(4):1390-9. doi: 10.1128/JCM.44.4.1390-1399.2006. J Clin Microbiol. 2006. PMID: 16597867 Free PMC article.
-
Fully automated rapid quantification of Hepatitis C Virus RNA in human plasma and serum by integrated on-chip RT-qPCR and capillary electrophoresis.Sci Rep. 2020 Apr 30;10(1):7379. doi: 10.1038/s41598-020-64169-z. Sci Rep. 2020. PMID: 32355190 Free PMC article.
-
Comparison of the QIAGEN artus HBV QS-RGQ Assay With the Roche COBAS AmpliPrep/COBAS TaqMan HBV Assay for Quantifying Viral DNA in Sera of Chronic Hepatitis B Patients.Ann Lab Med. 2017 May;37(3):248-253. doi: 10.3343/alm.2017.37.3.248. Ann Lab Med. 2017. PMID: 28224771 Free PMC article.
References
-
- World Health Organization. Global hepatitis report 2017; ISBN 978-92-4-156545–5.
Publication types
MeSH terms
Substances
LinkOut - more resources
Full Text Sources
Medical
Miscellaneous
