. 2023 Mar:89:104455.
doi: 10.1016/j.ebiom.2023.104455. Epub 2023 Feb 7.

Altered global signal topography in Alzheimer's disease

Affiliations

Altered global signal topography in Alzheimer's disease

Pindong Chen et al. EBioMedicine. 2023 Mar.

Abstract

Background: Alzheimer's disease (AD) is a neurodegenerative disease associated with widespread disruptions in intrinsic local specialization and global integration in the functional system of the brain. These changes in integration may further disrupt the global signal (GS) distribution, which might represent the local relative contribution to global activity in functional magnetic resonance imaging (fMRI).

Methods: fMRI scans from a discovery dataset (n = 809) and a validated dataset (n = 542) were used in the analysis. We investigated the alteration of GS topography using the GS correlation (GSCORR) in patients with mild cognitive impairment (MCI) and AD. The association between GS alterations and functional network properties was also investigated based on network theory. The underlying mechanism of GSCORR alterations was elucidated using imaging-transcriptomics.

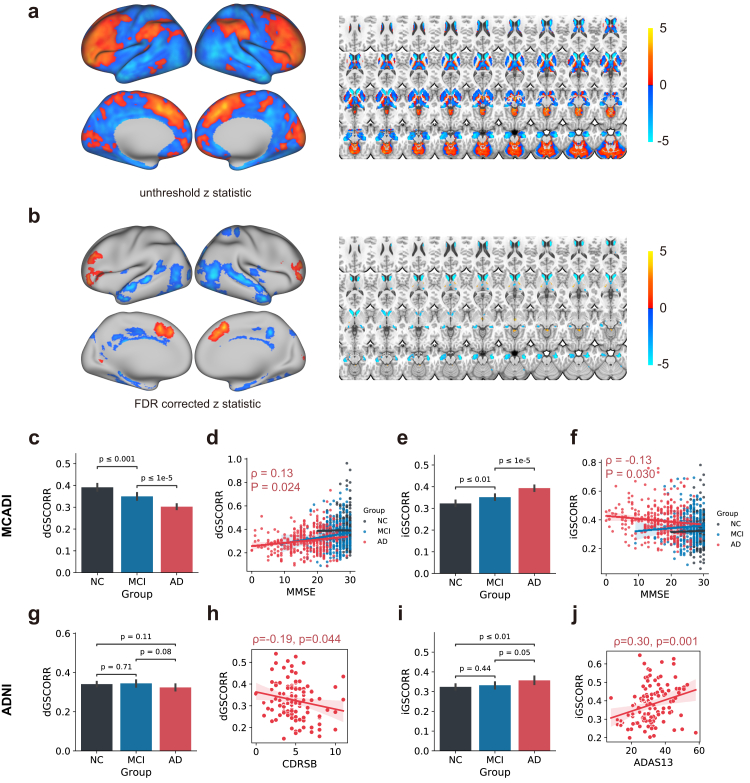
Findings: Significantly increased GS topography in the frontal lobe and decreased GS topography in the hippocampus, cingulate gyrus, caudate, and middle temporal gyrus were observed in patients with AD (Padj < 0.05). Notably, topographical GS changes in these regions correlated with cognitive ability (P < 0.05). The changes in GS topography also correlated with the changes in functional network segregation (ρ = 0.5). Moreover, the genes identified based on GS topographical changes were enriched in pathways associated with AD and neurodegenerative diseases.

Interpretation: Our findings revealed significant changes in GS topography and its molecular basis, confirming the informative role of GS in AD and further contributing to the understanding of the relationship between global and local neuronal activities in patients with AD.

Funding: Beijing Natural Science Funds for Distinguished Young Scholars, China; Fundamental Research Funds for the Central Universities, China; National Natural Science Foundation, China.

Keywords: Alzheimer's disease; Functional network; Global signal; Transcriptomics.


Conflict of interest statement

Declaration of interests PW reports grants from the National Natural Science Foundation of China, during the conduct of the study; DW reports grants from the National Natural Science Foundation of China, during the conduct of the study; YH reports grants from the National Natural Science Foundation of China, during the conduct of the study; XZ reports grants from National Natural Science Foundation of China, during the conduct of the study; YL reports grants from Ministry of Education of the People's Republic of China, grants from Beijing Natural Science Funds, grants from National Natural Science Foundation of China, during the conduct of the study. The remaining authors reported no relevant conflicts.

Figures

Fig. 1
Fig. 1
GS and GS spatial topography. (a) An illustration of the calculation of GSCORR, which is a correlation between the GS and time series in each voxel. (b) The group-level average power of the GS in the NC, MCI, and AD groups in the frequency domain. (c) Comparisons of the average power of the GS across all frequencies among the three groups. (d) GSCORR topography (t-map of the one-sample t test) in the NC, MCI, and AD groups.
Fig. 2
Fig. 2
Altered GSCORR in patients with AD. (a) Unthresholded z-map of the comparison between individuals with AD and NCs. (b) Areas showing significant differences between patients with AD and NCs (FDR-corrected P < 0.05 and cluster size >20). (c) Comparison of the average GSCORR in the decreased area (dGSCORR) between the MCI group and the other two groups in MCADI. (d) Scatterplot of the relationship between MMSE scores and dGSCORR scores of participants within each group in MCADI. The labeled figure indicates the correlation within the AD group. (e) Comparison of the average GSCORR in the increased area (iGSCORR) between the MCI group and the other two groups in MCADI. (f) Scatterplot of the relationship between MMSE scores and iGSCORR scores of participants within each group in MCADI. The labeled figure indicates the correlation within the AD group. (g) Comparison of the dGSCORR among participants in the NC, MCI, and AD groups in ADNI. (h) Scatterplot of the relationship between cognition (CDRSB scores) and dGSCORR scores of participants in the AD groups in ADNI. (i) Comparison of the iGSCORR among participants in the NC, MCI, and AD groups in ADNI. (j) Scatterplot of the relationship between cognition (ADAS13 scores) and iGSCORR scores of participants in the AD groups in ADNI.
Fig. 3
Fig. 3
Relationship with network organization. (a) T-map of regional GSCORR for the comparison between participants in the AD and NC groups. (b) Scatterplot of regional t-statistic values of GSCORR vs. regional t-statistic values of the clustering coefficient (sparse threshold = 0.08). (c) Scatterplot of regional t-statistic values of GSCORR vs. regional t-statistic values of the shortest path length (sparse threshold = 0.08).
Fig. 4
Fig. 4
Mapping the changes in GSCORR topology to gene expression. (a) Regional (left side of Brainnetome Atlas) PLS1 scores of genes and regional GSCORR alterations in the MCADI dataset. (b) Scatterplot of PLS1 scores vs. regional t-statistic (AD vs. NCs) of the regional GSCORR alteration. (c) Genes that positively and negatively weighted PLS1 values for the subsequent KEGG pathway enrichment. (d) KEGG terms for PLS1 genes. The size of the circle represents the number of genes involved in the specific term, and the color represents the corrected P values (P < 0.05, FDR-corrected).
Fig. 5
Fig. 5
Replication analysis of GSCORR using ADNI data. (a–b) Replication of GSCORR for participants in the NC group. The top panel shows the T-map of the NCs in the ADNI dataset, and the bottom scatterplot shows the significant correlation between the two datasets. (c–d) Replication of GSCORR in participants with MCI. The top panel shows the T-map of the MCI in the ADNI, and the bottom scatterplot shows the significant correlation between the two datasets. (e–f) Replication of GSCORR in patients with AD. The top panel shows the T-map of patients with AD in the ADNI dataset, and the bottom scatterplot shows the significant correlation between the two datasets. (g–h) Replication of the differences in GSCORR between participants in the AD and NC groups. The top panel shows the z-map of the comparison between participants in the AD and NC groups in the ADNI dataset, and the bottom scatterplot shows the significant correlation between the two datasets. (The histogram inside the scatterplot shows the null model derived from the spatial autocorrelation surrogates.)

References

    1. Power J.D., Plitt M., Laumann T.O., Martin A. Sources and implications of whole-brain fMRI signals in humans. Neuroimage. 2017;146:609–625. - PMC - PubMed
    1. Aquino K.M., Fulcher B.D., Parkes L., Sabaroedin K., Fornito A. Identifying and removing widespread signal deflections from fMRI data: rethinking the global signal regression problem. Neuroimage. 2020;212 - PubMed
    1. Liu X., de Zwart J.A., Scholvinck M.L., et al. Subcortical evidence for a contribution of arousal to fMRI studies of brain activity. Nat Commun. 2018;9(1):395. - PMC - PubMed
    1. van den Heuvel M.P., Kahn R.S., Goni J., Sporns O. High-cost, high-capacity backbone for global brain communication. Proc Natl Acad Sci U S A. 2012;109(28):11372–11377. - PMC - PubMed
    1. Gotts S.J., Gilmore A.W., Martin A. Brain networks, dimensionality, and global signal averaging in resting-state fMRI: hierarchical network structure results in low-dimensional spatiotemporal dynamics. Neuroimage. 2020;205 - PMC - PubMed