. 2023 Feb 8;31(2):273-287.e5.
doi: 10.1016/j.chom.2023.01.001.

Multi-'omics of gut microbiome-host interactions in short- and long-term myalgic encephalomyelitis/chronic fatigue syndrome patients

Affiliations

Multi-'omics of gut microbiome-host interactions in short- and long-term myalgic encephalomyelitis/chronic fatigue syndrome patients

Ruoyun Xiong et al. Cell Host Microbe. .

Abstract

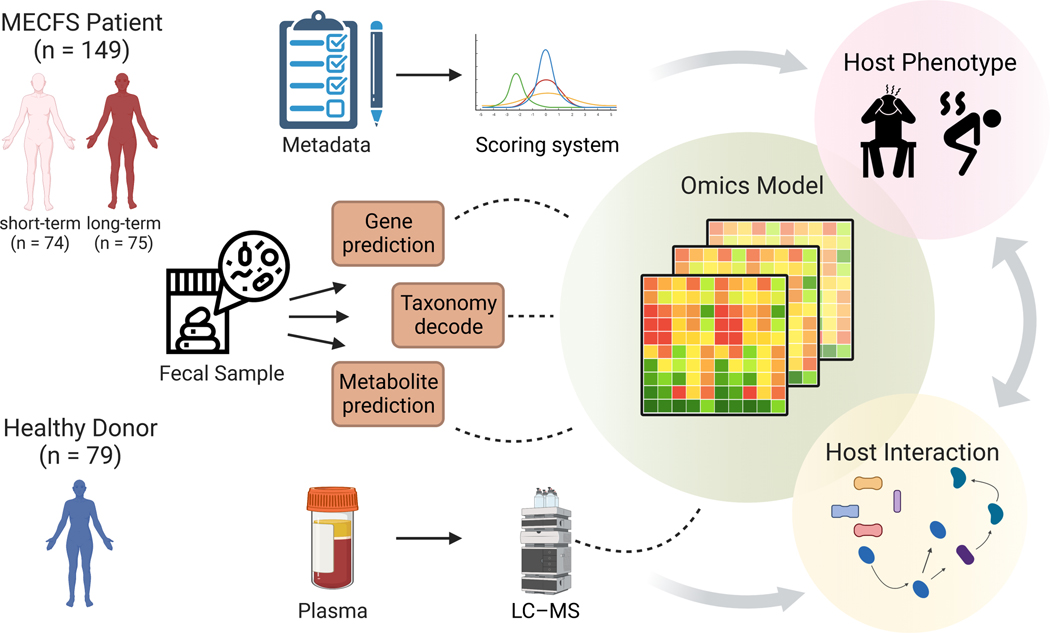
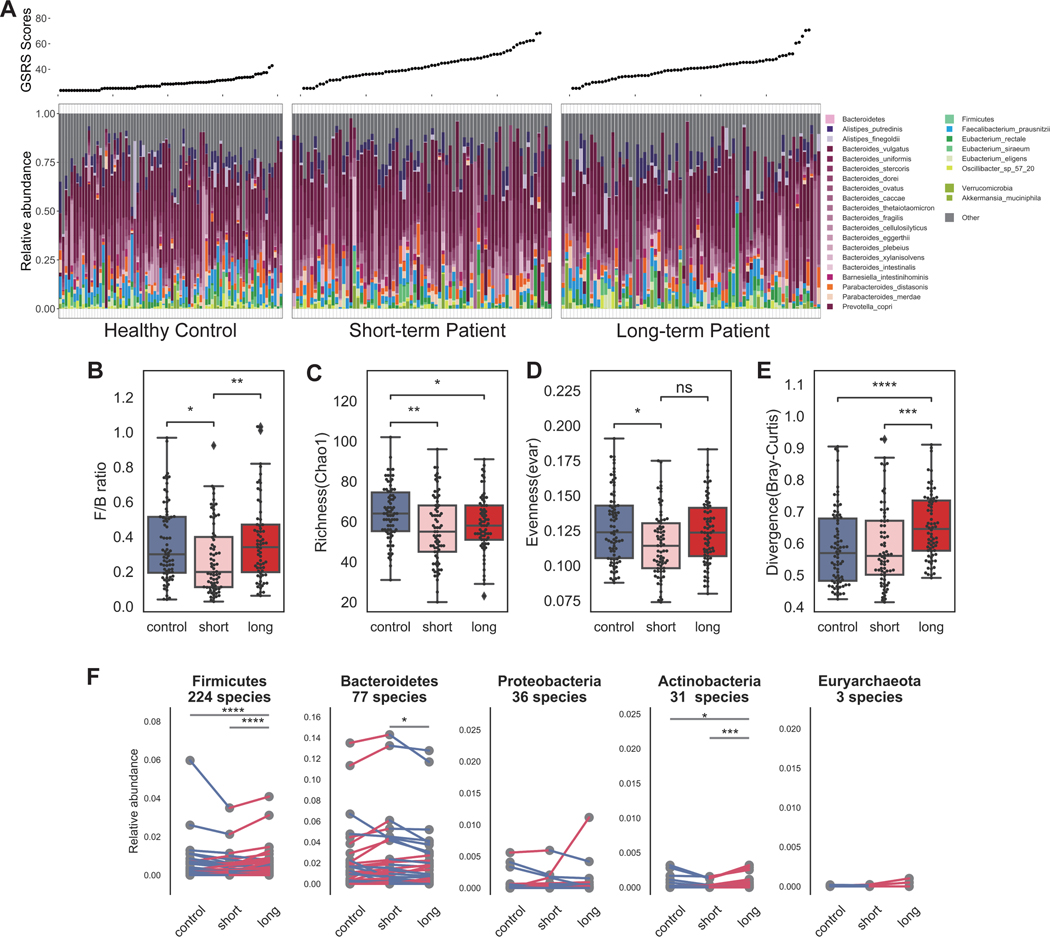
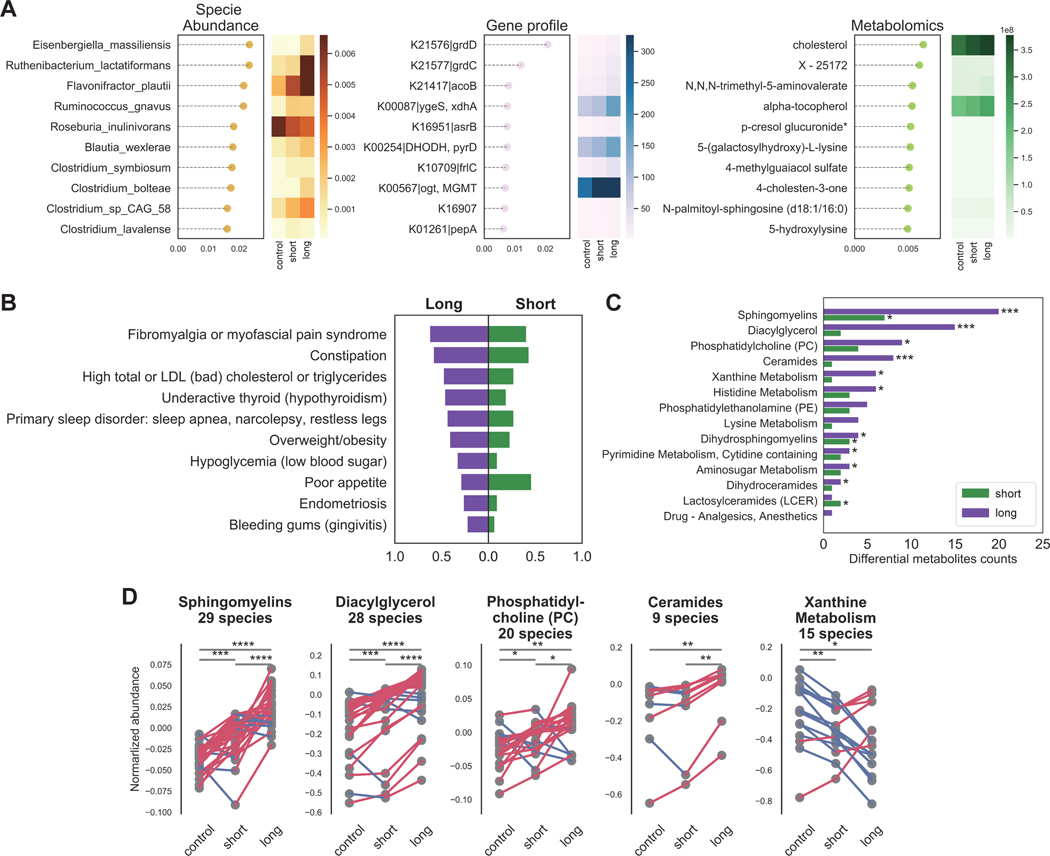
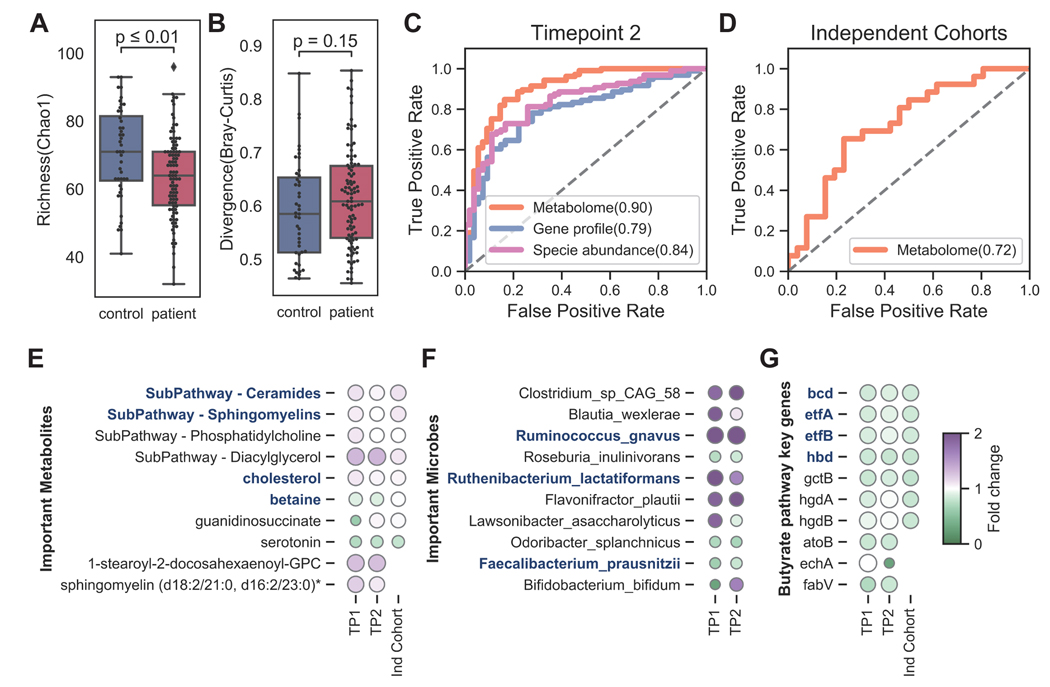
Myalgic encephalomyelitis/chronic fatigue syndrome (ME/CFS) is a complex, debilitating disorder manifesting as severe fatigue and post-exertional malaise. The etiology of ME/CFS remains elusive. Here, we present a deep metagenomic analysis of stool combined with plasma metabolomics and clinical phenotyping of two ME/CFS cohorts with short-term (<4 years, n = 75) or long-term disease (>10 years, n = 79) compared with healthy controls (n = 79). First, we describe microbial and metabolomic dysbiosis in ME/CFS patients. Short-term patients showed significant microbial dysbiosis, while long-term patients had largely resolved microbial dysbiosis but had metabolic and clinical aberrations. Second, we identified phenotypic, microbial, and metabolic biomarkers specific to patient cohorts. These revealed potential functional mechanisms underlying disease onset and duration, including reduced microbial butyrate biosynthesis and a reduction in plasma butyrate, bile acids, and benzoate. In addition to the insights derived, our data represent an important resource to facilitate mechanistic hypotheses of host-microbiome interactions in ME/CFS.

Keywords: ME/CFS; biomarker; gut microbiome; metabolomics; metagenomics; multi-‘omics.


Conflict of interest statement

Declaration of interests S.D.V. is affiliated and has a financial interest with The BioCollective, a company that provided the BioCollector, the collection kit used for at home stool collection discussed in this manuscript.

Figures

Figure 1.
Figure 1.. Summary of study design and analytical pipeline.
We collected detailed clinical metadata, fecal samples, and blood samples for 228 individuals in three cohorts: healthy controls, patients with short-term (<4y) or long-term (>10y) ME/CFS. A comprehensive ‘omics workflow was constructed with the multi-data types (phenotypic, metagenomics, and metabolomics, respectively) and multi-computational models to understand potential host-microbe interactions. LC-MS, Liquid chromatography-mass spectrometry.
Figure 2.
Figure 2.. Microbial dysbiosis in ME/CFS is characterized by decreased diversity and greater heterogeneity.
Comparing controls vs. ME/CFS patients (irrespective of disease stage), community structure differed in ME/CFS with A) decreased richness (Chao 1 index, which measures the number of observed species); B) decreased evenness (lower values of Smith and Wilson’s Evar index); C) decreased rarity (smaller proportion of the least abundant species (<0.2% relative abundance); D) decreased inequality (smaller Gini index of the dominant species (>0.2% relative abundance); E) decreased Firmicutes/Bacteroidetes ratio. p-values were computed by Wilcoxon rank-sum test. F) First and second principal coordinates of dimensionality reduction for Bray-Curtis dissimilarity distances, which measures pairwise similarity of two given samples). Values in brackets indicate the amount of total variability explained by each principal coordinates. p-value and R2 were calculated by permutational multivariate analysis of variance (PERMANOVA) test with patient/control as a variable. G) Increased heterogeneity observed in ME/CFS as measured by divergence, or Bray-Curtis dissimilarity. p-value was computed by Wilcoxon rank-sum test. H) Volcano plot showing differences in predicted growth rate in select species in ME/CFS. Each dot indicates a microbe, sized by the value of its inferred growth rate. The x-axis shows the absolute difference (mean growth rate in patient – mean growth rate in control) and the y-axis is the log10(p-value, Wilcoxon rank-sum test). Species that were predicted to grow faster in patients were colored red and slower in blue. p-value > 0.05 was considered not significant (gray). See also Table S3.
Figure 3.
Figure 3.. Significant microbial dysbiosis in observed in short-term ME/CFS.
A) Taxonomic classification at species-level resolution for all individuals in the three cohorts: healthy controls, short-term patients, and long-term patients. Relative abundances of the most abundant gut species (top 25) are presented with gray representing the aggregate relative abundance of the remaining species. Gastrointestinal Symptom Rating Scale (GSRS) score, indicating the scale of gastrointestinal abnormality, is shown above for each individual. Similarly to Figure 2, we showed differences in the microbial community structures in short-term and long-term patients in: B) composition at phylum-level – decreased Firmicutes/Bacteroidetes ratio in short-term patients; C) reduced richness in short- and long-term (Chao 1 index, which measures the number of observed species); D) decreased evenness in short-term (lower values of Smith and Wilson’s Evar index). p-values were computed by Wilcoxon rank-sum test. E) Increased heterogeneity observed in long-term cohort as measured by divergence, or Bray-Curtis dissimilarity. p-value was computed by Wilcoxon rank-sum test. F) Each species in the five most abundant phyla were compared among three groups to observe the dynamics of gut community with respect to progression of disease. Here, each point represents the average relative abundance for a given species, connected with a line that is colored by increase (red) or decrease (blue). p-values were computed by Wilcoxon signed-rank test. p-value annotation legend: ns: p > 0.05, *: 0.01 < p <= 0.05, **: 0.001 < p <= 0.01, ***: 1e-04 < p <= 0.001, ****: p <= 1e-04. See also Table S3.
Figure 4.
Figure 4.. Out-performing multi-‘omics model identifies microbial, metagenomic, and metabolic biomarkers for ME/CFS compared to controls.
A) Biomarkers from three supervised Gradient Boosting (GDBT) models are shown. Models from top to bottom: species relative abundance, relative abundance of KEGG gene profile, normalized abundance of plasma metabolomics. The top ten most important features in each model are shown together with their general functional class, raw abundance, and variance. From left to right: 1. Functional annotations: species relative abundance model - the metabolic function (capacity of butyrate, tryptophan, and propionate pathway); KEGG gene profile model - the class identification of the enzyme; metabolomics models - the superfamily for the metabolite; 2. Feature importance: features were ranked by their contribution to the model on the y-axis; the x-axis indicates the feature importance value from each model; 3. Average feature abundance in control and patient groups (Figure S4); 4. Variation in mean relative abundance in control and patient groups with coefficient of variation. B) Performance of the classifiers using area under the curve (AUC) was evaluated using 10 randomized and 10-fold cross-validations for each model: species relative abundance (pink), KEGG gene profile (blue) or metabolites (orange) alone, or taken altogether (‘omics, green), which used the combination of the top 30 features from three models. See also Figure S4 and Table S3–5.
Figure 5.
Figure 5.. Phenotypical and metabolic abnormality are most pronounced in long-term patients.
A) Multi gradient boosting models identified most important species, genes and metabolites differentiating controls, short-, or long-term ME/CFS. In each model, the top ten features are ranked by their contribution to the model on the y-axis, and the x-axis indicates the feature importance value. The heatmap shows the average feature abundance or relative abundance in each group. For full classification model performance (AUCs), see also Figure S5. B) Naïve Bayesian model based on medical history records classified the stage of disease and identified nine significant clinical phenotypes in the long-term cohort and one significant phenotype in the short-term cohort. For each feature, the probability of experiencing the symptom in the long-term patients was presented to the left on the x-axis and the probability in the short-term patients was presented to the right. C) Overrepresentation analysis (ORA) on the plasma metabolome identified the most differential metabolites and pathways in the long-term group. For each pathway, two comparisons were conducted, control vs. short-term and control vs. long-term. P-values were computed by linear global t-test and the counts of differential metabolites presented on the x-axis. D) The trend of gradually changing metabolic irregularities along with the progression of disease are indicated by the difference between control, short-term and long-term cohorts. Here, each point represents the average normalized abundance for a given metabolite in the top five most abundant superfamilies, connected with a line that is colored by if increasing (red) or decreasing (blue). p-values were computed by Wilcoxon signed-rank test. p-value annotation legend: *: 0.01 < p <= 0.05, **: 0.001 < p <= 0.01, ***: 1e-04 < p <= 0.001, ****: p <= 1e-4. See also Table S5–6.
Figure 6.
Figure 6.. Limited microbial butyrate biosynthesis capacity associates with reduced plasma isobutyrate and multiple blood metabolites.
In the blood and gut environment, decreased butyrate abundance in the short-term patient was indicated by: A) significantly reduced plasma isobutyrate normalized abundance; B) decreased predicted gut isobutyrate in patients, especially in short-term patients. Boxes show median relative abundance and interquartile ranges (IQR); whiskers specify ±1.5*IQR from the box’s quartile. P-values were computed by Wilcoxon rank-sum test. C) The reduced abundance of most key enzymes in the butanoate mechanism (KEGG pathway map00650) indicated a more limited microbial butyrate biosynthesis capacity in ME/CFS. Differentiating enzymes were colored and annotated on the map (decreased in blue and increased in red). D) Correlation of plasma metabolite normalized abundance and relative abundance of microbial butyrate biosynthesis features, with fold changes. Heatmap shows significant correlations (Spearman, p < 0.05) with the top bar indicating the metabolite superfamily. The top half shows the key enzymes in the KEGG butanoate pathway. On the left, different fold changes between the two patient cohorts (short-term vs. control and long-term vs. control, respectively) indicated a significant decrease in butyrate biosynthetic capacity in the early stages of ME/CFS. P-values were calculated in each group with Wilcoxon rank-sum test. Finally, the bottom half shows the correlation between the relative abundance of predicted butyrate producers and plasma metabolites. Microbes were ordered by relative abundance. For each microbe, the size of the dot indicates the mean abundance in each group and the color indicated fold change over the control group. P-value was computed by Kruskal–Wallis H test. p-value annotation legend: *: 0.01 < p <= 0.05, **: 0.001 < p <= 0.01, ***: 1e-04 < p <= 0.001. See also Table S6.
Figure 7.
Figure 7.. Microbial and metabolomic features of ME/CFS identified in additional cohorts.
A) Decreased richness and B) increased heterogeneity (Bray-Curtis dissimilarity) in the gut microbiota were consistent in our second timepoint (Wilcoxon rank-sum test). B) The performance of our classifiers was assessed using ROC curves in C) our second timepoint and D) an independent cohort (Germain et al., 2020). The models were colored by species relative abundance (pink), KEGG gene profile (blue), and metabolites (orange). E) The fold change of important metabolic subpathways and biomarkers are shown from three cohorts: timepoint 1, 2, and an independent cohort. The shared features with Germain’s study were highlighted in blue. F) The fold change of microbial biomarkers from the classifier in timepoints 1 and 2. The shared biomarkers with Guo’s study are highlighted in blue. G) The fold change of key genes in the butyrate pathway across three cohorts. The shared essential genes from the Acetyl-CoA branch are highlighted in blue. See also Figure S7.

Comment in

References

    1. Afari N, and Buchwald D. (2003). Chronic fatigue syndrome: a review. Am. J. Psychiatry 160, 221–236. 10.1176/appi.ajp.160.2.221. - DOI - PubMed
    1. Nacul L, O’Boyle S, Palla L, Nacul FE, Mudie K, Kingdon CC, Cliff JM, Clark TG, Dockrell HM, and Lacerda EM (2020). How Myalgic Encephalomyelitis/Chronic Fatigue Syndrome (ME/CFS) Progresses: The Natural History of ME/CFS. Front. Neurol. 11, 826. 10.3389/fneur.2020.00826. - DOI - PMC - PubMed
    1. Holgate ST, Komaroff AL, Mangan D, and Wessely S. (2011). Chronic fatigue syndrome: understanding a complex illness. Nat. Rev. Neurosci 12, 539–544. 10.1038/nrn3087. - DOI - PubMed
    1. Bested AC, and Marshall LM (2015). Review of Myalgic Encephalomyelitis/Chronic Fatigue Syndrome: an evidence-based approach to diagnosis and management by clinicians. Rev. Environ. Health 30, 223–249. 10.1515/reveh-2015-0026. - DOI - PubMed
    1. Pheby DFH, Araja D, Berkis U, Brenna E, Cullinan J, de Korwin J-D, Gitto L, Hughes DA, Hunter RM, Trepel D, et al. (2021). A Literature Review of GP Knowledge and Understanding of ME/CFS: A Report from the Socioeconomic Working Group of the European Network on ME/CFS (EUROMENE). Medicina (Mex.) 57, 7. 10.3390/medicina57010007. - DOI - PMC - PubMed