Comment
. 2023 Feb 8;31(2):288-304.e8.
doi: 10.1016/j.chom.2023.01.004.

Deficient butyrate-producing capacity in the gut microbiome is associated with bacterial network disturbances and fatigue symptoms in ME/CFS

Affiliations
Comment

Deficient butyrate-producing capacity in the gut microbiome is associated with bacterial network disturbances and fatigue symptoms in ME/CFS

Cheng Guo et al. Cell Host Microbe. .

Abstract

Myalgic encephalomyelitis/chronic fatigue syndrome (ME/CFS) is characterized by unexplained debilitating fatigue, cognitive dysfunction, gastrointestinal disturbances, and orthostatic intolerance. Here, we report a multi-omic analysis of a geographically diverse cohort of 106 cases and 91 healthy controls that revealed differences in gut microbiome diversity, abundances, functional pathways, and interactions. Faecalibacterium prausnitzii and Eubacterium rectale, which are both recognized as abundant, health-promoting butyrate producers in the human gut, were reduced in ME/CFS. Functional metagenomics, qPCR, and metabolomics of fecal short-chain fatty acids confirmed a deficient microbial capacity for butyrate synthesis. Microbiome-based machine learning classifier models were robust to geographic variation and generalizable in a validation cohort. The abundance of Faecalibacterium prausnitzii was inversely associated with fatigue severity. These findings demonstrate the functional nature of gut dysbiosis and the underlying microbial network disturbance in ME/CFS, providing possible targets for disease classification and therapeutic trials.

Keywords: Faecalibacterium; biomarkers; butyrate; co-abundance network; irritable bowel syndrome; metabolomics; microbiome; myalgic encephalomyelitis/chronic fatigue syndrome; short-chain fatty acids; shotgun metagenomics.


Conflict of interest statement

Declaration of interests The authors declare no competing interests.

Figures

Figure 1.
Figure 1.. Gut microbiome diversity
(A) Genus-level distribution of bacteria in the fecal microbiota of ME/CFS cases (n = 106) and healthy control subjects (n = 91). (B and C) Distribution of microbiota alpha diversity (Pielou’s e index) comparing ME/CFS and healthy controls (B) and groups stratified by sr-IBS status (C). Box-and-whiskers plots represent the interquartile ranges (25th through 75th percentiles, boxes), medians (50th percentiles, bars within the boxes), the 5th and 95th percentiles (whiskers below and above the boxes), and outliers beyond the whiskers (closed circles). See also Figures S1A–S1D. (D and E) PCoA plots of microbiota beta diversity (Bray-Curtis dissimilarity metric) comparing ME/CFS and healthy controls (D) and groups stratified by sr-IBS status (E). Statistical significance: Mann-Whitney U test (B); Kruskal-Wallis test (K.W.), and Mann-Whitney U test with Bonferroni correction (padj value, C); PERMANOVA and PERMANOVA-FL (D); PERMANOVA with Bonferroni correction (padj value, E). *p or padj < 0.05; **p or padj < 0.01.
Figure 2.
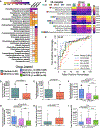
Figure 2.. Differential abundance, machine-learning classifiers, and quantitation of fecal bacteria
(A and B) Differential abundance. (A) Heatmap showing differentially abundant species identified from models 1–3 (MaAsLin2 analyses). Strength and direction of association are indicated by the color scale of the regression coefficient. FDR adjusted p value (q value) < 0.05 was considered significant; white indicates non-significant associations. See also Table S2. (B) Heatmap showing the average relative abundance (RA) of the twelve ME/CFS-specific species in unstratified and stratified groups, divided into high, intermediate, and low RA. Species selected in each ML classifier model are indicated by colored circles. (C) ML classifiers. Generalized linear model (GLM) receiver operating characteristic (ROC) curves for classification of ME/CFS based on four bacterial species (F. prausnitzii, R. lactatiformans, Lachnoclostridium sp. YL32, and E. ramosum). AUC values are shown for the primary dataset in this study (model), by geographic sites (CA, NY, NV, and UT), and for the external validation dataset (CFI). See also Figure S2. (D–I) Bacterial quantitation (qPCR). Distribution of Roseburia-Eubacterium (D and F) and F. prausnitzii (E and G) and total bacterial (H and I) 16S rRNA genes per gram of feces (also normalized for ACN in (H) and (I) between ME/CFS and healthy controls (D, E, and H) and among stratified groups (F, G, and I). Box-and-whiskers plots represent the interquartile ranges (25th through 75th percentiles, boxes), medians (50th percentiles, bars within the boxes), the 5th and 95th percentiles (whiskers below and above the boxes), and outliers beyond the whiskers (closed circles). Statistical significance: Mann-Whitney U test (D, E, and H); Kruskal-Wallis test (K.W.) and Mann-Whitney U test with Bonferroni correction (padj value, F, G, and I). *p or padj < 0.05; **p or padj < 0.01; ***p or padj < 0.001; ****p or padj < 0.0001; T, trend (p or padj < 0.1).
Figure 3.
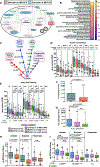
Figure 3.. Functional metagenomic and metabolomic analyses
(A and B) GoMixer metabolic processes (A) and modules (B) that are deficient (red in A, downward facing white arrow in B) or enriched (blue in A, upward facing white arrow in B) in ME/CFS compared with healthy controls. (B) Color scale indicates the mean difference in modules (Δ) between ME/CFS and controls. An FDR adjusted p value (q value) < 0.1 was considered significant. See also Table S3. (C) Schematic showing the 4 bacterial gene pathways of butyrate production. Note: the bcd-etfAB complex is shared among all 4 pathways (gray circles). (D and E) Distribution of gene counts (CPM) for genes in the acetyl-CoA pathway between ME/CFS and healthy controls (D) and among stratified groups (E). See also Figure S3 and Tables S1C–S1F. (F and G) Distribution of fecal but gene copies per gram of feces (qPCR) between ME/CFS and healthy controls (F) and among stratified groups (G). See also Table S1B. (H and I) Distribution of fecal SCFAs (ng SCFA/ng feces) measured by GC-MS between ME/CFS and healthy controls (H) and among stratified groups (I). See also Table S4. Box-and-whiskers plots (D-I) represent the interquartile ranges (25th through 75th percentiles, boxes), medians (50th percentiles, bars within the boxes), the 5th and 95th percentiles (whiskers below and above the boxes), and outliers beyond the whiskers (closed circles). Statistical significance: Mann-Whitney U test (D, F, and H); Kruskal-Wallis test (K.W.) followed by Mann-Whitney U test with Bonferroni correction (padj value, E, G, and I), where K.W. was significant (p < 0.05). n.s., not significant; *p or padj < 0.05; **p or padj < 0.01; ***p or padj < 0.001; ****p or padj < 0.0001; T, trend (p or padj < 0.1).
Figure 4.
Figure 4.. Association of species abundances with SCFAs and fatigue symptoms and co-abundance network analysis strategy
(A–D) Heatmaps showing associations between the relative abundance of species and molar proportions of individual SCFAs (A and B) and between species and individual dimension and total fatigue scores (MFI: C and D) among healthy controls (A and C: n = 91) and among ME/CFS cases (B and D: n = 106) (MaAsLin2 analyses). Strength and direction of the associations are indicated by the color scale of the regression coefficient. FDR was controlled with a p value cutoff < 0.01; white indicates non-significant associations. See also Tables S5 and S6. (E) Schematic showing the staged strategy for bacterial, species-level co-abundance network analysis employed for this study. See also STAR Methods.
Figure 5.
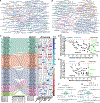
Figure 5.. Species co-abundance network comparisons between groups
(A and B) Species co-abundance networks derived from the AggCN (A) and AggMN (B). Nodes are sized by betweenness centrality and colored according to their community module membership. Blue edges indicate positive and red edges negative correlations; thicker edges highlight unique edges within each group. (C) Alluvial plot showing the shuffling of species between community modules identified in the AggCN (controls, left) and the AggMN (ME/CFS, right). Jaccard index between group modules is shown below the plot. Asterisks indicate connector species identified in (D) and (E). The associated heatmap shows top ranked species based on difference in centrality metrics (delta centrality). Only top ranked changes are shown (≥95th percentile = higher centrality in ME/CFS [blue scale] or ≤5th percentile = higher centrality in controls [red scale]). ASPL, average shortest path length; MCC, maximal clique centrality; MNC, maximum neighborhood component; NESH, neighbor shift score. (D and E) Zi-Pi plot showing within-module and between-module connectivity for each of the 100 species (each point represents a species) in the AggCN (D) and the AggMN (E). Cutoff zones defining species as network hubs, module hubs, connectors, and peripherals are indicated (dotted red lines and zone labels). Blue diamonds, module hubs; green triangles, connector species; black circles, peripherals. (F and G) Subgraphs derived from the first-order neighbors of F. prausnitzii and their edges in the AggCN (F) and AggMN (G). Nodes are sized by their degree and their colors reflect their module membership. Blue edges indicate positive and red negative correlations; thicker edges highlight unique interactions within each group.

Comment in

Comment on

References

    1. Fukuda K, Straus SE, Hickie I, Sharpe MC, Dobbins JG, and Komaroff A. (). The chronic fatigue syndrome: a comprehensive approach to its definition and study. International chronic fatigue syndrome study group. Ann. Intern. Med. 121, 953–959. 10.7326/0003-4819-121-12-199412150-00009. - DOI - PubMed
    1. Carruthers BM, van de Sande MI, De Meirleir KL, Klimas NG, Broderick G, Mitchell T, Staines D, Powles AC, Speight N, Vallings R, et al. (). Myalgic encephalomyelitis: international Consensus Criteria. J. Intern. Med. 270, 327–338. 10.1111/j.1365-2796.2011.02428.x. - DOI - PMC - PubMed
    1. Institute of Medicine (). Beyond Myalgic Encephalomyelitis/Chronic Fatigue Syndrome: Redefining an Illness. In The National Academies Collection: Reports (National Institutes of Health; ). 10.17226/19012. - DOI
    1. Słomko J, Newton JL, Kujawski S, Tafil-Klawe M, Klawe J, Staines D, Marshall-Gradisnik S, and Zalewski P. (). Prevalence and characteristics of chronic fatigue syndrome/myalgic encephalomyelitis (CFS/ME) in Poland: a cross-sectional study. BMJ Open 9, e023955. 10.1136/bmjopen-2018-023955. - DOI - PMC - PubMed
    1. Johnston S, Brenu EW, Staines D, and Marshall-Gradisnik S. (). The prevalence of chronic fatigue syndrome/myalgic encephalomyelitis: a meta-analysis. Clin. Epidemiol. 5, 105–110. 10.2147/CLEP.S39876. - DOI - PMC - PubMed