. 2023 Mar;299(3):102993.
doi: 10.1016/j.jbc.2023.102993. Epub 2023 Feb 8.

RhoA rescues cardiac senescence by regulating Parkin-mediated mitophagy

Affiliations

RhoA rescues cardiac senescence by regulating Parkin-mediated mitophagy

Joanne Ern Chi Soh et al. J Biol Chem. 2023 Mar.

Abstract

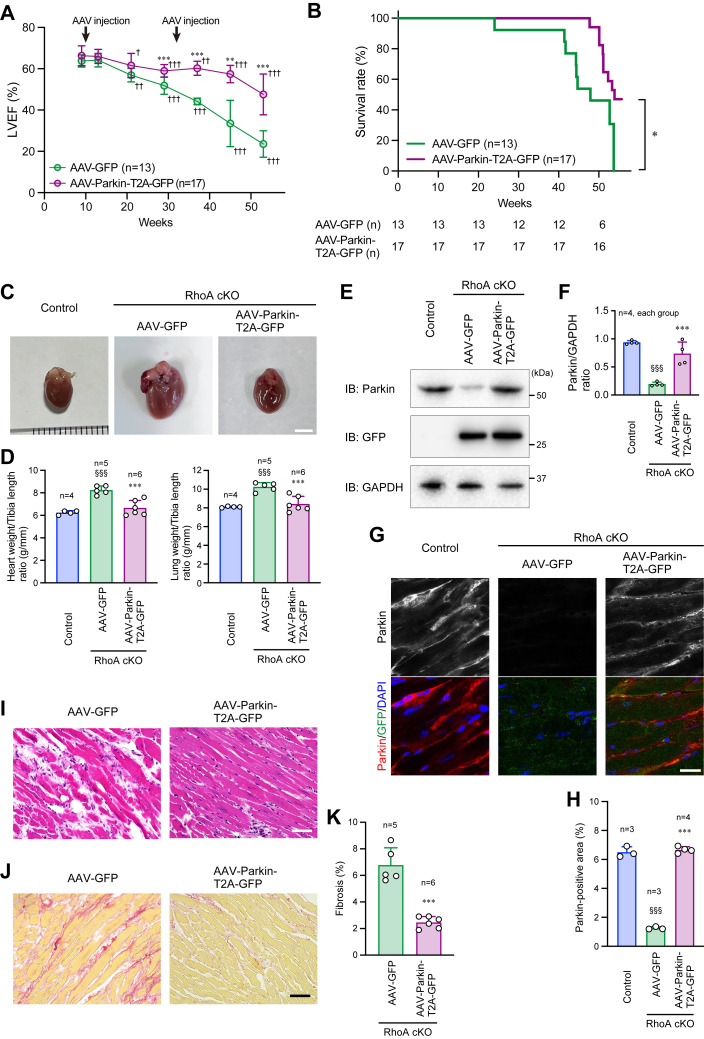
Heart failure is one of the leading causes of death worldwide. RhoA, a small GTPase, governs actin dynamics in various tissue and cell types, including cardiomyocytes; however, its involvement in cardiac function has not been fully elucidated. Here, we generated cardiomyocyte-specific RhoA conditional knockout (cKO) mice, which demonstrated a significantly shorter lifespan with left ventricular dilation and severely impaired ejection fraction. We found that the cardiac tissues of the cKO mice exhibited structural disorganization with fibrosis and also exhibited enhanced senescence compared with control mice. In addition, we show that cardiomyocyte mitochondria were structurally abnormal in the aged cKO hearts. Clearance of damaged mitochondria by mitophagy was remarkably inhibited in both cKO cardiomyocytes and RhoA-knockdown HL-1 cultured cardiomyocytes. In RhoA-depleted cardiomyocytes, we reveal that the expression of Parkin, an E3 ubiquitin ligase that plays a crucial role in mitophagy, was reduced, and expression of N-Myc, a negative regulator of Parkin, was increased. We further reveal that the RhoA-Rho kinase axis induced N-Myc phosphorylation, which led to N-Myc degradation and Parkin upregulation. Re-expression of Parkin in RhoA-depleted cardiomyocytes restored mitophagy, reduced mitochondrial damage, attenuated cardiomyocyte senescence, and rescued cardiac function both in vitro and in vivo. Finally, we found that patients with idiopathic dilated cardiomyopathy without causal mutations for dilated cardiomyopathy showed reduced cardiac expression of RhoA and Parkin. These results suggest that RhoA promotes Parkin-mediated mitophagy as an indispensable mechanism contributing to cardioprotection in the aging heart.

Keywords: Parkin; Ras homolog gene family; cardiomyocyte; cardiomyopathy; member A (RhoA); mitophagy; senescence; signal transduction.


Conflict of interest statement

Conflict of interest The authors declare that they have no conflicts of interest with the contents of this article.

Figures

Figure 1
Figure 1
Shorter lifespan and impaired cardiac function in RhoA cKO mice.A, body weight of 9-, 18-, and 45-week-old mice. B, immunostaining for RhoA in the heart at 9 weeks after birth. F-actin and nuclei were counterstained with phalloidin and DAPI, respectively. Scale bar: 20 μm. C, Kaplan–Meier survival curve of mice. The number of mice (n) in each group at every 10 weeks is indicated below the graph. D, echocardiographic images of control and RhoA cKO mice at the indicated time points. EH, echocardiographic analyses of left ventricular ejection fraction (LVEF; E), LV end-diastolic diameter (LVDd; F), LV mass (G), and LV posterior wall thickness at end-diastole (LVPWd; H) in mice at 9, 13, 21, 29, 37, 45, and 53 weeks after birth. I and J, heart rate (HR; I) and systolic blood pressure (BP; J) measured by plethysmographic tail-cuff method in 9-, 21-, and 45-week-old mice. The data in each graph are shown as the mean ± SD. In (A) and (EJ) two-way ANOVA and one-way ANOVA were applied to compare the data between groups and weeks, respectively, and in (C), the data were analyzed by Kaplan–Meier method. ∗p < 0.05, ∗∗p < 0.01, and ∗∗∗p < 0.001 versus control; p < 0.05, ††p < 0.01, and †††p < 0.001 versus week 9. cKO, conditional knockout.
Figure 2
Figure 2
Accelerated cardiac aging in RhoA cKO mice.A, C, and E, immunostaining for the senescence markers p16 (A), p21 (C), and senescence-associated β-galactosidase (SAβ-Gal; E) in the heart. Nuclei were counterstained with DAPI. Scale bars: 20 μm. B, D, and F, summary graphs of the percentage of positive area for each marker analyzed in (A, C, and E), respectively. G, H-E staining of the heart at the indicated time points. Scale bar: 50 μm. H, Picro-sirius red staining of the heart for the detection of fibrosis at the indicated time points. Scale bar: 50 μm. I, summary graph of the percentage of cardiac fibrosis. The data in each graph are shown as the mean ± SD. One-way ANOVA was applied to compare the data between groups in B, D, F, and I. ∗∗∗p < 0.001 versus control; †††p < 0.001 versus week 18. cKO, conditional knockout; H-E, hematoxylin and eosin.
Figure 3
Figure 3
Accumulation of dysfunctional mitochondria and mitophagy dysregulation in the RhoA cKO hearts.A, TEM images of the heart at the indicated time points. Arrowheads indicate swollen and severely damaged mitochondria. Scale bar: 1 μm. B and D, immunostaining (B) and Western blotting (D) for ATP5A in the mouse heart samples at the indicated time points. Nuclei were counterstained with DAPI (B), and GAPDH was blotted as the loading control (D). Scale bar in (B): 20 μm. C and E, summary graphs of the percentage of ATP5A-positive area (C) and the ATP5A/GAPDH band ratio (E) examined in (B and D), respectively. F, qPCR analysis of Rhoa gene expression in HL-1 cells after transfection of scramble RNA (Scramble), siRhoA #1, or siRhoA #2. Gapdh gene expression was used as the control. G, Western blotting of RhoA in HL-1 cells. H, summary graph of the RhoA/GAPDH band ratio in (G). I and K, immunostaining (I) and Western blotting (K) for ATP5A in HL-1 cells. The plasma membrane was stained with wheat germ agglutinin (WGA) in (I). Scale bar in (I): 20 μm. J and L, summary graphs of the percentage of ATP5A-positive area (J) and the ATP5A/GAPDH band ratio (L) examined in (I and K), respectively. M, fluorescence images of mitophagy in viable HL-1 cells after CCCP induction. Nuclei were counterstained with Hoechst. Scale bar: 20 μm. N, summary graph of the percentage of mitophagy area. The data in each graph are shown as the mean ± SD. Comparisons of the data between groups were performed using one-way ANOVA (C and E) or t test (F, H, J, L, and N). ∗∗∗p < 0.001 versus control or scramble; †††p < 0.001 versus week 18. cKO, conditional knockout; TEM, transmission electron microscopy.
Figure 4
Figure 4
Reduced Parkin expression in the RhoA cKO hearts.A, Western blotting for RhoA and Parkin in the heart at the indicated time points. GAPDH was blotted as the loading control. B, summary graph of the Parkin/GAPDH band ratio. C, immunostaining for Parkin in the hearts of 45-week-old mice. The plasma membrane and nuclei were counterstained with WGA and DAPI, respectively. Scale bar: 20 μm. D, summary graph of the percentage of Parkin-positive area. E, Western blotting for ubiquitin (Ub) in the mitochondrial fraction of the heart samples at the indicated time points. Tom20 was blotted as the loading control. F, summary graph of Ub bands density. A.U.: arbitrary unit. G and I, Western blotting (G) and immunostaining for Parkin (I) in HL-1 cardiomyocytes transfected with siRhoA and scramble RNA. H and J, summary graphs of the Parkin/GAPDH band ratio (H), and the percentage of Parkin-positive area (J) examined in (G and I), respectively. K, Western blotting for Ub in the mitochondrial fraction of HL-1 cells. Tom20 was blotted as the loading control. L, summary graph of Ub bands density. A.U.: arbitrary unit. The data in each graph are shown as the mean ± SD. Comparisons of the data between groups were performed using one-way ANOVA (B and F) or t test (D, H, K, and L). ∗p < 0.05, ∗∗p < 0.01, and ∗∗∗p < 0.001 versus control or scramble. cKO, conditional knockout; WGA, wheat germ agglutinin.
Figure 5
Figure 5
RhoA-mediated Parkin expression in cardiomyocytes.A and C, Western blotting for N-Myc and phosphorylated N-Myc (P-N-Myc) in the hearts of 45-week-old mice (A) and HL-1 cardiomyocytes (C). GAPDH was blotted as the loading control. B and D, summary graphs of the N-Myc/GAPDH and P-N-Myc/GAPDH band ratios examined in (A and C), respectively. E, immunostaining for N-Myc in HL-1 cells. The plasma membrane and nuclei were counterstained with WGA and DAPI, respectively. Scale bar: 20 μm. F, summary graph of the percentage of N-Myc-positive area. G, ROCK kinase assay in HL-1 cells with or without a ROCK inhibitor Y-27632 for 1 h. H, Western blotting for the indicated molecules in HL-1 cells treated with or without Y-27632 for 1 h. I, summary graphs of the ratio for the band density of each molecule to that of GAPDH, which was examined in (H). J, Western blotting for the indicated molecules in HL-1 cells transfected with siRhoA, siRhoA+siN-Myc, or scramble RNA as the control. K, summary graphs of the Parkin/GAPDH and ATP5A/GAPDH band ratios. L, immunostaining for Parkin in HL-1 cells. Scale bar: 20 μm. M, summary graph of the percentage of Parkin-positive area in (L). N, Western blotting for Ub in the mitochondrial fraction of HL-1 cells. Tom20 was blotted as the loading control. O, summary graph of Ub bands density. A.U.: arbitrary unit. P, fluorescence images of mitophagy in viable cultured HL-1 cells after CCCP induction. Nuclei were counterstained with Hoechst. Scale bar: 20 μm. Q, summary graph of the percentage of mitophagy area. The data in each graph are shown as the mean ± SD. In (C, E, J, L, N, and P), HL-1 cells were used for experiments at 48 h after siRNA transfection. Comparisons of the data between groups were performed using t test (B, D, F, and H) or one-way ANOVA (J, L, O, and Q). ∗p < 0.05, ∗∗p < 0.01, and ∗∗∗p < 0.001 versus control or scramble; ††p < 0.01 and †††p < 0.001 versus siRhoA. CCCP, carbonyl cyanide m-chlorophenyl hydrazone; ROCK, Rho kinase; Ub, ubiquitin; WGA, wheat germ agglutinin.
Figure 6
Figure 6
Restoration of mitochondrial function in RhoA-knockdown HL-1 cardiomyocytes by AAV-Parkin infection.A, Western blotting for Parkin in HL-1 cardiomyocytes infected with AAV-Parkin-T2A-GFP or AAV-GFP as the control. GAPDH was blotted as the loading control. B, summary graph of the Parkin/GAPDH band ratio. C, Western blotting for Ub in the mitochondrial fraction of HL-1 cells. Tom20 was blotted as the loading control. D, summary graph of Ub bands density. A.U.: arbitrary unit. E, fluorescence images of mitophagy in viable cultured HL-1 cells after CCCP induction. Nuclei were counterstained with Hoechst. Scale bar: 20 μm. F, summary graph of the percentage of mitophagy area. The data in each graph are shown as the mean ± SD. One-way ANOVA was used to compare the data between groups. ∗∗p < 0.01 and ∗∗∗p < 0.001 versus Scramble; †††p < 0.001 versus AAV-GFP. AAV, adeno-associated virus; CCCP, carbonyl cyanide m-chlorophenyl hydrazone; GFP, green fluorescent protein.
Figure 7
Figure 7
Improved cardiac function and increased lifespan in RhoA cKO mice after intravenous administration of AAV-Parkin.A, LVEF analyzed by echocardiography in 9-, 13-, 21-, 29-, 37-, 45-, and 53-week-old mice. AAV-Parkin-T2A-GFP or AAV-GFP as the control was injected into RhoA cKO mice through the tail vein twice (10 and 32 weeks after birth). B, Kaplan–Meier survival curve of RhoA cKO mice injected twice with AAV-Parkin-T2A-GFP or AAV-GFP. The number of mice (n) in each group at every 10 weeks is indicated below the graph. C, external appearance of the hearts extracted from 53-week-old mice. Scale bar: 5 mm. D, heart and lung weight in 53-week-old mice, which was normalized to tibia length. E, Western blotting for Parkin and GFP in the hearts of 53-week-old mice. GAPDH was blotted as the loading control. F, summary graph of the Parkin/GAPDH band ratio. G, immunostaining for Parkin in the hearts of 53-week-old mice. Nuclei were counterstained with DAPI. Scale bar: 20 μm. H, summary graph of the percentage of Parkin-positive area. I and J, H-E staining and Picro-sirius red staining of the hearts from 53-week-old mice. Scale bars: 50 μm. K, summary graph of the percentage of cardiac fibrosis examined in (J). The data in each graph are shown as the mean ± SD. In (A), two-way ANOVA and one-way ANOVA were applied to compare the data between groups and weeks, respectively, and in (C), the data were analyzed using the Kaplan–Meier method. One-way ANOVA (D, F, and H) or t test (K) was used to compare the data between groups. ∗p < 0.05, ∗∗p < 0.01, and ∗∗∗p < 0.001 versus AAV-GFP; p < 0.05, ††p < 0.01, and †††p < 0.001 versus Week 9; §§§p < 0.001 versus control. AAV, adeno-associated virus; cKO, Conditional knockout; GFP, green fluorescent protein; H-E, hematoxylin and eosin; LVEF, Left ventricular ejection fraction.
Figure 8
Figure 8
Clearance of damaged mitochondria and improvement of earlier senescence in RhoA cKO mice after AAV-Parkin injection.A, TEM images of the hearts from 53-week-old mice after intravenous injection of AAV-Parkin-T2A-GFP or AAV-GFP twice (10 and 32 weeks after birth). Scale bar: 1 μm. B, Western blotting for ATP5A in the hearts from 53-week-old mice. GAPDH was blotted as the control. C, summary graph of the ATP5A/GAPDH band ratio examined in (B). D, co-immunostaining for ATP5A and Tom20 in the hearts from 53-week-old mice. Nuclei were counterstained with DAPI. Scale bar: 20 μm. E, summary graph of the percentage of ATP5A-positive area examined in (D). F, Western blotting for Ub in the mitochondrial fraction of the hearts from 53-week-old mice. Tom20 was blotted as the loading control. G, summary graph of Ub bands density. A.U.: arbitrary unit. H, Immunostaining for a senescence marker SAβ-Gal in the hearts from 53-week-old mice. Scale bar: 20 μm. I, summary graph of the percentage of SAβ-Gal-positive area. The data in each graph are shown as the mean ± SD. One-way ANOVA (C) or t test (E, G, and I) was used to compare the data between groups. ∗∗∗p < 0.001 versus AAV-GFP; §§§p < 0.001 versus control. AAV, adeno-associated virus; cKO, conditional knockout; GFP, green fluorescent protein; Ub, ubiquitin.
Figure 9
Figure 9
Reduced RhoA and Parkin expressions and impaired mitochondrial function in patients with idiopathic DCM.A, qPCR analysis of gene expressions of RHOA and PARK2, which encodes Parkin, in the human heart. Control heart samples were obtained from subjects who died accidentally, and DCM heart samples were obtained at the time of heart transplantation. GAPDH gene expression was used as the control. B, Western blotting for RhoA, Parkin, and PINK1 in the human heart. GAPDH was blotted as the loading control. C, summary graphs of the band ratios of RhoA, Parkin, and PINK1 to GAPDH examined in (B). D and E, H-E staining and Picro-sirius red staining of the human heart. Scale bar: 100 μm. F, summary graph of the percentage of cardiac fibrosis examined in (E). G, TEM images of the human heart. White and yellow arrowheads indicate normal and disrupted mitochondria, respectively. Scale bar: 1 μm. H, Western blotting for ATP5A in the human heart. I, summary graphs of the ATP5A/GAPDH ratio examined in (H). The data in each graph are shown as the mean ± SD. Comparisons of the data between the groups were conducted using t test. ∗∗∗p < 0.001 versus control. DCM, dilated cardiomyopathy; H-E, hematoxylin and eosin; PINK1, PTEN-induced putative kinase 1.

References

    1. McMurray J.J., Pfeffer M.A. Heart failure. Lancet. 2005;365:1877–1889. - PubMed
    1. Ziaeian B., Fonarow G.C. Epidemiology and aetiology of heart failure. Nat. Rev. Cardiol. 2016;13:368–378. - PMC - PubMed
    1. Lam C.S.P., Solomon S.D. Classification of heart failure according to ejection fraction: JACC review topic of the week. J. Am. Coll. Cardiol. 2021;77:3217–3225. - PubMed
    1. Sinha A., Gupta D.K., Yancy C.W., Shah S.J., Rasmussen-Torvik L.J., McNally E.M., et al. Risk-based approach for the prediction and prevention of heart failure. Circ. Heart Fail. 2021;14 - PMC - PubMed
    1. Kemp C.D., Conte J.V. The pathophysiology of heart failure. Cardiovasc. Pathol. 2012;21:365–371. - PubMed

Publication types

Substances