. 2023 Aug;72(8):1510-1522.
doi: 10.1136/gutjnl-2022-327855. Epub 2023 Feb 9.

IL-17A-producing CD8+ T cells promote PDAC via induction of inflammatory cancer-associated fibroblasts

Affiliations

IL-17A-producing CD8+ T cells promote PDAC via induction of inflammatory cancer-associated fibroblasts

Felix Simon Ruben Picard et al. Gut. 2023 Aug.

Abstract

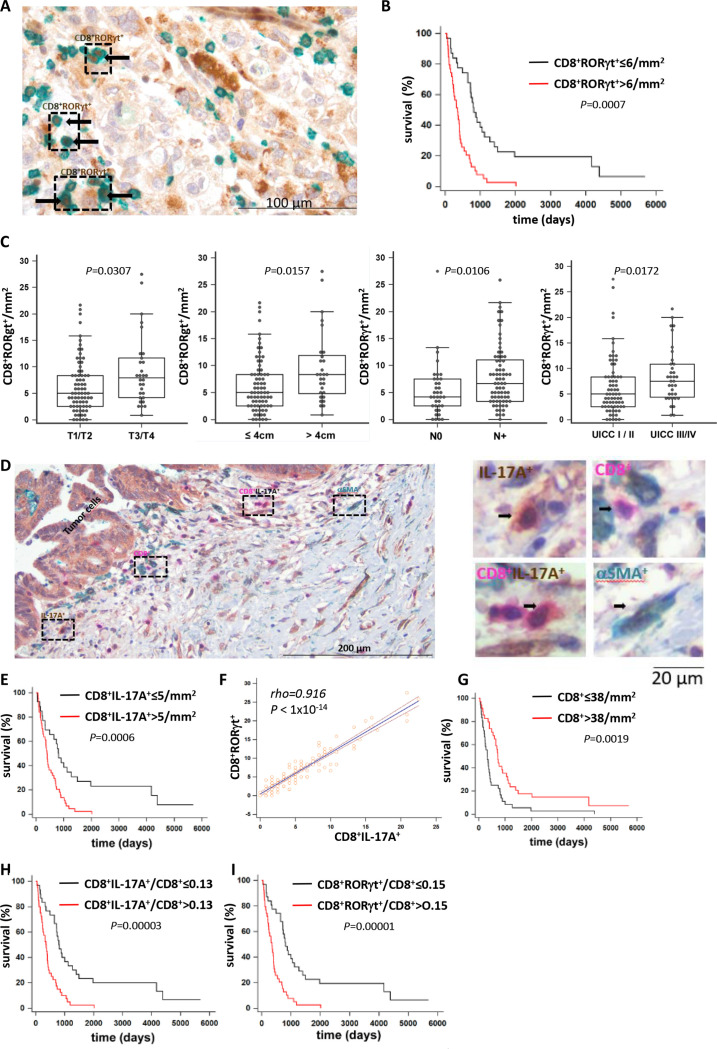
Objective: Pancreatic ductal adenocarcinoma (PDAC) is characterised by an abundant desmoplastic stroma composed of cancer-associated fibroblasts (CAF) and interspersed immune cells. A non-canonical CD8+ T-cell subpopulation producing IL-17A (Tc17) promotes autoimmunity and has been identified in tumours. Here, we evaluated the Tc17 role in PDAC.

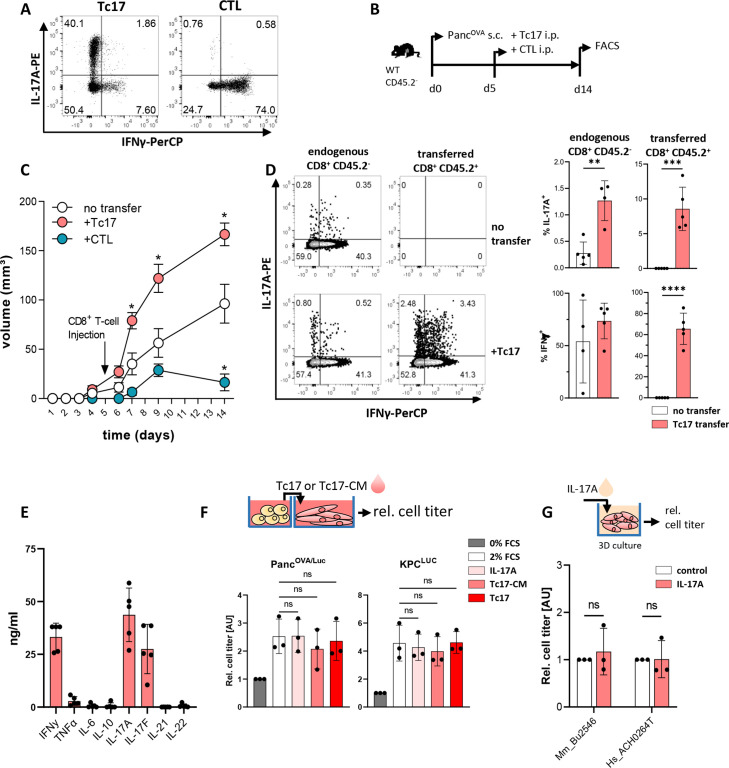
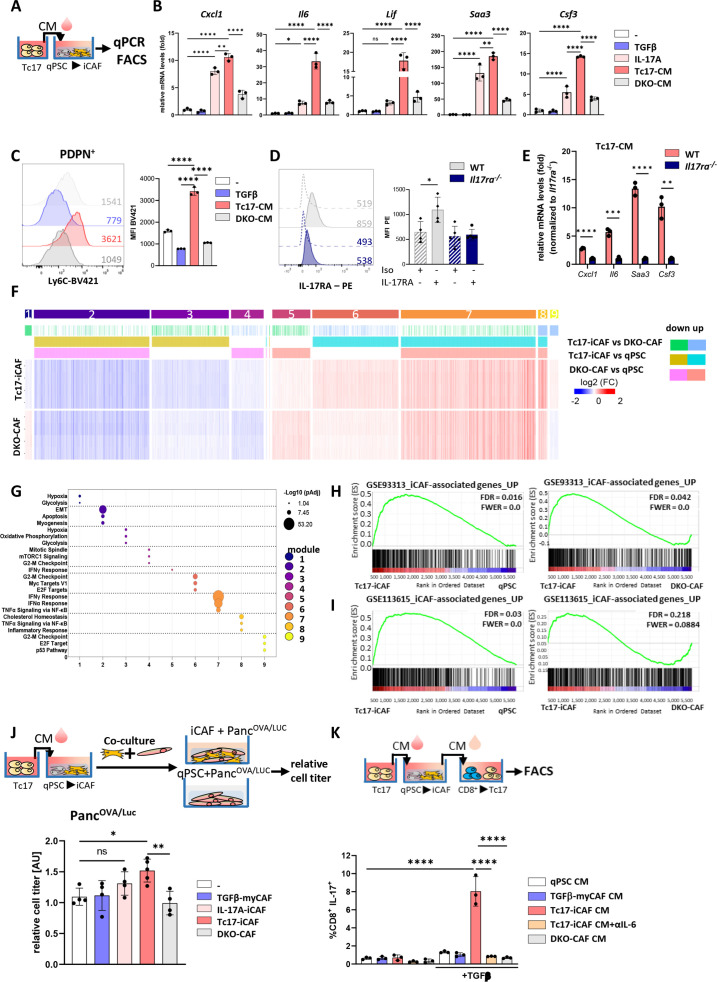
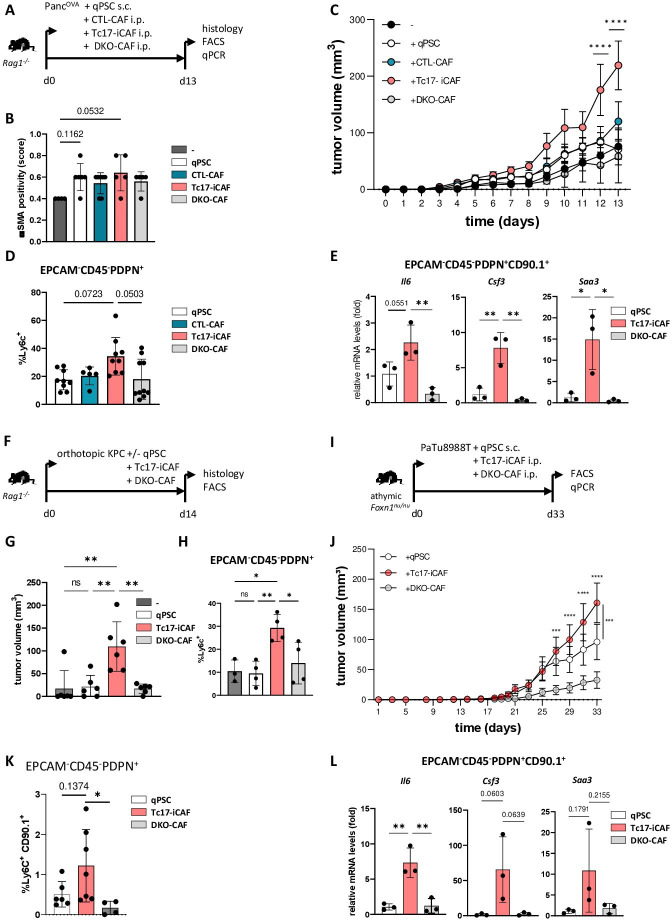
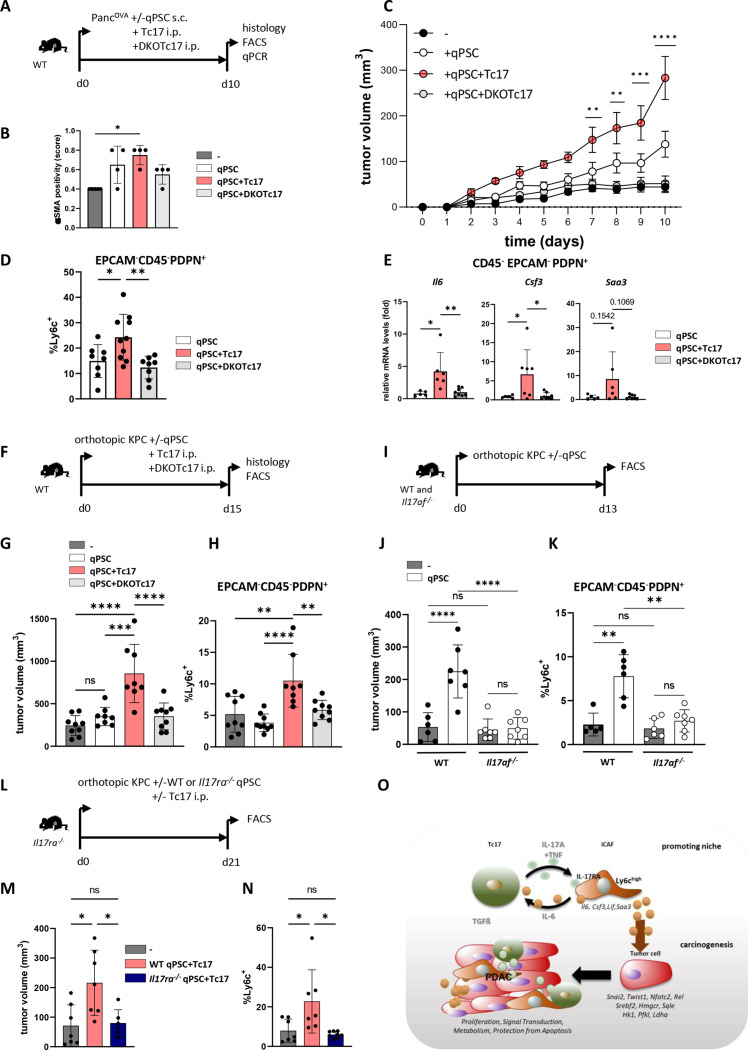
Design: Infiltration of Tc17 cells in PDAC tissue was correlated with patient overall survival and tumour stage. Wild-type (WT) or Il17ra-/- quiescent pancreatic stellate cells (qPSC) were exposed to conditional media obtained from Tc17 cells (Tc17-CM); moreover, co-culture of Tc17-CM-induced inflammatory (i)CAF (Tc17-iCAF) with tumour cells was performed. IL-17A/F-, IL-17RA-, RAG1-deficient and Foxn1nu/nu mice were used to study the Tc17 role in subcutaneous and orthotopic PDAC mouse models.

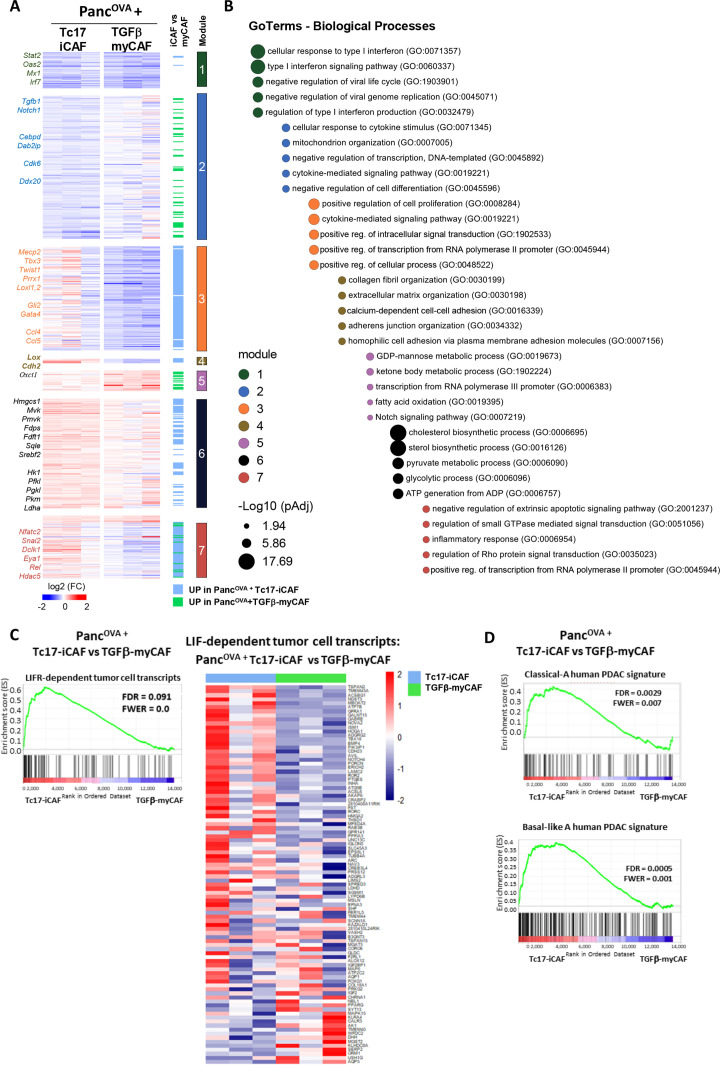
Results: Increased abundance of Tc17 cells highly correlated with reduced survival and advanced tumour stage in PDAC. Tc17-CM induced iCAF differentiation as assessed by the expression of iCAF-associated genes via synergism of IL-17A and TNF. Accordingly, IL-17RA controlled the responsiveness of qPSC to Tc17-CM. Pancreatic tumour cells co-cultured with Tc17-iCAF displayed enhanced proliferation and increased expression of genes implicated in proliferation, metabolism and protection from apoptosis. Tc17-iCAF accelerated growth of mouse and human tumours in Rag1-/- and Foxn1nu/nu mice, respectively. Finally, Il17ra-expressed by fibroblasts was required for Tc17-driven tumour growth in vivo.

Conclusions: We identified Tc17 as a novel protumourigenic CD8+ T-cell subtype in PDAC, which accelerated tumour growth via IL-17RA-dependent stroma modification. We described a crosstalk between three cell types, Tc17, fibroblasts and tumour cells, promoting PDAC progression, which resulted in poor prognosis for patients.

Keywords: cancer immunobiology; cytokines; immune response; inflammatory mechanisms; pancreatic cancer.


Conflict of interest statement

Competing interests: None declared.

Figures

Figure 1
Figure 1
Increased Tc17 infiltration associates with shorter survival in PDAC. (A) Double immunostaining of PDAC tissue sections using antibodies against CD8α (green) and RORγt (brown), scale bar 100 µm. (B) Kaplan-Meier curve of overall survival (survival %) of patients with surgically resected PDAC showing≤6/mm2 vs >6/mm2 CD8+ RORγt+ cell infiltation (n=71, p values determined by log-rank test). (C) CD8+ RORγt+ cell frequency per mm2 in T1/2 vs T3/T4 tumours (n=105), in tumours ≤4 cm vs >4 cm (n=105), No vs n+tumours (n=109) and UICC stage I/II vs III/IV (n=106). Box-plots depict the lower and upper adjacent values (whiskers) and the upper and lower quartiles (top and bottom edges of the box). Horizontal lines inside boxes indicate median, p values determined by Mann-Whitney U test. Each dot represents one individual. (D) Triple immunostaining of PDAC tissue for CD8α, IL-17A, and alpha−smooth muscle actin (αSMA). Left, PDAC tissue areas are denoted with single-positive IL-17A+ cells (brown), single-positive CD8+ cells (magenta), double-positive CD8+IL-17A+ (magenta-brown) and single-positive αSMA+ cells (green), scale bar 200 µm. Right, image magnification of cells highlighted in the left panel, scale bar 20 µm. (E) Kaplan-Meier curve of overall survival (survival %) of patients with surgically resected PDAC showing ≤5/mm2 vs >5/mm2 CD8+ IL-17A+ cell infiltration (n=71, p values determined by log-rank test). (F) Linear regression analysis of CD8+RORγt+ vs CD8+IL-17A+ cell frequencies in PDAC tissue. Linear regression line, Spearman’s correlation coefficient rho, and respective p value is shown in the plot (n=111). (G–I) Kaplan-Meier curves of overall survival (survival %) of patients with surgically resected PDAC showing ≤38/mm2 vs >38/mm2 single-positive CD8+ cell infiltration (G), intratumoural CD8+IL-17A+/CD8 ratios + ≤0.13 vs >0.13 (H) and intratumoural CD8+RORγt +/CD8+ ratios ≤0.15 vs >0.15 (I) (n=71, p values determined by log-rank test). PDAC, pancreatic ductal adenocarcinoma.
Figure 2
Figure 2
Tc17 cells enhance pancreatic tumour growth in vivo. (A) Purified CD8+ T cells isolated from CD45.2+OT-I mice were stimulated with anti-CD3/CD28 antibodies in the presence of TGFβ+IL-6 (Tc17) or IL-12+IL-2 (CTL) for 4 days. Differentiation was confirmed by intracellular staining for IL-17A and IFNγ and subsequent FACS analysis. Representative FACS plots are shown. (B) Scheme of experimental design. Congenic CD45.2- mice were subcutaneously (s.c.) injected with 106 PancOVA cells. After 5 days, tumour-bearing mice were injected intraperitoneally (i.p.) with 106 Tc17 or CTLs obtained from CD45.2+OT-I mice or with PBS (no transfer). The analysis was performed at the indicated end of the experiment. (C) Tumour-growth curve of subcutaneous tumours is shown (tumour volume in mm3 (mean±SE, n=5–7 mice). *p<0.05 indicates the tumour volume comparisons between mice without transfer and mice with Tc17 or CTL transfer. (D) FACS analysis of IL-17A and IFNγ production after restimulation of tumour single-cell suspensions with PMA/Ionomycin in the presence of brefeldin A for 5 hours. Data from endogenous CD45.2- or transferred CD45.2+ CD8+ T cells. Left, representative FACS plots are shown. Right, quantification of the frequency of IL-17A+ (top) or IFNγ+ (bottom) among endogenous (CD45.2-) or transferred (CD45.2+) CD8+ T cells with or without Tc17 transfer (n=4–5 tumours). (E) Quantification of cytokines (ng/mL) produced by in vitro differentiated Tc17 cells after restimulation with plate-bound anti-CD3 antibodies for 24 hours (n=5). (F) Top, scheme of the experimental design showing the relative titre of tumour cells cultured for 36 hours with Tc17 cells generated from WT CD8+ T cells or with Tc17-conditional media (Tc17-CM). Tc17-CM were obtained after restimulation of differentiated Tc17 cells with plate-bound anti-CD3 for 24 hours. Bottom, the tumour-cell titre was obtained from PancOVA or KPC cells tagged with firefly luciferase (PancOVA/Luc, KPCLuc) and assessed as fold of luciferase activity, normalised to the control (0% FCS), which was arbitrarily set to 1. Tumour cells were cultured alone in 0% FCS (control) or 2% FCS (2% FCS), or in 2% FCS containing IL-17A (IL-17A), Tc17-CM (Tc17-CM) or Tc17 cells (Tc17) (n=3). (G) Top, scheme of the experimental design showing treatment of matrigel-embedded 3D organoid cultures with 50 ng/mL IL-17A. Bottom, cell titre assay of mouse (Mm_Bu2548) or human (Hs_ACH0264T) PDAC organoids treated with recombinant murine (rm) or recombinant human (rh)IL-17A (n=3). The relative cell titre without IL-17A treatment (control) was arbitrarily set to 1. (D–G) Bars show mean±SD; biological replicates are plotted. In (C) *p<0.05 determined by mixed-effects model (REML), in (D) **p<0.01, ***p<0.001, ****p<0.0001 by t-test, in (F) statistics evaluated by two-way ANOVA followed by Tukey’s HSD multiple comparison test, ns (non-significant) in (G) statistics evaluated by Mann-Whitney U test. ANOVA, analysis of variance; HSD, honestly significant difference; PBS, phosphate-buffered saline; PDAC, pancreatic ductal adenocarcinoma.
Figure 3
Figure 3
Reciprocal crosstalk between Tc17 cells and iCAF. (A) Scheme of the experimental design showing Tc17-CM production. Tc17-CM was used to stimulate matrigel-embedded quiescent murine quiescent pancreatic stellate cells (qPSC) and to evaluate mRNA expression of iCAF-specific transcripts (B) or Ly6c+ phenotype (C). (B) qPCR for indicated iCAF transcripts in PSC after a 48- hour incubation with control medium (-), +TGFβ(2 ng/mL) (TGFβ), +IL-17A(50 ng/mL) (IL-17A), 30% Tc17-CM (Tc17-CM) or 30% CM obtained from IL-17A/FDKO Tc17 cells (DKO-CM), respectively. All incubations were done in control medium supplemented with the respective compounds or media. Fold mRNA expression is shown, normalised to the control (-), which was arbitrarily set to 1; (n=3). (C) FACS analysis of Ly6c levels by PSC after 48 hours incubation as described in B; mean fluorescence intensity (MFI) is shown. Left, representative histograms. Right, quantification of Ly6c levels, (n=3). (D) FACS analysis of WT qPSC and Il17ra-/- qPSC for IL-17RA levels, MFI is shown. Left, representative histograms. Right, quantification of IL-17RA levels (n=3). (E) qPCR analysis of the indicated iCAF transcripts in WT or Il17ra-/- PSC after incubation with Tc17-CM for 48 hours. Fold mRNA expression is shown, normalised to Il17ra-/- PSC, which was arbitrarily set to 1; (n=3). (F) Heatmap of differentially expressed genes (Z score normalised, FDR≤0.001) by PSC after incubation with control medium (qPSC) or with control medium containing 30% Tc17-CM (Tc17-iCAF) or 30% DKOTc17-CM (DKO-CAF) for 48 hours classified into modules based on the mutual upregulation or downregulation (n=4, biological replicates). (G) Pathway enrichment analysis for Molecular Signatures Database (MSigDB) Hallmark 2020. Bubble graph displays the three most significant enriched pathways by –log10 value (p adj) for nine modules established in (F). (H, I) Gene set enrichment analysis (GSEA) to identify differential expression of iCAF-associated genes based on raw data RNA-Seq GSE933134 (H) or GSE1136156 (I) in Tc17-iCAF vs qPSC (left) or DKO-CAF (right). (J) Top, scheme of the experimental design showing Tc17-iCAF induction, thereafter co-culture with PancOVA/Luccells for 36 hours. Bottom, tumour-cell titre was obtained from PancOVA cells tagged with firefly luciferase (PancOVA/Luc) after culture with control medium (-) or co-culture with TGFβ-myCAF (TGFβ-myCAF), IL-17A-iCAF (IL-17A-iCAF), Tc17-iCAF (Tc17-iCAF) or DKO-CAF (DKO-CAF). Tumour cell titre was assessed as fold of luciferase activity normalised to the control (-), which was arbitrarily set to 1, (n=4–5). (K) Top, scheme of the experimental design showing the production of CM from qPSC, TGFβ-myCAF, Tc17-iCAF, DKO-CAF, which were added to purified CD8+ T cells. Bottom, quantification of FACS analysis showing frequencies of IL-17A-producing CD8+ T cells after anti-CD3/CD28 activation in the presence or absence of TGFβ and with/without 50% CM obtained from qPSC (qPSC CM), TGFβ-myCAF (TGFβ-myCAF CM), Tc17-iCAF (Tc17-iCAF CM), Tc17-iCAF+αIL-6 (Tc17-iCAF CM +αIL-6) or DKO-iCAF (DKO-CAF CM) after 72 hours (n=3). (B–E, J, K) Bars show mean±SD; biological replicates are plotted. In (B, C, J, K) *p<0.05, **p<0.01, ***p<0.001, ****p<0.0001 evaluated by one-way ANOVA followed by Tukey’s HSD multiple comparison test, ns (non-significant) (D, E) *p<0.05, **p<0.01, ***p<0.001, ****p<0.0001 evaluated by two-tailed, unpaired t-test. ANOVA, analysis of variance; HSD, honestly significant difference; iCAF, inflammatory cancer-associated fibroblast.
Figure 4
Figure 4
Tc17-iCAF promote pancreatic tumour growth in vivo. (A) Scheme of the experimental design. 5×10⁵ PancOVA tumour cells ±5×10⁵ in vitro differentiated CD90.1+qPSC, CD90.1+CTL-CAF, CD90.1+Tc17-iCAF or CD90.1+DKO-CAF were subcutaneously co-injected into immunodeficient Rag1-/- mice. Histology and CAF analyses were performed at the indicated end of the experiment. (B) Quantification of αSMA staining in tumour tissue of mice injected with PancOVA cells alone (-) or co-injected with qPSC (qPSC), with CTL-CAF (CTL-CAF), with Tc17-iCAF (Tc17-iCAF) or with DKO-CAF (DKO-CAF), based on previously published scoring, (n=4–7). (C) Tumour-growth curve of subcutaneous tumours is shown (tumour volume in MM3; mean±SEM, n=5–7, a representative of two independent experiments each with 5–7 mice). ****p<0.0001 indicates the tumour volume comparisons between mice with Tc17-iCAF vs qPSC injection. (D) FACS analysis of Ly6chigh cell frequency in gated EPCAM-CD45-PDPN+ fibroblasts in subcutaneous tumours (n=5–10). (E) qPCR analysis of the indicated genes expressed by transferred EPCAM-CD45-PDPN+CD90.1+ fibroblasts sorted from subcutaneous tumours (mean±SD, n=3). Fold of mRNA expression is shown, normalised to the qPSC group, which was arbitrarily set to 1, (n=3). (F) Scheme of the experimental design. 2×10⁴ KPC tumour cells±2 × 10⁴ CD90.1+qPSC, CD90.1+Tc17-iCAF or CD90.1+DKO-CAF were orthotopically co-injected into Rag1-/- mice. The tumour volume and CAF phenotype were analysed at the indicated end of the experiment. (G) Tumour volume of orthotopic tumours of mice injected with KPC cells alone (-) or co-injected with qPSC (qPSC), with Tc17-iCAF (Tc17-iCAF) or with DKO-CAF (DKO-CAF) is shown (mean±SD, n=6 mice). (H) FACS analysis of Ly6chigh cell frequency in gated EPCAM-CD45-PDPN+ cells in orthotopic tumours of mice treated as indicated (mean±SD, n=3–4). (I) Scheme of the experimental design. 5×10⁵ PaTu8988T human PDAC cells together with 5×10⁵ in vitro differentiated CD90.1+qPSC or CD90.1+Tc17-iCAF or CD90.1+DKO-CAF or were co-injected subcutaneously into immunodeficient athymic Foxn1nu/nu nude mice. CAF analysis was performed at the indicated end of the experiment. (J) Tumour-growth curve of subcutaneous tumours (MM3) of mice co-injected with PaTU8988T cells and with qPSC (qPSC) or with Tc17-iCAF (Tc17-iCAF) or with DKO-CAF (DKO-CAF) (mean±SEM, n=10 mice). ***p<0.001 and ****p<0.0001 above the PaTu8988T-Tc17-iCAF curve indicate the comparisons between mice with Tc17-iCAF vs DKO-iCAF co-injection. ***p<0.0005 on the right side of the graph indicates the comparison between mice with Tc17-iCAF vs qPSC co-injection. (K) FACS analysis of Ly6chigh cell frequency in gated EPCAM-CD45-PDPN+ fibroblasts in subcutaneous tumours (n=4–6). (L) qPCR analysis of the indicated gene expression by sorted from subcutaneous tumours transferred EPCAM-CD45-PDPN+CD90.1+ fibroblasts (mean±SD, n=3). Fold of mRNA expression is shown, normalised to the qPSC group, which was arbitrarily set to 1 (n=3). (B, D, E, G, H, J, K, L) biological replicates are plotted. In (B, D, K) statistics by Kruskal-Wallis-Test, *p<0.05, ns (non-significant) (C, J) ***p<0.001, ****p<0.0001 determined by two-way ANOVA with Bonferroni post hoc test, (E, G, H, L) *p<0.05, **p<0.01 and p values by one-way ANOVA followed by Tukey’s HSD multiple comparison test. αSMA, a-smooth muscle actin; ANOVA, analysis of variance; HSD, honestly significant difference; iCAF, inflammatory cancer-associated fibroblasts; qPSC, quiescent pancreatic stellate cell.
Figure 5
Figure 5
Tc17-iCAF affect pancreatic tumour cell transcriptional profile. (A) Heatmap of differentially expressed genes (Z score normalised, FDR ≤0.1) by PancOVA cells after 36 hours of co-culture with Tc17-iCAF or TGFβ-myCAF classified into modules based on the mutual upregulation or downregulation (n=3, biological replicates). (B) Pathway enrichment analysis for gene ontologies (GO): Biological processes. Bubble graph displays the five most significantly enriched pathways by –log10 value (p adj) for seven modules established in (A). (C) GSEA for differential expression of LIF-dependent pancreatic cancer cell transcripts obtained from LifrWT KPf/fCL vs Lifrf/fKPf/fCL mice in PancOVA tumour cells after co-culture with Tc17-iCAF vs TGFβ-myCAF. (C, right), heatmap of color-coded z-scores from the rlog transformed expression values based on the GSEA. (D) GSEA for differential expression of classical-A or Basal-like A human PDAC transcripts in PancOVA tumour cells after co-culture with Tc17-iCAF vs TGFβ-myCAFs. CAF, cancer-associated fibroblasts; GSEA, pancreatic ductal adenocarcinoma; PDAC, pancreatic ductal adenocarcinoma.
Figure 6
Figure 6
Tc17 cells promote tumour growth in vivo via IL-17RA+iCAF. (A) Scheme of the experimental design. 5 ×10⁵ PancOVA tumour cells±5 × 10⁵ CD90.1+qPSC were subcutaneously co-injected into WT mice, which on the same day received i.p. injections of PBS or of 106 WT (Tc17) or IL-17A/FDKO Tc17 (DKOTc17) cells differentiated from WT or IL-17A/FDKO CD8+ T cells in the presence of TGFβ+IL-6. Histology and CAF analysis were performed at the indicated end of the experiment. (B) Quantification of αSMA staining in tumour tissue of mice injected with PancOVA cells alone (-) or co-injected with qPSC (qPSC), with qPSC+Tc17 cells (qPSC+Tc17) or with qPSC+DKOTc17 cells (qPSC+DKOTc17), based on previously published scoring, (n=4). (C) Tumour-growth curve of subcutaneous tumours is shown (tumour volume mm, mean±SEM, n=5 mice, one representative of two independent experiments each with 5–7 mice). **p<0.01, ***p<0.001, ****p<0.0001 indicate the tumour volume comparisons between the groups with qPSC+Tc17 versus qPSC. (D) FACS analysis of Ly6chigh cell frequency in gated EPCAM-CD45-PDPN+ fibroblasts in subcutaneous tumours (n=8–10). (E) qPCR analysis of the indicated gene expression by sorted from subcutaneous tumours EPCAM-CD45-PDPN+ fibroblasts (mean±SD, n=5–8). Fold of mRNA expression is shown, normalised to the qPSC group, which was arbitrarily set to 1. (F) Scheme of the experimental design. 2×10⁴ KPC tumour cells with/without 2×10⁴ CD90.1+qPSC were orthotopically injected into WT mice, which received on the next day i.p. injections of PBS or 106 WT (Tc17) or IL-17A/FDKO Tc17 (DKOTc17) cells or PBS. The tumour volume and CAF were analysed at the indicated end of the experiment. (G) Tumour volume of orthotopic tumours of mice injected with KPC cells alone (-) or co-injected with qPSC (qPSC), with qPSC+Tc17 cells (qPSC+Tc17) or with qPSC+DKOTc17 cells (qPSC+DKOTc17) is shown (tumour volume in MM3; mean±SD, n=8–9 mice). (H) FACS analysis of Ly6chigh cell frequency in gated EPCAM-CD45-PDPN+ cells in orthotopic tumours of mice treated as indicated (mean±SD, n=8–9). (I) Scheme of the experimental design. 1.5×10⁴ KPC tumour cells±6 × 10⁴ CD90.1+qPSC were orthotopically injected into WT or Il17af-/- mice. The tumour volume and CAF were analysed at the indicated end of the experiment. (J) Tumour volume of orthotopic tumours of WT and Il17af-/- mice injected with KPC cells alone (-) or co-injected with qPSC (qPSC) is shown (tumour volume in MM3; mean±SD, n=6–7 mice). (K) FACS analysis of Ly6chigh cell frequency in gated EPCAM-CD45-PDPN+ fibroblasts in orthotopic tumours (n=6–7). (L) Scheme of the experimental design. 2×10⁴ KPC tumour cells±2 × 10⁴ WT or Il17ra-/- CD90.1+qPSC were orthotopically injected into Il17ra-/- mice, which received on the next day i.p. injection of PBS or 106 Tc17 cells. The CAF analysis was performed at the indicated end of the experiment. (M) Tumour volume of orthotopic tumours of Il17ra-/- mice injected with KPC cells alone (-) or co-injected with WT qPSC+Tc17 cells (WT qPSC+Tc17) or with Il17ra-/- qPSC+Tc17 cells (Il17ra-/- qPSC+Tc17) is shown (tumour volume in MM3; mean±SD, n=8–10 mice). (N) FACS analysis of Ly6chigh cell frequency in gated EPCAM-CD45-PDPN+ cells in tumours of mice treated as indicated (mean±SD, n=6–7). (O) Summary with the proposed mechanism of an indirect cancer-promoting role of Tc17 cells in PDAC. Tc17 cells via synergistic effect of secreted cytokines, IL-17A and TNF, shift PSC differentiation towards iCAF formation in an IL-17RA-dependent manner. In turn, Tc17-induced iCAF promote Tc17 differentiation via secreted IL-6 in combination with TGFβ. Furthermore, Tc17-induced iCAF imprint pancreatic tumour cells with a unique transcriptional profile characterised by the expression of genes involved in proliferation, signal transduction, metabolism and protection from apoptosis, thereby enhancing tumour growth. (B, D, E, G, H, J, K, M, N) Biological replicates are plotted. In (C) *p<0.05, **p<0.01, ***p<0.001, ****p<0.0001 determined by two-way ANOVA with Bonferroni post hoc test, in (B, D, N) *p<0.05, **p<0.01 by Kruskal-Wallis-test, in (E, G, H, J, K, M) *p<0.05, **p<0.01, ***p<0.001, ****p<0.0001 and p values by one-way ANOVA followed by Tukey’s HSD multiple comparison test. ANOVA, analysis of variance; iCAF, inflammatory cancer-associated fibroblasts; PBS, phosphate-buffered saline; PDAC, pancreatic ductal adenocarcinoma.

Comment in

References

    1. Siegel RL, Miller KD, Jemal A. Cancer statistics, 2020. CA Cancer J Clin 2020;70:7–30. 10.3322/caac.21590 - DOI - PubMed
    1. Huber M, Brehm CU, Gress TM, et al. . The immune microenvironment in pancreatic cancer. Int J Mol Sci 2020;21:7307. 10.3390/ijms21197307 - DOI - PMC - PubMed
    1. Sahai E, Astsaturov I, Cukierman E, et al. . A framework for advancing our understanding of cancer-associated fibroblasts. Nat Rev Cancer 2020;20:174–86. 10.1038/s41568-019-0238-1 - DOI - PMC - PubMed
    1. Öhlund D, Handly-Santana A, Biffi G, et al. . Distinct populations of inflammatory fibroblasts and myofibroblasts in pancreatic cancer. J Exp Med 2017;214:579–96. 10.1084/jem.20162024 - DOI - PMC - PubMed
    1. Krishnamurty AT, Shyer JA, Thai M, et al. . LRRC15+ myofibroblasts dictate the stromal setpoint to suppress tumour immunity. Nature 2022;611:148–54. 10.1038/s41586-022-05272-1 - DOI - PMC - PubMed

Publication types

MeSH terms