. 2023 May;66(5):897-912.
doi: 10.1007/s00125-023-05877-9. Epub 2023 Feb 10.

Islet Autoantibody Standardization Program: interlaboratory comparison of insulin autoantibody assay performance in 2018 and 2020 workshops

Affiliations

Islet Autoantibody Standardization Program: interlaboratory comparison of insulin autoantibody assay performance in 2018 and 2020 workshops

Ilaria Marzinotto et al. Diabetologia. 2023 May.

Abstract

Aims/hypothesis: The Islet Autoantibody Standardization Program (IASP) aims to improve the performance of immunoassays measuring autoantibodies in type 1 diabetes and the concordance of results across laboratories. IASP organises international workshops distributing anonymised serum samples to participating laboratories and centralises the collection and analysis of results. In this report, we describe the results of assays measuring IAA submitted to the IASP 2018 and 2020 workshops.

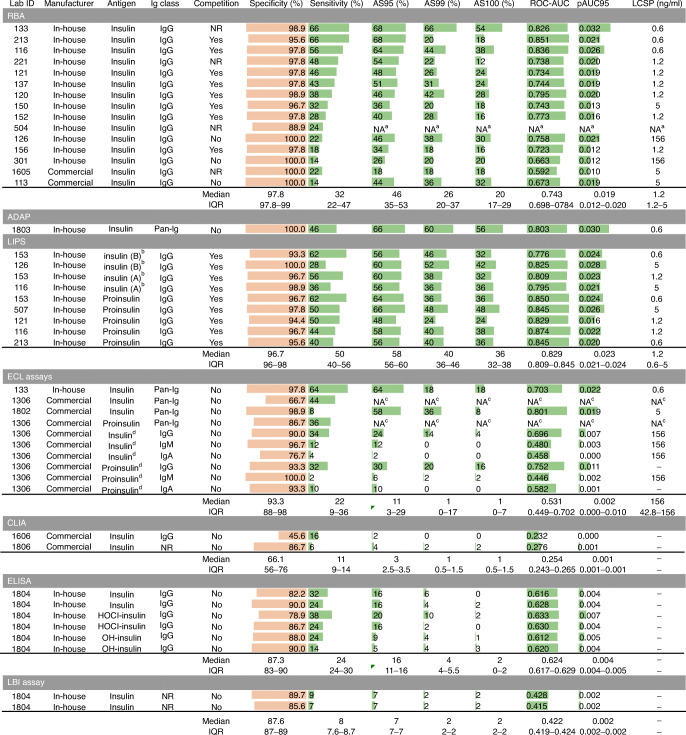
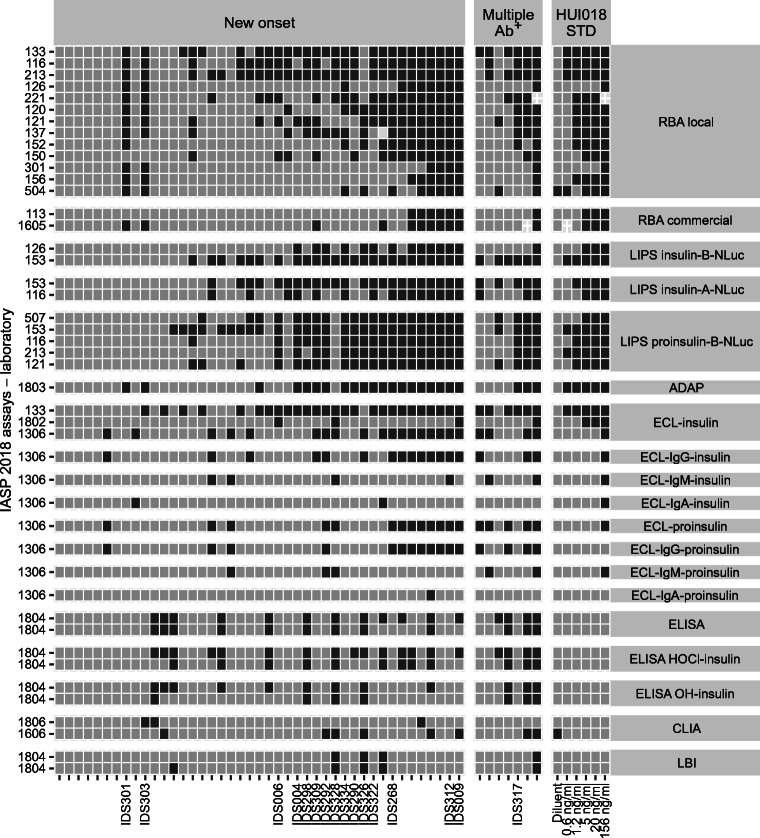
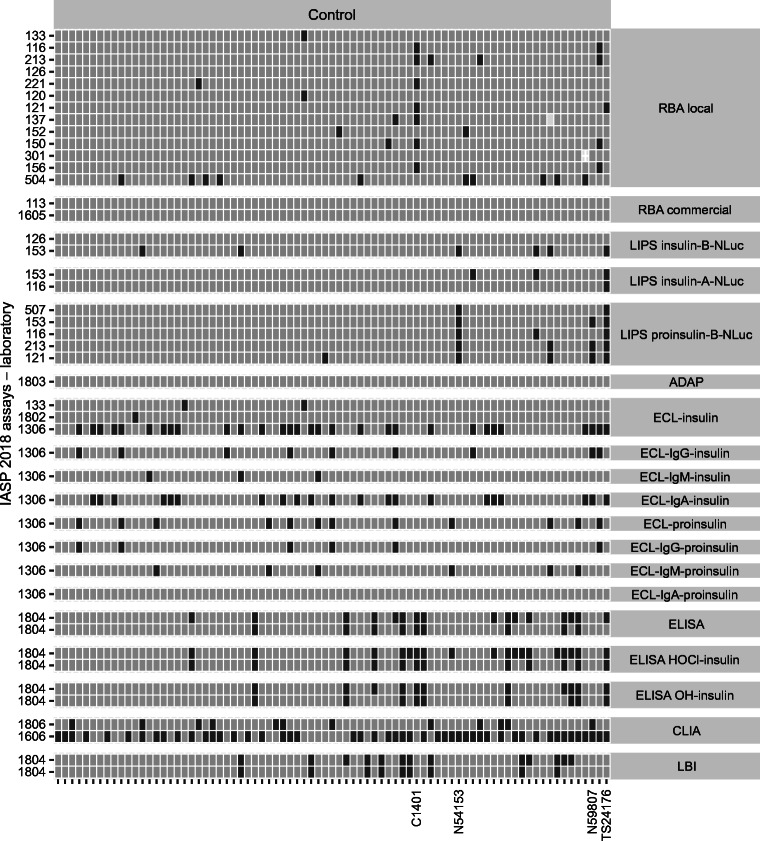
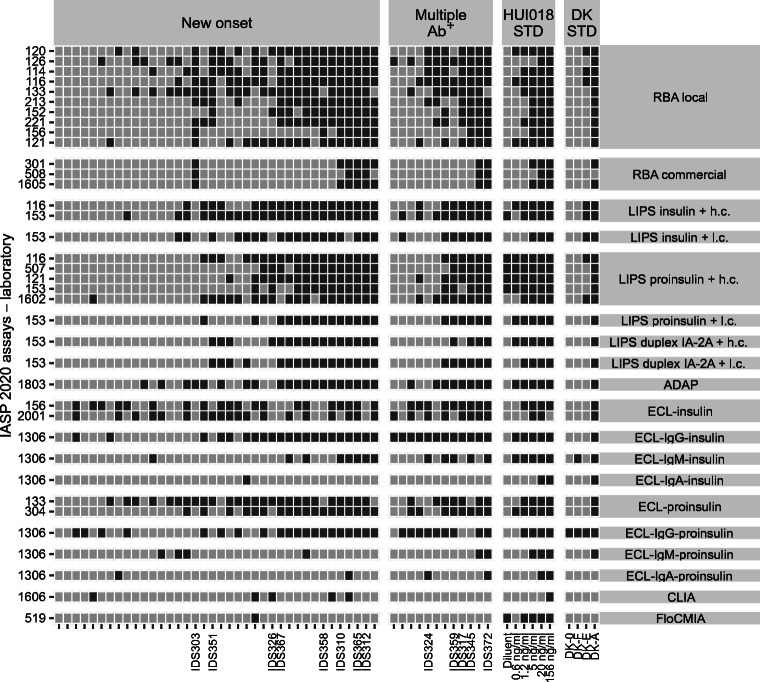
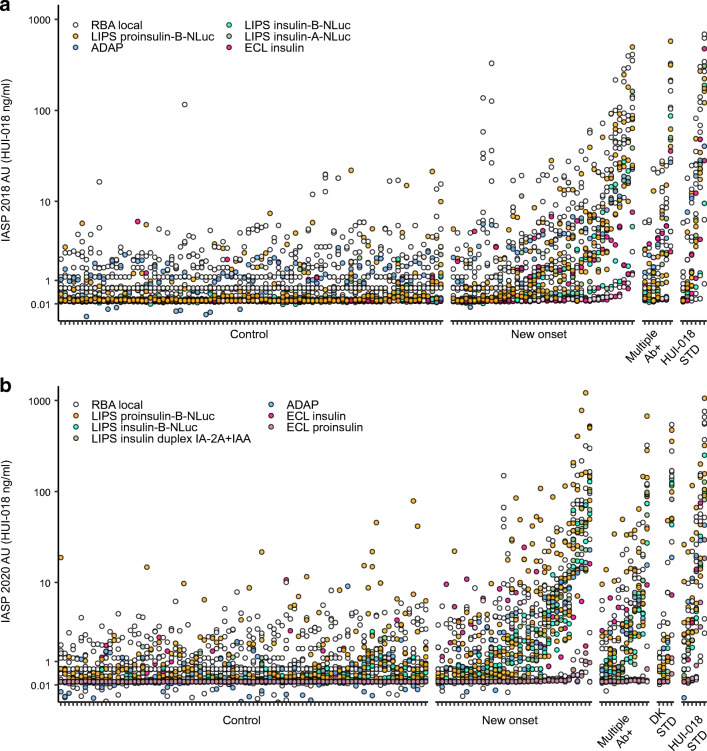
Methods: The IASP distributed uniquely coded sera from individuals with new-onset type 1 diabetes, multiple islet autoantibody-positive individuals, and diabetes-free blood donors in both 2018 and 2020. Serial dilutions of the anti-insulin mouse monoclonal antibody HUI-018 were also included. Sensitivity, specificity, area under the receiver operating characteristic curve (ROC-AUC), partial ROC-AUC at 95% specificity (pAUC95) and concordance of qualitative/quantitative results were compared across assays.

Results: Results from 45 IAA assays of seven different formats and from 37 IAA assays of six different formats were submitted to the IASP in 2018 and 2020, respectively. The median ROC-AUC was 0.736 (IQR 0.617-0.803) and 0.790 (IQR 0.730-0.836), while the median pAUC95 was 0.016 (IQR 0.004-0.021) and 0.023 (IQR 0.014-0.026) in the 2018 and 2020 workshops, respectively. Assays largely differed in AUC (IASP 2018 range 0.232-0.874; IASP 2020 range 0.379-0.924) and pAUC95 (IASP 2018 and IASP 2020 range 0-0.032).

Conclusions/interpretation: Assay formats submitted to this study showed heterogeneous performance. Despite the high variability across laboratories, the in-house radiobinding assay (RBA) remains the gold standard for IAA measurement. However, novel non-radioactive IAA immunoassays showed a good performance and, if further improved, might be considered valid alternatives to RBAs.

Keywords: Autoantibodies; IAA; IASP interlaboratory comparison study; Sensitivity; Specificity; Type 1 diabetes.


Figures

Fig. 1
Fig. 1
IASP 2018 assay formats: main characteristics and performance. Single assays and their main characteristics are reported with the corresponding specificity (orange bars indicate the % specificity, with a maximum of 100%), sensitivity, AS95, AS99, AS100 (green bars indicate the % sensitivity, with a maximum of 100%), ROC-AUC, pAUC95 (green bars indicate the maximum value of 1 and 0.05, respectively) and LCSP. Assays are grouped by format. The median and the IQR values of each variable are reported for each group. aLocal units were not reported by the participating laboratory (only positivity scores). bThe NanoLuc reporter is alternatively placed near the insulin B or A chain. cPositivity scores in pan-Ig ECL assays for laboratory 1306 were assigned based on the combination (and/or) of positivity scores in the corresponding multiplexed Ig class-specific ECL assays (thus, no units were reported for either assay). dMultiplexed Ig class-specific insulin or proinsulin assays. NR, not reported
Fig. 2
Fig. 2
IASP 2020 assay formats: main characteristics and performance. Single assays and their main characteristics are reported with the corresponding specificity (orange bars indicate the % specificity, with a maximum of 100%), sensitivity, AS95, AS99, AS100 (green bars indicate the % sensitivity, with a maximum of 100%), ROC-AUC, pAUC95 (green bars indicate the maximum value of 1 and 0.05, respectively) and LCSP. Assays are grouped by format. The median and the IQR values of each variable are reported for each group. aDuplex LIPS assays multiplexing IAA and IA-2A testing using a dual luciferase system. bMultiplexed with the measurement of IA-2A, GADA, ZnT8A and autoantibodies to transglutaminase (TGA). cMultiplexed Ig class-specific insulin or proinsulin assays. NR, not reported
Fig. 3
Fig. 3
ROC curve analysis of assays submitted to the IASP 2018 (ag) and IASP 2020 (hm) workshops. ROC curves are shown for RBA (a: n=14 and h: n=13), LIPS (b: n=9 and i: n=11), ECL (c: n=8 and j: n=8), ADAP (d: n=1 and k: n=1), ELISA (e: n=6), LBI (f: n=2), CLIA (g: n=2 and m: n=1) and FloCMIA (l: n=1); indicated assay variants within each format are shown by curve colour. Black lines, median ROC curve; grey rectangles, area corresponding to a specificity ≥95%, where the pAUC95 is calculated; dashed lines, identity line. h.c., high concentration of unlabelled insulin competitor (3.6 × 10−7 mol/l); l.c., low concentration of unlabelled insulin competitor (1.1 × 10−9 mol/l)
Fig. 4
Fig. 4
Distribution of the pAUC95 of IAA assays submitted to the IASP 2018 (a) and IASP 2020 (b) workshops. Results are grouped by assay format. LIPS assays using two alternative amounts of unlabelled insulin are labelled as either high (h.c., 3.6 × 10−7 mol/l) or low concentration (l.c., 1.1 × 10−9 mol/l). The grey half violin plots show the overall probability density estimate. Circles correspond to the pAUC95 value of each single assay, with colours indicating different assay variants. The vertical dashed lines correspond to the median pAUC95 of all assays (black) and to the ROC identity line (red), respectively
Fig. 5
Fig. 5
Tilemap of IAA positivity scores in case sera submitted to the IASP 2018 workshop. Tilemap of IAA-positive (dark grey) or -negative (light grey) scores assigned by laboratories to each new-onset type 1 diabetes, multiple autoantibody-positive and HUI-018 standard samples. Samples are sorted on the x-axis according to the median rank calculated in each group. The shown sample labels identify sera with format-specific patterns of reactivity described in the text. Assays on the y-axis are grouped by format or format variant and then sorted according to their median pAUC95. Ab+, autoantibody-positive; HUI-018 STD, HUI-018 standard dilutions
Fig. 6
Fig. 6
Tilemap of IAA positivity scores in control sera submitted to the IASP 2018 workshop. Tilemap of IAA-positive (dark grey) or -negative (light grey) scores assigned by laboratories to each control sample. Samples are sorted on the x-axis according to the median rank calculated in each group. The shown sample labels identify sera with format-specific patterns of reactivity described in the text. Assays on the y-axis are grouped by format or format variant and then sorted according to their median pAUC95. Only samples with a positive score in at least one assay are shown
Fig. 7
Fig. 7
Tilemap of IAA positivity scores in case sera submitted to the IASP 2020 workshop. Tilemap of IAA-positive (dark grey) or -negative (light grey) scores assigned by laboratories to each sample of new-onset type 1 diabetes, multiple autoantibody-positive, DK standard and HUI-018 standard sera. The shown sample labels identify sera with format-specific patterns of reactivity described in the text. Samples are sorted on the x-axis according to the median rank calculated in each group. Assays on the y-axis are grouped by format or format variant and then sorted according to their median pAUC95. LIPS assays using two alternative amounts of unlabelled insulin are labelled as either high (h.c., 3.6 × 10−7 mol/l) or low concentration (l.c., 1.1 × 10−9 mol/l). Ab+, autoantibody-positive. DK STD, test standards distributed by the NIDDK consortium
Fig. 8
Fig. 8
Tilemap of IAA positivity scores in control sera submitted to the IASP 2020 workshop. Tilemap of IAA-positive (dark grey) or -negative (light grey) scores assigned by laboratories to each control sample. Samples are sorted on the x-axis according to the median rank calculated in each group. The shown sample labels identify sera with format-specific patterns of reactivity described in the text. Assays on the y-axis are grouped by format or format variant and then sorted according to their median pAUC95. LIPS assays using two alternative amounts of unlabelled insulin are labelled as either high (h.c., 3.6 × 10−7 mol/l) or low concentration (l.c., 1.1 × 10−9 mol/l)
Fig. 9
Fig. 9
Stripchart of common HUI-018 units in selected assays submitted to the IASP 2018 (a) and IASP 2020 (b) workshops. Samples from blood donors, individuals with new-onset type 1 diabetes, multiple autoantibody positivity, DK and HUI-018 standards are sorted on the x-axis according to the median rank calculated in each group. Circles show the HUI-018 units attributed to each sample; circle colour indicates assay format. Ab+, autoantibody-positive; AU, arbitrary units calculated as HUI-018 ng/ml equivalents. DK STD, test standards distributed by the NIDDK consortium

References

    1. Moinat P, Marston E. A quantitative estimation of antibodies to exogenous insulin in diabetic subjects. Diabetes. 1958;7(6):462–467. doi: 10.2337/diab.7.6.462. - DOI - PubMed
    1. Cappellani D, Macchia E, Falorni A, Marchetti P. Insulin autoimmune syndrome (Hirata disease): a comprehensive review fifty years after its first description. Diabetes Metab Syndr Obes Targets Ther. 2020;13:963–978. doi: 10.2147/DMSO.S219438. - DOI - PMC - PubMed
    1. Palmer JP, Asplin CM, Clemons P, et al. Insulin antibodies in insulin-dependent diabetics before insulin treatment. Science. 1983;222(4630):1337–1339. doi: 10.1126/science.6362005. - DOI - PubMed
    1. Censi S, Mian C, Betterle C. Insulin autoimmune syndrome: from diagnosis to clinical management. Ann Transl Med. 2018;6(17):335–335. doi: 10.21037/atm.2018.07.32. - DOI - PMC - PubMed
    1. Vehik K, Bonifacio E, Lernmark Å, et al. Hierarchical order of distinct autoantibody spreading and progression to type 1 diabetes in the TEDDY study. Diabetes Care. 2020;43(9):2066–2073. doi: 10.2337/dc19-2547. - DOI - PMC - PubMed

Publication types