. 2023 May;66(5):931-954.
doi: 10.1007/s00125-023-05878-8. Epub 2023 Feb 10.

Tcf7l2 in hepatocytes regulates de novo lipogenesis in diet-induced non-alcoholic fatty liver disease in mice

Affiliations

Tcf7l2 in hepatocytes regulates de novo lipogenesis in diet-induced non-alcoholic fatty liver disease in mice

Da Som Lee et al. Diabetologia. 2023 May.

Abstract

Aims/hypothesis: Non-alcoholic fatty liver disease (NAFLD) associated with type 2 diabetes may more easily progress towards severe forms of non-alcoholic steatohepatitis (NASH) and cirrhosis. Although the Wnt effector transcription factor 7-like 2 (TCF7L2) is closely associated with type 2 diabetes risk, the role of TCF7L2 in NAFLD development remains unclear. Here, we investigated how changes in TCF7L2 expression in the liver affects hepatic lipid metabolism based on the major risk factors of NAFLD development.

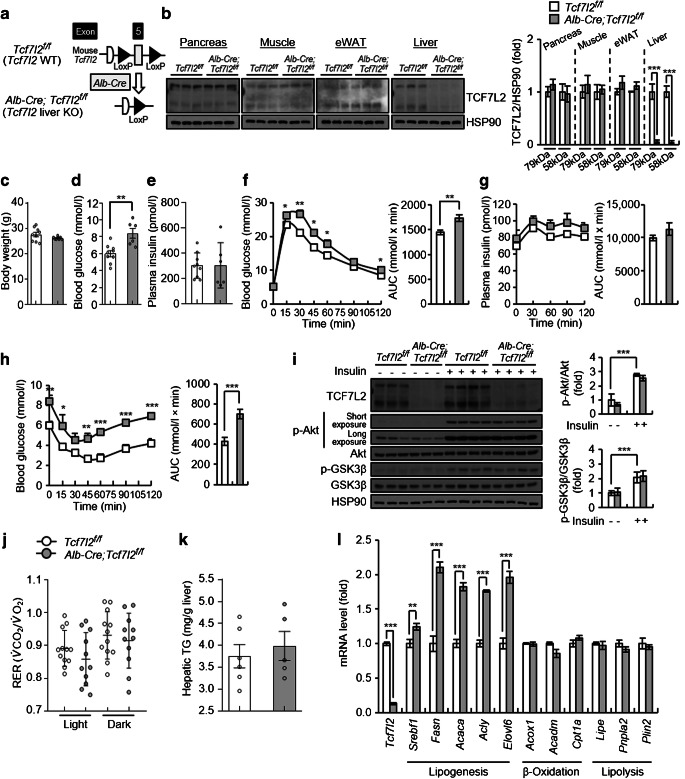
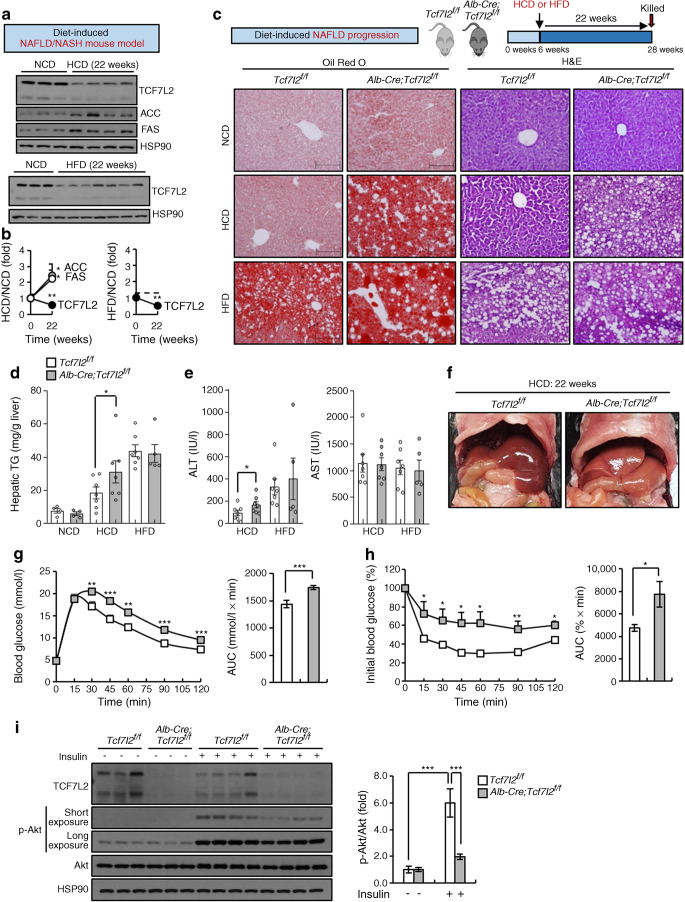
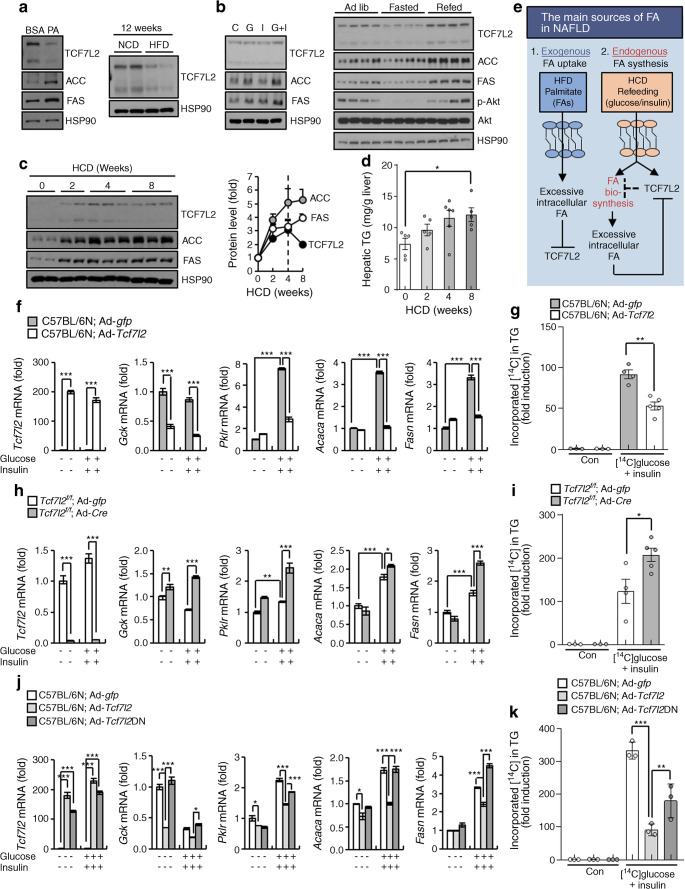
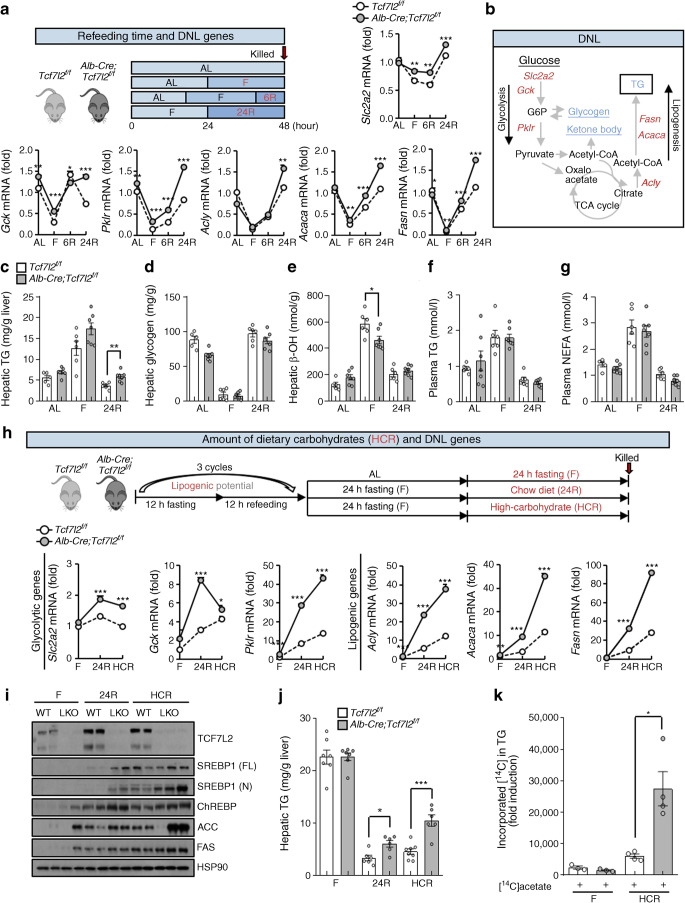
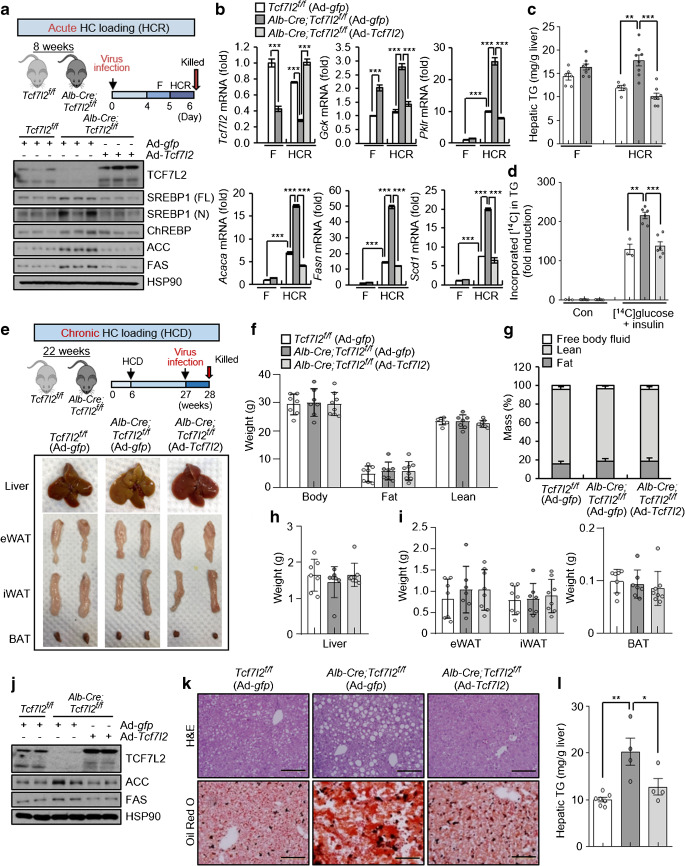
Methods: Tcf7l2 was selectively ablated in the liver of C57BL/6N mice by inducing the albumin (Alb) promoter to recombine Tcf7l2 alleles floxed at exon 5 (liver-specific Tcf7l2-knockout [KO] mice: Alb-Cre;Tcf7l2f/f). Alb-Cre;Tcf7l2f/f and their wild-type (Tcf7l2f/f) littermates were fed a high-fat diet (HFD) or a high-carbohydrate diet (HCD) for 22 weeks to reproduce NAFLD/NASH. Mice were refed a standard chow diet or an HCD to stimulate de novo lipogenesis (DNL) or fed an HFD to provide exogenous fatty acids. We analysed glucose and insulin sensitivity, metabolic respiration, mRNA expression profiles, hepatic triglyceride (TG), hepatic DNL, selected hepatic metabolites, selected plasma metabolites and liver histology.

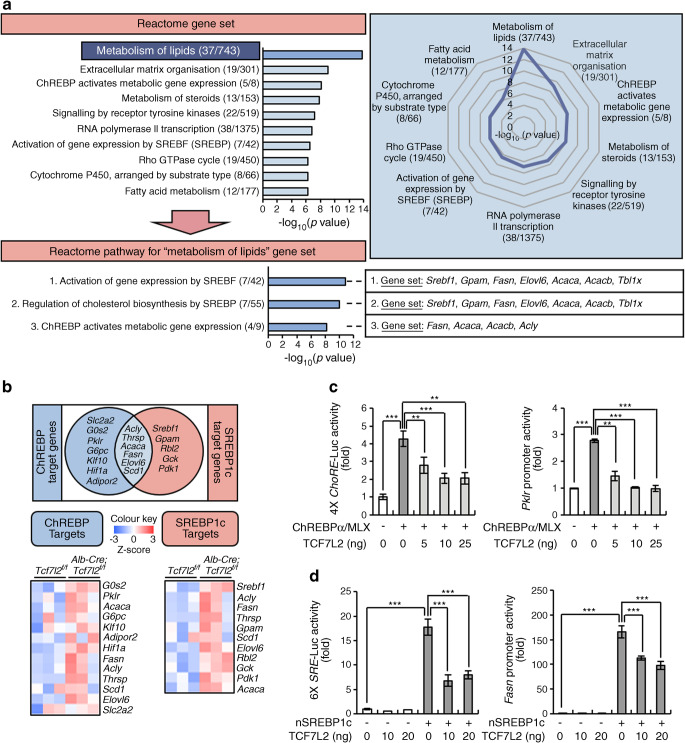
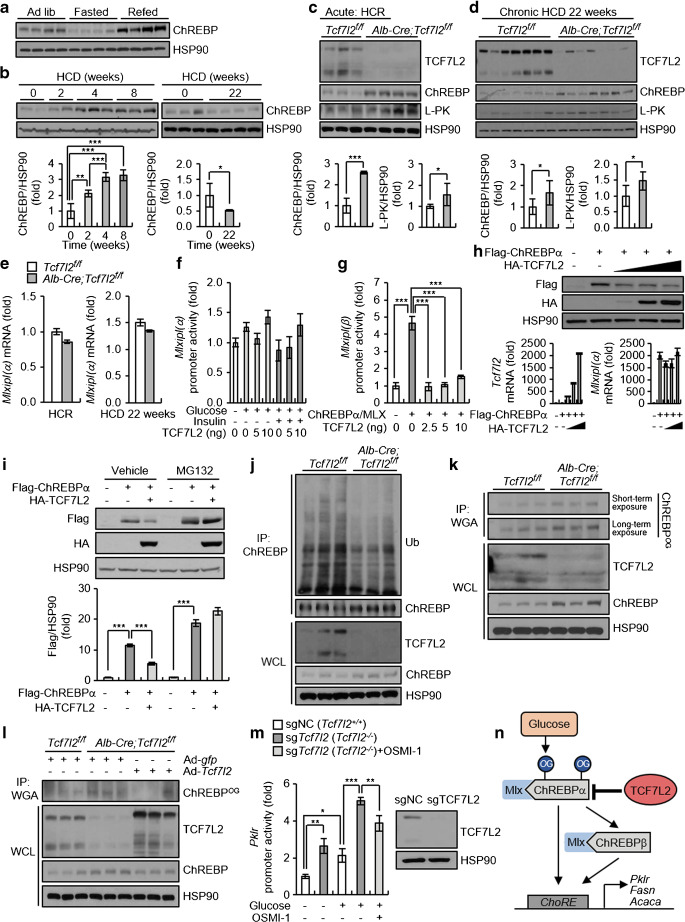
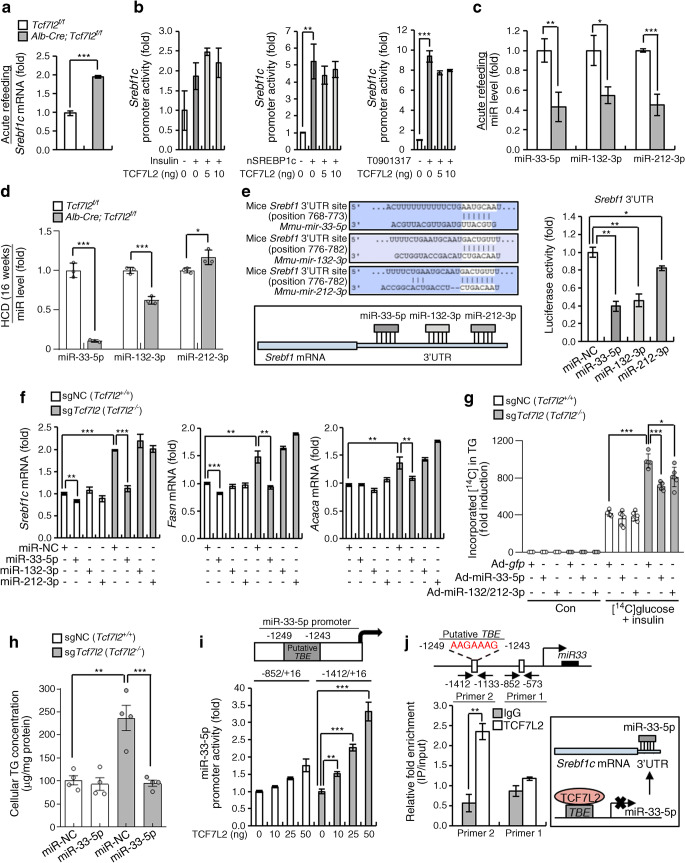
Results: Alb-Cre;Tcf7l2f/f essentially exhibited increased lipogenic genes, but there were no changes in hepatic lipid content in mice fed a normal chow diet. However, following 22 weeks of diet-induced NAFLD/NASH conditions, liver steatosis was exacerbated owing to preferential metabolism of carbohydrate over fat. Indeed, hepatic Tcf7l2 deficiency enhanced liver lipid content in a manner that was dependent on the duration and amount of exposure to carbohydrates, owing to cell-autonomous increases in hepatic DNL. Mechanistically, TCF7L2 regulated the transcriptional activity of Mlxipl (also known as ChREBP) by modulating O-GlcNAcylation and protein content of carbohydrate response element binding protein (ChREBP), and targeted Srebf1 (also called SREBP1) via miRNA (miR)-33-5p in hepatocytes. Eventually, restoring TCF7L2 expression at the physiological level in the liver of Alb-Cre;Tcf7l2f/f mice alleviated liver steatosis without altering body composition under both acute and chronic HCD conditions.

Conclusions/interpretation: In mice, loss of hepatic Tcf7l2 contributes to liver steatosis by inducing preferential metabolism of carbohydrates via DNL activation. Therefore, TCF7L2 could be a promising regulator of the NAFLD associated with high-carbohydrate diets and diabetes since TCF7L2 deficiency may lead to development of NAFLD by promoting utilisation of excess glucose pools through activating DNL.

Data availability: RNA-sequencing data have been deposited into the NCBI GEO under the accession number GSE162449 ( www.ncbi.nlm.nih.gov/geo/query/acc.cgi?acc=GSE162449 ).

Keywords: Carbohydrate; De novo lipogenesis; Fatty acid; Glucose; Insulin; Lipogenesis; NAFLD; TCF7L2; TG accumulation; Type 2 diabetes.


Figures

Fig. 1
Fig. 1
Metabolic phenotypes of Alb-Cre;Tcf7l2f/f mice on a normal chow diet (NCD). (a) Strategy for generating Alb-Cre;Tcf7l2f/f (mice with Tcf7l2 liver-specific KO). (b) Representative western blot showing TCF7L2 expression in the peripheral tissues of 10-week-old Tcf7l2f/f (n=3) and Alb-Cre;Tcf7l2f/f (n=3) mice. Quantification of TCF7L2 protein levels is also shown. eWAT, epididymal white adipose tissue; WT, wild-type. (c–e) 10-week-old Tcf7l2f/f (n=9) and Alb-Cre;Tcf7l2f/f (n=6) mice fed an NCD were assessed for body weight (c), blood glucose levels (d) and plasma insulin levels (e). (f) GTT (1.5 g/kg body weight) in 10-week-old Tcf7l2f/f (n=9) and Alb-Cre;Tcf7l2f/f (n=6) mice fed an NCD, with glucose AUC is presented. *p<0.05, **p<0.01, Alb-Cre;Tcf7l2f/f vs wild-type mice at the same time point, analysed by unpaired Student’s t test. (g) Plasma insulin concentration during GTT in 10-week-old Tcf7l2f/f (n=9) and Alb-Cre;Tcf7l2f/f (n=6) mice fed an NCD, with insulin AUC presented. (h) ITT (1 U/kg body weight) in 10-week-old Tcf7l2f/f (n=9) and Alb-Cre;Tcf7l2f/f (n=6) mice fed an NCD, with glucose AUC is presented. *p<0.05, **p<0.01, ***p<0.001, Alb-Cre;Tcf7l2f/f vs wild-type mice at the same time point, analysed by unpaired Student’s t test. (i) Ten-week-old Tcf7l2f/f (n=12) and Alb-Cre;Tcf7l2f/f (n=12) mice were fasted for 6 h and then injected intraperitoneally with insulin (10 U/kg body weight) or saline for 10 min. Representative western blot showing the effects of hepatic Tcf7l2 depletion on the hepatic insulin signalling pathway. The p-Akt/Akt and phosphorylated glycogen synthase kinase-3 β (p-GSK3β/GSK3β ratios are presented. (j) RER in 10-week-old Tcf7l2f/f (n=12) and Alb-Cre;Tcf7l2f/f (n=11) mice fed an NCD. RER was measured hourly in each metabolic chamber using the Oxylet Pro system. Average RER values for light (09:00–21:00 hours) and dark (21:00–09:00 hours) phases in a 12 h/12 h light/dark cycle are presented. (k, l) Ten-week-old Tcf7l2f/f (n=6) and Alb-Cre;Tcf7l2f/f (n=5) mice were fasted for 6 h, after which hepatic TG levels (k) and gene expression (l) were analysed. (l) Quantitative PCR (qPCR) analysis showing mRNA expression of genes involved in lipid metabolism in the liver of mice. The key in (b) also applies to (ci) (k) and (l). Data in (b), (i) and (l) are presented as mean±SD; data in (c–h) (j) and (k) are presented as mean±SEM. *p<0.05, **p<0.01, ***p<0.001, analysed by t test
Fig. 2
Fig. 2
Effects of hepatic Tcf7l2 depletion following 22 weeks of HCD and HFD feeding, used as models for diet-induced NAFLD/NASH. (a) Representative western blot showing TCF7L2, ACC and FAS protein levels in the liver of mice fed an HCD or HFD for 22 weeks. (b) Graph showing relative protein levels of TCF7L2, ACC and FAS in the liver of mice fed an HCD (n=4) or HFD (n=7) for 22 weeks compared with a normal chow diet (NCD; n=3). *p<0.05, **p<0.01, 22 weeks vs 0 weeks, analysed by unpaired Student’s t test. (ce) Six-week-old Tcf7l2f/f and Alb-Cre;Tcf7l2f/f mice were fed an NCD for 22 weeks (n=4 for both genotypes; control groups), or were given an HCD (n=7 for both genotypes) or an HFD for 22 weeks (Tcf7l2f/f, n=7; Alb-Cre;Tcf7l2f/f, n=5) to induce NAFLD progression. Subsequently, frozen liver sections were stained using Oil Red O and H&E (representative images are shown; ×20 magnification; scale bars, 200 μm; c), and hepatic TG levels (d) and plasma alanine aminotransferase (ALT) and aspartate aminotransferase (AST) levels (e) were measured. (f) Six-week-old Tcf7l2f/f (n=9) and Alb-Cre;Tcf7l2f/f mice (n=11) were fed an HCD for 22 weeks. Subsequently, intra-abdominal liver images were taken (representative images shown). (g, h) Six-week-old Tcf7l2f/f (n=9) and Alb-Cre;Tcf7l2f/f mice (n=11) were fed an HCD for 22 weeks. Following this, a GTT (1.5 g/kg body weight; g) and ITT (1 U/kg body weight; h) were conducted. Glucose AUCs are also presented for both GTT and ITT. *p<0.05, **p<0.01, ***p<0.001, Alb-Cre;Tcf7l2f/f vs wild-type mice at same time point, analysed by unpaired Student’s t test. (i) Six-week-old Tcf7l2f/f (n=8) and Alb-Cre;Tcf7l2f/f (n=9) mice were fed an HCD for 22 weeks. Mice were fasted for 6 h and then injected intraperitoneally with insulin (10 U/kg body weight) or saline for 10 min. Presented is a representative western blot showing the effects of hepatic Tcf7l2 deficiency on the hepatic insulin signalling pathway. The p-Akt/Akt ratio is also shown. HSP90, heat shock protein 90. Key in (d) also applies to (eh). Data in (b) and (i) are presented as mean±SD; data in (d) (e), (g) and (h) are presented as mean±SEM. *p<0.05, **p<0.01, ***p<0.001, analysed by t test
Fig. 3
Fig. 3
Cell-autonomous role of hepatic TCF7L2 in regulating DNL. (a) Representative western blots showing protein levels of TCF7L2, ACC and FAS in mouse primary hepatocytes treated with BSA or 250 μmol/l palmitic acid (PA) for 24 h (data are representative of n=3 independent experiments) and TCF7L2 protein levels in the liver of C57BL/6N mice fed an HFD (n=4) or a normal chow diet (NCD; n=4) for 12 weeks. (b) Representative western blots showing protein levels of TCF7L2, ACC and FAS in mouse primary hepatocytes treated with 25 mmol/l glucose (G) and/or 10 nmol/l insulin (I) or saline (control [C]) for 48 h (data are representative of n=3 independent experiments), and TCF7L2, ACC, FAS, p-Akt and Akt levels in the liver of 10-week old C57BL/6N mice under ad libitum (ad lib; n=4), 24 h fasted (n=4) or 24 h refed (n=4) conditions. Quantification data are presented in ESM Fig. 5a and ESM Fig. 5c. (c, d) C57BL/6N mice were fed an HCD for 2, 4 and 8 weeks (n=5 per group; for this experiment, at '0 weeks of HCD feeding', n=5 mice that had been fed an NCD for 8 weeks were used). Representative western blot showing TCF7L2, ACC and FAS protein levels is shown alongside the quantified relative protein levels (TCF7L2/heat shock protein 90 [HSP90], ACC/HSP90 and FAS/HSP90 ratios) (c; further quantification data, including details of statistical significance, are presented in ESM Fig. 5d). Hepatic TG levels are also presented (d). *p<0.05, analysed by one-way ANOVA with Tukey’s post hoc test. (e) Schematic diagram showing the hypothesised function of hepatocyte TCF7L2 in hepatic lipid metabolism. FA, fatty acid. (f) Primary hepatocytes were isolated from 10-week-old C57BL/6N mice. Cells were infected with adenovirus expressing Tcf7l2 (Ad-Tcf7l2) or Ad-gfp and treated with 25 mmol/l glucose and 10 nmol/l insulin for 48 h. Subsequently, quantitative PCR (qPCR) analysis of Tcf7l2 and glycolytic (Gck and Pklr) and lipogenic (Acaca and Fasn) genes was conducted (n=3 per group). (g) Primary hepatocytes were isolated from 10-week-old C57BL/6N mice. Cells were infected with Ad-gfp or Ad-Tcf7l2 and treated with 37 kBq of [14C]glucose and 10 nmol/l insulin or 3% (vol./vol.) ethanol in saline (control [Con]) for 48 h. Incorporation of [14C]glucose into TG was measured to determine DNL rate. (h) Primary hepatocytes were isolated from 10-week-old Tcf7l2f/f mice. Cells were infected with adenovirus expressing Cre (Ad-Cre) or Ad-gfp and treated with 25 mmol/l glucose and 10 nmol/l insulin for 48 h. Subsequently, qPCR analysis of Tcf7l2 and glycolytic and lipogenic gene expression was conducted (n=3 per group). (i) Primary hepatocytes were isolated from 10-week-old Tcf7l2f/f mice. Cells were infected with Ad-gfp or Ad-Cre and treated with 37 kBq of [14C]glucose and 10 nmol/l insulin or 3% (vol./vol.) ethanol in saline (Con) for 48 h. Incorporation of [14C]glucose into TG was measured to determine DNL rate. (j) Primary hepatocytes were isolated from 10-week-old C57BL/6N mice. Cells were infected with Ad-gfp, adenovirus expressing wild-type Tcf7l2 (Ad-Tcf7l2) or adenovirus expressing Tcf7l2 DN mutant (Ad-Tcf7l2DN) and treated with 25 mmol/l glucose and 10 nmol/l insulin for 48 h. Subsequently, qPCR analysis of Tcf7l2 and glycolytic and lipogenic gene expression was conducted (n=3 per group). *p<0.05, ***p<0.001, analysed by one-way ANOVA with Tukey’s post hoc test. (k) Primary hepatocytes were isolated from 10-week-old C57BL/6N mice. Cells were infected with Ad-gfp, Ad-Tcf7l2WT or Ad-Tcf7l2DN and treated with 37 kBq of [14C]glucose and 10 nmol/l insulin or 3% (vol./vol.) ethanol in saline (Con) for 48 h. Incorporation of [14C]glucose into TG was measured to determine DNL rate. **p<0.01, ***p<0.001, analysed by one-way ANOVA with Tukey’s post hoc test. Data in (c), (d), (g) and (ik) are presented as mean±SEM; data in (f) and (h) are presented as mean±SD. *p<0.05, **p<0.01, ***p<0.001, analysed by t test, unless stated otherwise
Fig. 4
Fig. 4
Changes in intrahepatic DNL levels in Alb-Cre;Tcf7l2f/f mice following carbohydrate loading. (a) Ten-week-old Tcf7l2f/f (n=5) and Alb-Cre;Tcf7l2f/f (n=7) mice were fed regular chow ad libitum (AL; Tcf7l2f/f, n=5; Alb-Cre;Tcf7l2f/f, n=7), were fasted for 24 h (F; Tcf7l2f/f, n=6; Alb-Cre;Tcf7l2f/f, n=7), or were fasted for 24 h and refed for either 6 h (6R; Tcf7l2f/f, n=6; Alb-Cre;Tcf7l2f/f, n=7) or 24 h (24R; Tcf7l2f/f, n=6; Alb-Cre;Tcf7l2f/f, n=7). (a) The schematic diagram shows the experimental design. Also shown is quantitative PCR (qPCR) analysis of hepatic expression of glycolytic and lipogenic genes in mouse livers. *p<0.05, **p<0.01, ***p<0.001 Alb-Cre;Tcf7l2f/f vs wild-type mice under the same conditions, analysed by unpaired Student’s t test. (b) Schematic diagram of the DNL pathway. Red text, DNL-associated genes; blue text, metabolites associated with DNL. G6P, glucose 6-phosphate; TCA, tricarboxylic acid. (c–g) Ten-week-old Tcf7l2f/f and Alb-Cre;Tcf7l2f/f mice were fed regular chow ad libitum (AL; Tcf7l2f/f, n=5; Alb-Cre;Tcf7l2f/f, n=7), were fasted for 24 h (F; Tcf7l2f/f, n=6; Alb-Cre;Tcf7l2f/f, n=7), or were fasted for 24 h and refed for either 6 h (6R; Tcf7l2f/f, n=6; Alb-Cre;Tcf7l2f/f, n=7) or 24 h (24 R; Tcf7l2f/f, n=6; Alb-Cre;Tcf7l2f/f, n=7). Levels of hepatic TG (c), hepatic glycogen (d), hepatic β-OH (e), plasma TG (f) and plasma NEFA (g) were measured. (h–j) Ten-week-old Tcf7l2f/f and Alb-Cre;Tcf7l2f/f mice were fasted for 24 h (F; n=7 for both genotypes), were fasted for 24 h and refed with a chow diet for 24 h (24R; Tcf7l2f/f, n=7; Alb-Cre;Tcf7l2f/f, n=6) or fasted for 24 h and refed an HCR for 24 h (Tcf7l2f/f, n=8; Alb-Cre;Tcf7l2f/f, n=6). The fasting-feeding cycle was repeated three times at 12 h intervals prior to study. A schematic diagram showing the experimental design is shown alongside qPCR analysis of glycolytic and lipogenic gene expression in mouse liver; *p<0.05, **p<0.01, ***p<0.001 Alb-Cre;Tcf7l2f/f vs wild-type mice under the same conditions, analysed by unpaired Student’s t test (h). Representative western blot showing protein levels of TCF7L2, SREBP1 (full length [FL; 125 kDa] and nuclear [N; 60–70 kDa] forms, observed on the same blot), ChREBP, ACC and FAS in liver of Alb-Cre;Tcf7l2f/f (LKO) and Tcf7l2f/f (WT) mice (i). Hepatic TG levels (j). (k) The rate of hepatic DNL in Tcf7l2f/f and Alb-Cre;Tcf7l2f/f mice subjected to fasting for 24 h (n=3 for both genotypes) or HCR for 12 h (n=4 for both genotypes) and injected with [14C]acetate for 1 h. HSP90, heat shock protein 90. Key in (j) also applies to (k). Data in (a) and (h) are presented as mean±SD; data in (c–g), (j) and (k) are presented as mean±SEM. *p<0.05, **p<0.01, ***p<0.001, analysed by t test
Fig. 5
Fig. 5
TCF7L2 regulates hepatic lipid metabolism by targeting SREBP1c and ChREBP pathways. (a) Comparative analysis of mRNA-sequencing data from liver samples from Tcf7l2f/f and Alb-Cre;Tcf7l2f/f mice refed a normal chow diet for 24 h (n=3 per group). Reactome enrichment analysis of 526 upregulated genes (log2 fold-change cut-off >1.5) in Alb-Cre;Tcf7l2f/f mice compared with Tcf7l2f/f mice is shown. The radial line graph relates to the data for the Reactome gene set. In addition, data for the major pathways relating to the most significantly altered gene set (‘metabolism of lipids’; see ESM Table 6 for complete gene set) are presented. Values in brackets are overlap/input numbers. Rho, Ras homologous; SREBF, sterol regulatory element-binding transcription factor (also known as sterol regulatory element binding protein [SREBP]). (b) Venn diagram showing SREBP1c and ChREBP target genes in liver samples from Tcf7l2f/f and Alb-Cre;Tcf7l2f/f mice refed a normal chow diet for 24 h (n=3 per group). Heatmaps visualise hepatic expression of SREBP1c and ChREBP target genes in mice (see ESM Table 7 for list of genes). (c, d) Luciferase (Luc) reporter assay data showing the effects of TCF7L2 expression on ChREBPα/MLX-induced activation of 4× ChoRE and Pklr promoters (c) and the effects of TCF7L2 expression on nuclear SREBP1c (nSREBP1c)-induced activation of 6× SRE and Fasn promoters (d) in the HEPG2 cell line (n=3 per group). Data in (c) and (d) are presented as mean±SEM. **p<0.01, ***p<0.001, analysed by one-way ANOVA with Tukey’s post hoc test
Fig. 6
Fig. 6
TCF7L2 regulates ChREBP transcriptional activity by modulating O-GlcNAcylation and protein stability of ChREBP. (a) Representative western blot showing protein levels of ChREBP in the liver of 10-week old C57BL/6N mice under ad libitum feeding (ad lib; n=4), 24 h fasted (n=4) or 24 h refed (n=4) conditions. (b) C57BL/6N mice were fed a an HCD for 2, 4 and 8 weeks (n=5 per group; for this experiment, at ‘0 weeks of HCD feeding’, n=5 mice that had been fed a normal chow diet [NCD] for 8 weeks were used) or they were fed an HCD for 22 weeks (n=4; for this experiment, at ‘0 weeks of HCD feeding’, n=3 mice that had been fed an NCD for 22 weeks were used). Representative western blot showing ChREBP protein levels in mouse livers is shown alongside the ChREBP/heat shock protein 90 (HSP90) ratio. **p<0.01, ***p<0.001, analysed by one-way ANOVA with Tukey’s post hoc test. (c) Ten-week-old Tcf7l2f/f (n=8) and Alb-Cre;Tcf7l2f/f (n=6) mice were subjected to HCR for 24 h. Representative western blots of protein levels of TCF7L2, ChREBP and L-PK in the liver are shown. ChREBP/HSP90 and L-PK/HSP90 ratios are also shown. (d) Six-week-old Tcf7l2f/f (n=7) and Alb-Cre;Tcf7l2f/f (n=7) mice were fed an HCD for 22 weeks. Representative western blots of protein levels of TCF7L2, ChREBP and L-PK in the liver are shown. ChREBP/HSP90 and L-PK/HSP90 ratios are also shown. (e) Ten-week-old Tcf7l2f/f (n=8) and Alb-Cre;Tcf7l2f/f (n=6) mice were subjected to HCR for 24 h or 6-week-old Tcf7l2f/f (n=7) and Alb-Cre;Tcf7l2f/f (n=7) mice were fed an HCD for 22 weeks. Quantitative PCR (qPCR) analysis of mRNA expression levels of Mlxipl(α) in the liver is shown. (f) Luciferase reporter assay showing the effects of TCF7L2 expression and 25 mmol/l glucose and/or 10 nmol/l insulin treatment on Mlxipl(α) promoter activity in the HEPG2 cell line (n=3 replicates). Data are representative of n=3 independent experiments. (g) Luciferase reporter assay showing the effects of TCF7L2 expression on ChREBPα/MLX-induced activation of the Mlxipl(β) promoter in the HEPG2 cell line (n=3 replicates). Data are representative of n=3 independent experiments. ***p<0.001, assessed by one-way ANOVA with Tukey’s post hoc test. (h) HEPG2 cells were transfected with 500 ng of Flag-tagged ChREBPα and various concentrations (250 ng, 500 ng or 1000 ng) of haemagglutinin (HA)-tagged TCF7L2 for 48 h (n=3 replicates). A representative western blot showing changes in Flag-tagged ChREBPα protein levels according to expression levels of HA-tagged TCF7L2 is presented. qPCR analysis of mRNA levels of Tcf7l2 and Mlxipl(α) is also shown. Data are representative of n=3 independent experiments. (i) HEPG2 cells were transfected with HA-tagged TCF7L2 and Flag-tagged ChREBPα for 48 h and treated with 10 μmol/l MG132 or DMSO (vehicle) for 3 h (n=3 replicates). A representative western blot showing changes in ChREBPα protein stability by TCF7L2 expression is presented. Quantification of Flag-tagged ChREBPα is also shown. Data are representative of n=3 independent experiments. ***p<0.001, analysed by one-way ANOVA with Tukey’s post hoc test. (j) Tcf7l2f/f (n=3) and Alb-Cre;Tcf7l2f/f (n=3) mice were subjected to HCR for 24 h. Liver protein samples were immunoprecipitated with anti-ChREBP and a representative western blot of protein levels of ubiquitin (Ub), ChREBP, and TCF7L2 is shown. IP, immunoprecipitation; WCL, whole-cell lysate. Quantification data are presented in ESM Fig. 8a. (k) Tcf7l2f/f (n=3) and Alb-Cre;Tcf7l2f/f (n=3) mice were subjected to HCR for 24 h. Liver protein samples were immunoprecipitated with anti-WGA and a representative western blot showing protein levels of O-GlcNAcylated ChREBP (ChREBPOG), TCF7L2 and ChREBP is shown. The blots were given various film exposure times to clarify the protein bands (short-term exposure, 1 min; long-term exposure, 5 min). IP, immunoprecipitation; WCL, whole-cell lysate. Quantification data are presented in ESM Fig. 8b. (l) Tcf7l2f/f and Alb-Cre;Tcf7l2f/f mice were infected with Ad-gfp or adenovirus expressing Tcf7l2 (Ad-Tcf7l2) via the tail vein and then subjected to HCR for 24 h (n=3 per group). Liver protein samples were immunoprecipitated with WGA. A representative western blot showing protein levels of O-GlcNAcylated ChREBP (ChREBPOG), TCF7L2 and ChREBP is shown. IP, immunoprecipitation; WCL, whole-cell lysate. Quantification data (including statistical significance) are presented in ESM Fig. 8c. (m) Tcf7l2 WT (single-guide negative control [sgNC]; Tcf7l2+/+) and Tcf7l2 KO (sgTcf7l2; Tcf7l2−/−) AML12 cell lines were generated using the CRISPR-Cas9 system. Cells were transfected with the pGL4-Pklr (−191/+200) promoter and then co-treated with 25 mmol/l glucose and 40 μmol/l OSMI-1 for 24 h (n=3 replicates). Luciferase reporter assay data showing the effects of Tcf7l2 KO and OSMI-1 on Pklr promoter activity under high-glucose conditions is shown. A representative western blot showing Tcf7l2 KO in AML12 cell lines is also shown. Data are representative of n=3 independent experiments. *p<0.05, **p<0.01, ***p<0.001, analysed by one-way ANOVA with Tukey’s post hoc test. (n) Proposed mechanism underlying TCF7L2-induced regulation of ChREBP transcriptional activity. OG, O-linked GlcNAc modification. Key in (e) also applies to (c) and (d). Data in (b), (f), (g), (i) and (m) are presented as mean±SEM; data in (ce) and (h) are presented as mean±SD. *p<0.05, **p<0.01, ***p<0.001, analysed by t test, unless stated otherwise
Fig. 7
Fig. 7
miR-33-5p is a transcriptional target of TCF7L2 in the SREBP1c/miR-33-5p axis. (a) Quantitative PCR (qPCR) analysis showing Srebf1c mRNA expression in the liver of Tcf7l2f/f (n=6) and Alb-Cre;Tcf7l2f/f (n=7) mice under refeeding conditions. (b) Luciferase reporter assay data showing the effects of TCF7L2 expression on Srebf1c promoter activity following induction by insulin, nuclear SREBP1c (nSREBP1c) and the LXR agonist T0901317 in the HEPG2 cell line. (c) qPCR analysis showing expression levels of miR-33-5p, miR-132-3p and miR-212-3p in the liver of Tcf7l2f/f (n=6) and Alb-Cre;Tcf7l2f/f (n=7) mice under refeeding conditions. (d) qPCR analysis showing expression levels of miR-33-5p, miR-132-3p, and miR-212-3p in primary hepatocytes from Tcf7l2f/f (n=3) and Alb-Cre;Tcf7l2f/f (n=3) mice fed an HCD for 16 weeks. (e) miR binding sites in the Srebf1 3′UTR are shown. Luciferase reporter assay data showing effects of miR-33-5p, miR-132-3p and miR-212-3p mimics on Srebf1 3′UTR activity in the HEK293T cell line are also presented (n=3 replicates). Data are representative of n=3 independent experiments. (f) Tcf7l2 WT (single-guide negative control [sgNC]; Tcf7l2+/+) and Tcf7l2 KO (sgTcf7l2; Tcf7l2−/−) AML12 cell lines were generated using the CRISPR-Cas9 system. qPCR analysis showing mRNA levels of Srebf1c, Fasn and Acaca in sgNC and sgTcf7l2 AML12 cells transfected with miR mimics (n=3 replicates). Data are representative of n=3 independent experiments. (g) Tcf7l2 WT (sgNC; Tcf7l2+/+) and Tcf7l2 KO (sgTcf7l2; Tcf7l2−/−) AML12 cell lines were generated using the CRISPR-Cas9 system. sgNC and sgTcf7l2 AML12 cells were infected with Ad-gfp, Ad-miR-33-5p or Ad-miR-132/212-3p and treated with 3% (vol./vol.) ethanol in saline (control [Con]) (Ad-gfp, n=3 for both genotypes; Ad-miR-33-5p, n=3 for both genotypes; Ad-miR-132/212-3p, n=3 for both genotypes) or were infected with Ad-gfp, Ad-miR-33-5p or Ad-miR-132/212-3p and treated with 37 kBq of [14C]glucose and 10 nmol/l insulin (Ad-gfp; n=5 for both genotypes; Ad-miR-33-5p, n=6 for sgNC and n=5 for sgTcf7l2; Ad-miR-132/212-3p; n=5 for sgNC and n=6 for sgTcf7l2) for 48 h. Incorporation of [14C]glucose into TG was measured to determine DNL rate. (h) Tcf7l2 WT (sgNC; Tcf7l2+/+) and Tcf7l2 KO (sgTcf7l2; Tcf7l2−/−) AML12 cell lines were generated using the CRISPR-Cas9 system. Intracellular TG levels were measured in sgNC and sgTcf7l2 AML12 cells transfected with miR-33-5p mimics (n=4 per group). (i) Schematic diagram showing the location of the putative TBE site. Also presented is luciferase reporter assay data showing the effects of TCF7L2 expression on miR-33-5p promoter activity in the HEPG2 cell line (n=3 replicates). Data are representative of n=3 independent experiments. (j) Schematic diagram showing the location of the putative TBE and primers for ChIP assay targeting the miR-33-5p promoter. The bar graph presents ChIP assay data showing occupancy of TCF7L2 over the miR-33-5p promoter in the murine hepatocyte cell line AML12 (n=3 replicates). Data are representative of n=3 independent experiments. A diagram showing the proposed mechanism of TCF7L2-associated miR-33-5p regulation is also shown. IP, immunoprecipitation. Key in (a) also applies to (c). Data are presented as mean±SD. *p<0.05, **p<0.01, ***p<0.001, analysed by t test
Fig. 8
Fig. 8
Effects of restoring hepatic Tcf7l2 expression on liver steatosis induced by acute and chronic HCD feeding in Alb-Cre;Tcf7l2f/f mice. (ac) Eight-week-old Tcf7l2f/f (n=6) and Alb-Cre;Tcf7l2f/f (n=8) mice infected with Ad-gfp were fasted (F) for 24 h. Subsequently, Tcf7l2f/f (n=5) and Alb-Cre;Tcf7l2f/f mice infected with Ad-gfp (n=8) or Ad-Tcf7l2 (n=8) were subjected to HCR for 24 h. A schematic diagram showing the experimental design for generation of the acute high-carbohydrate loading mouse model is shown alongside a representative western blot showing TCF7L2, SREBP1 (full length [FL] and nuclear [N] forms), ChREBP, ACC and FAS protein levels in mouse liver (a). Quantitative PCR (qPCR) analysis showing expression levels of Tcf7l2 and glycolytic (Gck and Pklr) and lipogenic (Acaca, Fasn and Scd1) genes in mouse liver (b). Hepatic TG levels in mice (c). (d) DNL rate in primary hepatocytes isolated from Tcf7l2f/f and Alb-Cre;Tcf7l2f/f mice. Cells were infected with Ad-gfp or Ad-Tcf7l2 and treated with [14C]glucose and 10 nmol/l insulin or 3% (vol./vol.) ethanol in saline (control [Con]) for 48 h. (ei) Six-week-old Tcf7l2f/f (n=7) and Alb-Cre;Tcf7l2f/f (n=15) mice were fed an HCD for 22 weeks. At 21 weeks of HCD, Tcf7l2f/f mice were infected with Ad-gfp (n=7) and Alb-Cre;Tcf7l2f/f mice were infected with Ad-gfp (n=7) or Ad-Tcf7l2 (n=8). A schematic diagram showing the experimental design for generation of the chronic high-carbohydrate loading mouse model is shown alongside representative images of livers, epididymal white adipose tissues (eWAT), inguinal white adipose tissues (iWAT) and brown adipose tissues (BAT) from mice (e). Body, fat and lean weights (f). Percentages of fat mass, lean mass and free body fluid (g). Liver weight (h). Weights of eWAT, iWAT and BAT (i). (j-l) Six-week-old Tcf7l2f/f (n=7) and Alb-Cre;Tcf7l2f/f (n=8) mice were fed an HCD for 22 weeks. At 21 weeks of HCD, Tcf7l2f/f mice were infected with Ad-gfp (n=7) and Alb-Cre;Tcf7l2f/f mice were infected with Ad-gfp (n=4) or Ad-Tcf7l2 (n=4). A representative western blot showing TCF7L2, ACC and FAS protein levels in mouse liver (j; quantification data are presented in ESM Fig. 11d). Representative H&E and Oil Red O staining of liver sections (×20 magnification; scale bars, 200 μm; k). Hepatic TG levels (l). HSP90, heat shock protein 90. Key in (b) also applies to (c), (d), (h), (i) and (l). Data in (b–d), (f–i) and (l) are presented as mean±SEM. *p<0.05, **p<0.01, ***p<0.001, assessed by one-way ANOVA with Tukey’s post hoc test

References

    1. Jin T. Current understanding on role of the Wnt signalling pathway effector TCF7L2 in glucose homeostasis. Endocr Rev. 2016;37(3):254–277. doi: 10.1210/er.2015-1146. - DOI - PubMed
    1. Migliorini A, Lickert H. Beyond association: a functional role for Tcf7l2 in β-cell development. Mol Metab. 2015;4(5):365–366. doi: 10.1016/j.molmet.2015.03.002. - DOI - PMC - PubMed
    1. Shu L, Matveyenko AV, Kerr-Conte J, Cho JH, McIntosh CH, Maedler K. Decreased TCF7L2 protein levels in type 2 diabetes mellitus correlate with downregulation of GIP- and GLP-1 receptors and impaired beta-cell function. Hum Mol Genet. 2009;18:2388–2399. doi: 10.1093/hmg/ddp178. - DOI - PMC - PubMed
    1. Nguyen-Tu MS, Martinez-Sanchez A, Leclerc I, Rutter GA, da Silva Xavier G. Adipocyte-specific deletion of Tcf7l2 induces dysregulated lipid metabolism and impairs glucose tolerance in mice. Diabetologia. 2021;64(1):129–141. doi: 10.1007/s00125-020-05292-4. - DOI - PMC - PubMed
    1. Geoghegan G, Simcox J, Seldin MM, et al. Targeted deletion of Tcf7l2 in adipocytes promotes adipocyte hypertrophy and impaired glucose metabolism. Mol Metab. 2019;24:44–63. doi: 10.1016/j.molmet.2019.03.003. - DOI - PMC - PubMed

Publication types

MeSH terms