. 2023 Mar;119(2):392-406.
doi: 10.1002/jeab.831. Epub 2023 Feb 9.

Behavioral pharmacology of methocinnamox: A potential new treatment for opioid overdose and opioid use disorder

Affiliations

Behavioral pharmacology of methocinnamox: A potential new treatment for opioid overdose and opioid use disorder

David R Maguire et al. J Exp Anal Behav. 2023 Mar.

Abstract

Opioid overdose and opioid use disorder continue to be significant public health challenges despite the availability of effective medications and significant efforts at all levels of society. The emergence of highly potent and efficacious opioids such as fentanyl and its derivatives over the last decade has only exacerbated what was already a substantial problem. Behavioral pharmacology research has proven invaluable for understanding the effects of drugs as well as developing and evaluating pharmacotherapies for disorders involving the central nervous system, including substance abuse disorders. This paper describes a program of research characterizing a potent, selective, and long-lasting mu opioid receptor antagonist, methocinnamox, and evaluating its potential for treating opioid overdose and opioid use disorder. Studies in rodents and nonhuman primates demonstrate that methocinnamox prevents and reverses opioid-induced ventilatory depression and selectively blocks opioid self-administration. This work, taken together with rigorous in vitro and ex vivo studies investigating methocinnamox neuropharmacology, lays a solid foundation for the therapeutic utility of this potentially life-saving medication. Moreover, these studies demonstrate how rigorous behavioral pharmacological studies can be integrated in a broader drug discovery and development research program.

Keywords: behavioral pharmacology; methocinnamox; opioid use disorder; opioids; overdose.


Conflict of interest statement

CONFLICT OF INTEREST

David R. Maguire has no known conflict of interest to disclose; Charles P. France is co-holder of a patent for methocinnamox.

Figures

FIGURE 1
FIGURE 1
Prevention of the ventilatory-depressant effects of heroin. Minute volume (VE), normalized to a percentage of the control, is plotted as a function of normalized heroin dose for individual subjects, denoted as M1–M4. Dose X is the smallest dose that decreased VE to <70% of control, which ranged from 0.056 to 0.56 mg/kg across subjects. Heroin dose-effect curves were determined using a cumulative dosing procedure, with 15-min interinjection intervals, before (filled circles) or at various points after administration of 0.032 mg/kg naltrexone (top row) or 0.32 mg/kg MCAM (bottom row) administered subcutaneously (unfilled symbols). On Day 0, naltrexone was given 15 min prior to determination of the heroin dose-effect curve. Data are adapted and replotted with permission (Gerak, Maguire, Woods, et al., 2019).
FIGURE 2
FIGURE 2
Reversal of the ventilatory-depressant effects of heroin. Minute volume (VE), normalized to a percentage of the control, is plotted as a function of time since administration of saline or an antagonist for individual subjects, denoted as M1–M4. Time since the initial injection of heroin is indicated by the secondary abscissa labels in parentheses. Following a baseline period of at least 30 min, heroin was administered at a dose that consistently decreased VE to just below 70% of control (Dose X from Figure 1). Thirty minutes later, a second injection was given subcutaneously that was either saline (filled circles), 0.032 mg/kg naloxone (triangles, top row), or 0.1 mg/kg MCAM (diamonds, bottom row). Data are adapted and replotted with permission (Gerak, Maguire, Woods, et al., 2019).
FIGURE 3
FIGURE 3
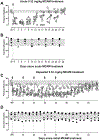
Effects of acute or repeated MCAM treatment on fentanyl or cocaine self-administration. The number of fentanyl or cocaine infusions obtained each session is plotted across sessions for individual subjects, indicated by different symbol shapes. Panels A and B show data from acute administration of 0.32 mg/kg MCAM; panels C and D show data from repeated administration of 0.32 mg/kg MCAM. For each pair of panels, fentanyl infusions are plotted in the top and cocaine infusions are plotted in the bottom. Lever pressing delivered an intravenous infusion according to a fixed-ratio 30 schedule with a 180-s postinfusion timeout; sessions lasted 90 min. Data points above “B” indicate data from the most recent fentanyl or cocaine session prior to acute or initial MCAM treatment. The shaded area indicates the range across subjects at baseline. Arrows and vertical dashed lines indicate when MCAM was administered 60 min prior to the session. Data are adapted and replotted with permission (Maguire et al., 2020).
FIGURE 4
FIGURE 4
Effects of daily MCAM treatment on fentanyl or cocaine self-administration. The number of fentanyl or cocaine infusions obtained each session is plotted across sessions for individual subjects, indicated by different symbol shapes. The top and bottom panels show the number of fentanyl and cocaine infusions obtained, respectively. Lever pressing delivered an intravenous infusion according to a fixed-ratio 30 schedule with a 180-s postinfusion timeout; sessions lasted 90 minutes. A unit dose of 0.32 μg/kg/infusion fentanyl was available for four subjects, whereas 1.0 μg/kg/infusion fentanyl was available for the fifth subject (indicated by upright triangles). For all subjects except one, a unit dose of 32 μg/kg/infusion cocaine infusion was available for self-administration. For one subject (inverted triangles), the unit dose of cocaine infusion was increased to 100 μg/kg/infusion beginning with day 12 of MCAM treatment. The break in the abscissa indicates when fentanyl dose-effect curves were redetermined during daily MCAM treatment (show in Figure 5). Data points above “B” indicate data from fentanyl or cocaine sessions immediately preceding daily treatment with 0.032 mg/kg MCAM administered 60 min prior to each session. The shaded area indicates the range across subjects at baseline. Arrows and vertical dashed lines indicate the first and last sessions with MCAM treatment. Data are adapted and replotted with permission (Maguire et al., 2020).
FIGURE 5
FIGURE 5
Fentanyl self-administration dose-effect curves from before, during, and following discontinuation of daily MCAM treatment. Fentanyl dose-effect curves determined before (unfilled squares), during (filled squares), and following discontinuation of (triangles) daily MCAM treatment are plotted for individual subjects, shown across panels. Redetermination of the dose-effect curve during daily MCAM began after 21 days of treatment (indicated by the break in the abscissa in Figure 4). Saline (data above “S”) or different unit doses of fentanyl were each available for at least three and not more than seven sessions; each data point shows the mean of the last three sessions with each unit dose. Data are adapted and replotted with permission (Maguire & France, 2022).
FIGURE 6
FIGURE 6
Hypothetical data showing shifts in self-administration dose-effect curves following administration of either a competitive or noncompetitive antagonist. These data show the inverted-U shaped function relating infusions of fentanyl obtained to the unit dose of drug, reflecting and increase and then decrease in infusions as the unit dose increases. Curves are plotted for fentanyl alone (dotted, gray lines) and following different doses of a competitive (Panels A and B) or noncompetitive (Panels C and D) antagonist (solid lines). Treatment with a competitive antagonist shifts the dose-effect curve progressively rightward in a parallel manner, resulting in an increase and then decrease in responding for a unit dose of fentanyl located, initially, along the descending limb of the curve (indicated by arrows). In contrast, treatment with a noncompetitive antagonist shifts the dose-effect curve rightward and then downward at sufficiently large doses.
FIGURE 7
FIGURE 7
Effects of acute MCAM treatment on self-administration of a large dose of fentanyl. The number of fentanyl infusions obtained is plotted across sessions since treatment with 0.32 mg/kg (filled triangles) or 3.2 mg/kg (unfilled triangles) MCAM. Data for individual subjects are shown in different panels. Lever pressing delivered an intravenous infusion of 3.2 μg/kg/infusion fentanyl according to a fixed-ratio 30 schedule with a 180-s postinfusion timeout; sessions lasted 90 min. Data points above “B” indicate infusions obtained immediately prior to MCAM treatment. The shaded area indicates the baseline range for across tests, and the vertical dashed line indicates the day on which an MCAM was administered 60 min prior to the session.
FIGURE 8
FIGURE 8
Effects of acute naltrexone treatment on self-administration of a large dose of fentanyl. Fentanyl infusions are plotted as a function of naltrexone pretreatment dose, administered subcutaneously 15 min prior to the session. Data above “S” indicate the average infusions obtained from the session immediately preceding a naltrexone test, during which saline was administered. Data for individual subjects are indicated by different symbol shapes.
FIGURE 9
FIGURE 9
Effects of acute MCAM treatment on choice between food and remifentanil. Percentage of remifentanil choice is plotted as a function of remifentanil dose under control conditions (diamonds) and at different points (unfilled symbols) following intravenous administration of either 0.32 mg/kg (top row) or 3.2 mg/kg (bottom row) MCAM. Data for individual subjects are shown across columns. Lever pressing delivered a 300-mg sucrose pellet or an infusion of remifentanil under a concurrent fixed-ratio 30 schedule with a 180-s postreinforcer timeout. Daily sessions comprised four blocks. Each block contained two forced trials (only one alternative was available each trial) followed by up to 10 choice trials in which both alternatives were available. Responding on one lever always delivered a sucrose pellet, whereas responding on the other lever always delivered an intravenous infusion of remifentanil. The dose of unit dose of remifentanil increased across blocks of the session. Sessions were conducted daily following MCAM administration; data are shown for sessions conducted 1 (triangles) and 4 (squares) days after MCAM. Data are adapted and replotted with permission (Maguire et al., 2019).
FIGURE 10
FIGURE 10
Time course of effects of acute MCAM treatment on choice between food and remifentanil. Data from the choice experiment described in Figure 9 were collapsed across blocks and plotted for the session immediately preceding (data above “C”) and for up to 8 sessions following administration of different doses of MCAM. The top row shows percentage of remifentanil choice, and the bottom row shows total choice trials completed. Data for individual subjects are shown across columns. Data are adapted and replotted with permission (Maguire et al., 2019).

Similar articles

Cited by

References

    1. Adams JU, Paronis CA, & Holtzman SG (1990). Assessment of relative intrinsic activity of mu-opioid analgesics in vivo by using beta-funaltrexamine. The Journal of Pharmacology and Experimental Therapeutics, 255(3), 1027–1032. - PubMed
    1. Ahmad FB, Cisewski JA, Rossen LM, & Sutton P. (2023). Provisional drug overdose death counts. National Center for Health Statistics. https://www.cdc.gov/nchs/nvss/vsrr/drug-overdose-data.htm
    1. Banks ML, & Negus SS (2017). Insights from preclinical choice models on treating drug addiction. Trends in Pharmacological Sciences, 38(2), 181–194. 10.1016/j.tips.2016.11.002 - DOI - PMC - PubMed
    1. Bateman JT, Saunders SE, & Levitt ES (2021). Understanding and countering opioid-induced respiratory depression. British Journal of Pharmacology, 1–16. 10.1111/bph.15580 - DOI - PMC - PubMed
    1. Blanco C, & Volkow ND (2019). Management of opioid use disorder in the USA: Present status and future directions. Lancet, 393(10182), 1760–1772. 10.1016/S0140-6736(18)33078-2 - DOI - PubMed

Publication types

MeSH terms