. 2023 Feb;55(2):401-412.
doi: 10.1038/s12276-023-00945-x. Epub 2023 Feb 9.

ERdj5 protects goblet cells from endoplasmic reticulum stress-mediated apoptosis under inflammatory conditions

Affiliations

ERdj5 protects goblet cells from endoplasmic reticulum stress-mediated apoptosis under inflammatory conditions

Hyunjin Jeong et al. Exp Mol Med. 2023 Feb.

Abstract

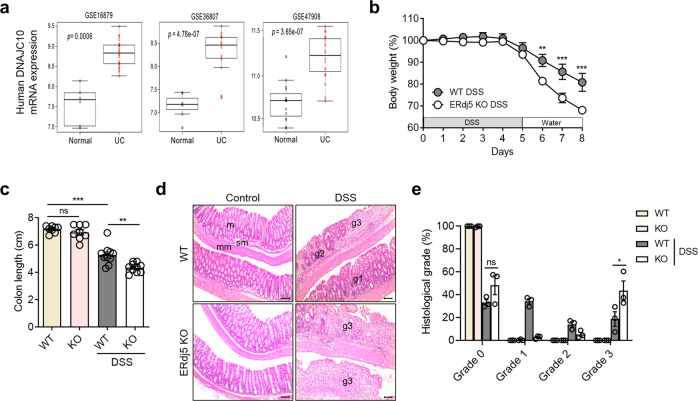
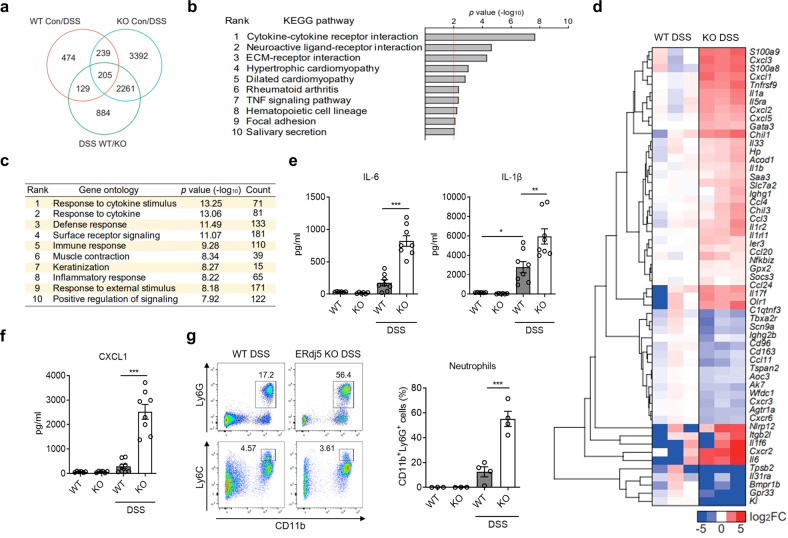
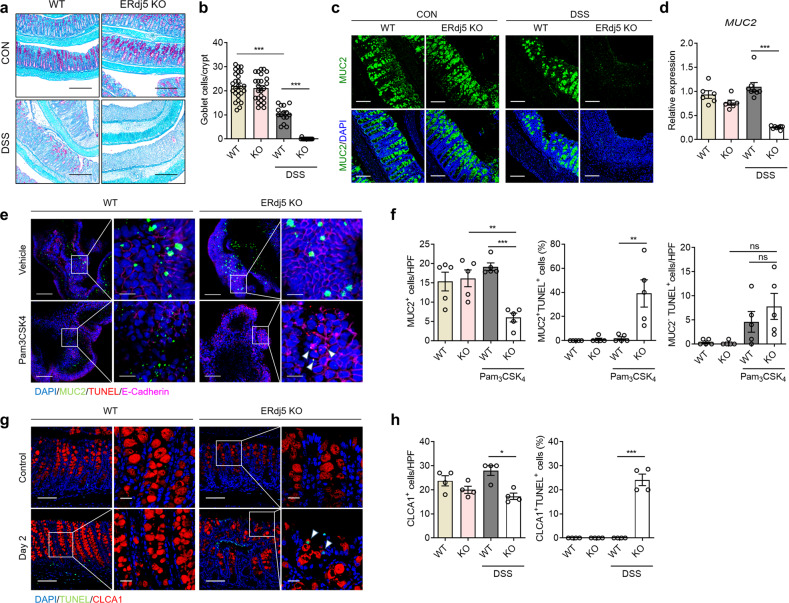
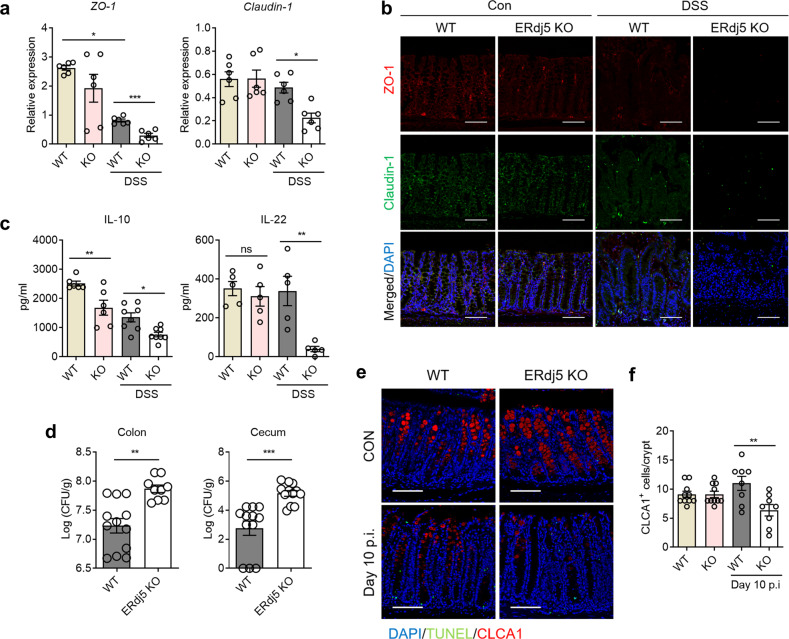
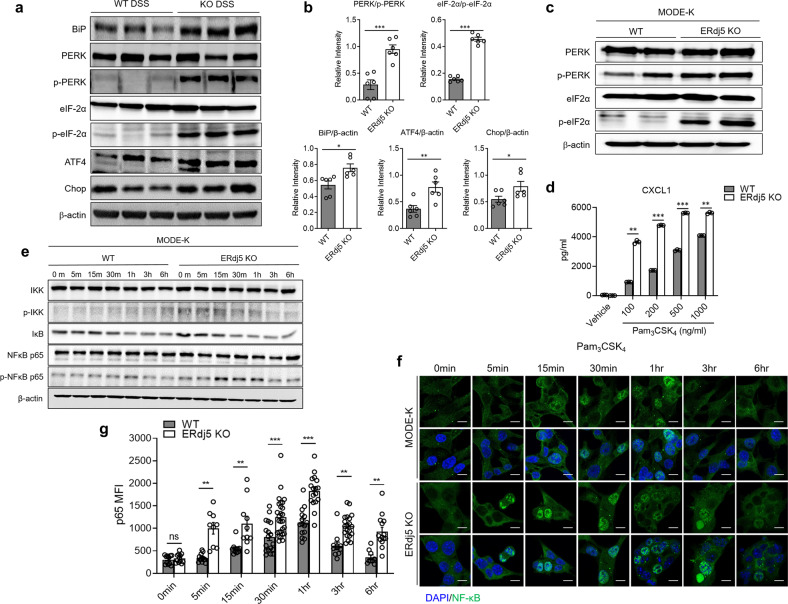
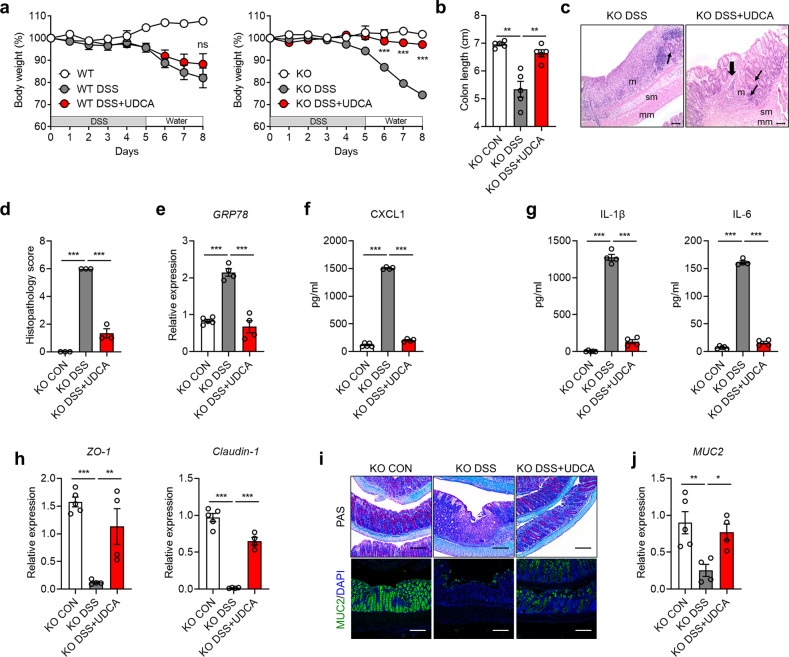
Endoplasmic reticulum stress is closely associated with the onset and progression of inflammatory bowel disease. ERdj5 is an endoplasmic reticulum-resident protein disulfide reductase that mediates the cleavage and degradation of misfolded proteins. Although ERdj5 expression is significantly higher in the colonic tissues of patients with inflammatory bowel disease than in healthy controls, its role in inflammatory bowel disease has not yet been reported. In the current study, we used ERdj5-knockout mice to investigate the potential roles of ERdj5 in inflammatory bowel disease. ERdj5 deficiency causes severe inflammation in mouse colitis models and weakens gut barrier function by increasing NF-κB-mediated inflammation. ERdj5 may not be indispensable for goblet cell function under steady-state conditions, but its deficiency induces goblet cell apoptosis under inflammatory conditions. Treatment of ERdj5-knockout mice with the chemical chaperone ursodeoxycholic acid ameliorated severe colitis by reducing endoplasmic reticulum stress. These findings highlight the important role of ERdj5 in preserving goblet cell viability and function by resolving endoplasmic reticulum stress.


Conflict of interest statement

The authors declare no competing interests.

Figures

Fig. 1
Fig. 1. ERdj5 deficiency exacerbates DSS-induced colitis in a murine model.
a ERdj5 (DNAJC10) mRNA expression levels in normal controls or patients with ulcerative colitis (UC) were analyzed in the public GEO database. be Mice were administered 2% DSS in drinking water for 5 days and subsequently switched to normal water (n = 8–10 per group). b Body weight. c Colon length on Day 8. d Representative histopathological features of the colon in H&E-stained sections (×100, scale bar: 100 µm); m, mucosa; sm, submucosa; mm, muscular layer; pathological grade (g1, g2, g3). e Measurement of the length with different grading scores of inflammation in the colon. The data are representative of three independent experiments, and the values are expressed as the mean ± SEM; **P < 0.01 and ***P < 0.001; ns, not significant. Two-way ANOVA followed by Bonferroni’s test for (b) and one-way ANOVA followed by Tukey’s test for (c).
Fig. 2
Fig. 2. RNA-seq reveals an altered gene expression profile for inflammation in the absence of ERdj5.
a Venn diagram. The number of differentially expressed genes (DEGs) from colon samples extracted from 8-week-old female WT or ERdj5-KO mice (n = 3 per group) treated with or without 2% DSS. b KEGG pathway analysis of DEGs in colon samples extracted from 8-week-old female WT or ERdj5-KO mice (n = 3 per group) treated with or without 2% DSS. Pathways with statistical significance (P > 0.01) are shown. c GO analysis of major signaling pathways identified by RNA sequencing using the DAVID bioinformatics database. The top 10 pathways based on P values are shown, along with the number of genes with the respective ontology. d Heatmap of the DEGs associated with inflammation. The log2 ratios of ERdj5 KO DSS/WT DSS are presented (blue, underexpression; red, overexpression). Values over 5 or under −5 were rounded. e Levels of IL-1β and IL-6 in colon homogenates (n = 6–8 per group). f Level of CXCL1 in colon homogenates (n = 6–8 per group). g Representative flow cytometric analysis of CD11b+Ly6G+ neutrophils and CD11b+Ly6C+ monocytes among pregated live CD45+IA-IE-CD11c- cells in the LP of the colon. The percentage of CD11b+Ly6G+ neutrophils is expressed as the mean ± SEM (n = 3–4 per group). *P < 0.05, **P < 0.01, ***P < 0.001; one-way ANOVA followed by Tukey’s test.
Fig. 3
Fig. 3. ERdj5 deficiency decreases mucin secretion and goblet cells in response to inflammatory signals.
a Periodic acid Schiff (PAS) staining of the colons of WT and ERdj5-KO mice (×100, scale bar 500 µm; n = 6 per group). b Goblet cell count per crypt in PAS images (n = 15–25 per group). c Representative immunofluorescence images of MUC2 (green) in colon tissues, with DAPI (blue) for nuclear staining (×200, scale bar 200 µm). d Level of MUC2 mRNA expression (n = 6–8 per group). e Representative immunofluorescence images of colonoids originating from WT or ERdj5-KO mice treated with vehicle or Pam3CSK4. MUC2 (green), TUNEL (red), E-cadherin (magenta), and DAPI (blue) (left panel, ×200 and right panel, ×800). f MUC2+ cell counts per high-power field (HPF) and the percentage of TUNEL-positive cells among MUC2+ and MUC2- cells determined in colonoid images (n = 5 per group). g Representative immunofluorescence images of colon tissues from WT or ERdj5-KO mice on Day 2 following DSS treatment. CLCA1 (red), TUNEL (green), and DAPI (blue) (left panel, ×200 and right panel, ×630). h CLCA1+ cell count per HPF and TUNEL-positive percentages among CLCA1+ cells from colon tissue images (n = 4 per group). e, g Scale bars correspond to 100 μm and 20 μm, respectively. The data are representative of three independent experiments, and the values are expressed as the mean ± SEM. *P < 0.05, **P < 0.01, ***P < 0.001; one-way ANOVA followed by Tukey’s test.
Fig. 4
Fig. 4. ERdj5 contributes to the maintenance of intestinal barrier integrity.
a Zo-1 and Cldn1 mRNA expression in the colon tissues of WT or ERdj5-KO mice treated with DSS (n = 6 per group). b Immunofluorescence images of colon tissue stained for the tight junction proteins ZO-1 (red) and Claudin-1 (green) (×200, scale bar 100 µm). c IL-10 and IL-22 expression in colon tissue homogenates (n = 5–8 per group). d Mice were infected with 2.5 × 108 CFU of C. rodentium. On Day 14 postinfection, CFUs in the colon and cecum were measured (n = 9–12 per group). e Representative immunofluorescence images of colon tissues from WT or ERdj5-KO mice 10 days after C. rodentium infection. CLCA1 (red), TUNEL (red), and DAPI (blue) (×200, scale bar 100 µm). f CLCA1+ cell counts per crypt of WT and ERdj5-KO mice in e (n = 10–12 per group). The data are representative of three independent experiments, and the values are expressed as the mean ± SEM. *P < 0.05, **P < 0.01, ***P < 0.001; one-way ANOVA followed by Tukey’s test for a, c, f and Student’s t test for d.
Fig. 5
Fig. 5. ERdj5 deficiency causes ER stress and inflammation mediated by NF-κB activation.
a Expression profile of ER stress-related proteins in the colons of WT or ERdj5-KO mice treated with DSS (n = 6 per group). b Relative band intensities are expressed as the mean ± SEM. c ER stress proteins in ERdj5-KO MODE-K cells altered by the CRISPR/Cas9 system. d The level of CXCL1 in ERdj5-KO MODE-K cells after Pam3CSK4 treatment (100, 200, 500, and 1000 ng/ml) for 6 h (n = 3 per group). e The protein expression of NF-κB pathway factors in MODE-K cells treated with Pam3CSK4 (1 µg/ml) for 0, 5, 15, 30, 60, 180, and 360 min. f Nuclear translocation of NF-κB/p65 in ERdj5-KO MODE-K cells at the indicated time points after Pam3CSK4 treatment (1 µg/ml). f Immunofluorescence image (×200, scale bar 10 µm). g The mean fluorescence intensity of NF-κB/p65 (green) is shown (n = 9~27 per group). The data are representative of three independent experiments, and the values are expressed as the mean ± SEM. *P < 0.05, **P < 0.01, ***P < 0.001; Student’s t test.
Fig. 6
Fig. 6. UDCA treatment ameliorates DSS-induced colitis in ERdj5-KO mice.
WT and ERdj5-KO mice were administered 2% DSS in drinking water for 5 days and subsequently provided normal water. The mice were orally administered 500 mg/kg UDCA daily (n = 3–5 per group). a Bodyweight. b Colon length. c Representative H&E-stained colon tissue images (×100, scale bar 100 µm). Thin arrows indicate hyperplasia in affected areas. Thick arrows indicate multifocal inflammatory cell infiltration; m, mucosa; sm, submucosa; mm, muscular layer. d Histological scoring. e GRP78 mRNA expression in colon tissues. f CXCL1, g IL-1 and IL-6 levels in colon homogenates. h Zo-1 and Cldn1 mRNA levels in colon tissues. i Representative PAS staining (×100) and MUC2 immunofluorescence (×200) images of the colon. Scale bar corresponds to 200 µm. j MUC2 mRNA expression. The data are representative of three independent experiments, and the values are expressed as the mean ± SEM. *P < 0.05, **P < 0.01, ***P < 0.001; ns, not significant; one-way ANOVA was followed by Tukey’s test.

References

    1. McCracken VJ, Lorenz RG. The gastrointestinal ecosystem: a precarious alliance among epithelium, immunity and microbiota. Cell. Microbiol. 2001;3:1–11. doi: 10.1046/j.1462-5822.2001.00090.x. - DOI - PubMed
    1. Liévin-Le Moal V, Servin AL. The front line of enteric host defense against unwelcome intrusion of harmful microorganisms: mucins, antimicrobial peptides, and microbiota. Clin. Microbiol. Rev. 2006;19:315–337. doi: 10.1128/CMR.19.2.315-337.2006. - DOI - PMC - PubMed
    1. Johansson ME, Hansson GC. Immunological aspects of intestinal mucus and mucins. Nat. Rev. Immunol. 2016;16:639–649. doi: 10.1038/nri.2016.88. - DOI - PMC - PubMed
    1. van Putten JPM, Strijbis K. Transmembrane Mucins: Signaling Receptors at the Intersection of Inflammation and Cancer. J. Innate Immun. 2017;9:281–299. doi: 10.1159/000453594. - DOI - PMC - PubMed
    1. Pelaseyed T, et al. The mucus and mucins of the goblet cells and enterocytes provide the first defense line of the gastrointestinal tract and interact with the immune system. Immunol. Rev. 2014;260:8–20. doi: 10.1111/imr.12182. - DOI - PMC - PubMed

Publication types

LinkOut - more resources