Multicenter Study
. 2023 Feb 9;14(1):723.
doi: 10.1038/s41467-023-36390-7.

Segmental motor recovery after cervical spinal cord injury relates to density and integrity of corticospinal tract projections

Affiliations
Multicenter Study

Segmental motor recovery after cervical spinal cord injury relates to density and integrity of corticospinal tract projections

Gustavo Balbinot et al. Nat Commun. .

Abstract

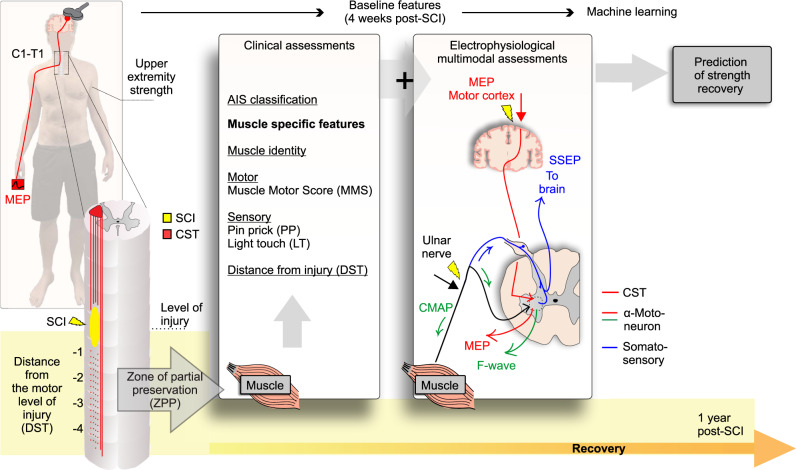
Cervical spinal cord injury (SCI) causes extensive impairments for individuals which may include dextrous hand function. Although prior work has focused on the recovery at the person-level, the factors determining the recovery of individual muscles are poorly understood. Here, we investigate the muscle-specific recovery after cervical spinal cord injury in a retrospective analysis of 748 individuals from the European Multicenter Study about Spinal Cord Injury (NCT01571531). We show associations between corticospinal tract (CST) sparing and upper extremity recovery in SCI, which improves the prediction of hand muscle strength recovery. Our findings suggest that assessment strategies for muscle-specific motor recovery in acute spinal cord injury are improved by accounting for CST sparing, and complement person-level predictions.


Conflict of interest statement

The authors declare no competing interests.

Figures

Fig. 1
Fig. 1. Participants included from the EMSCI Dataset.
EMSCI = European Multi-Center Study about Spinal Cord Injury, ISNCSCI = International Standards for Neurological Classification of Spinal Cord Injury, SCI = Spinal Cord Injury, w = Week, MEP = Motor Evoked Potential, SSEP = Somatosensory Evoked Potential, NCS = Nerve Conduction Studies.
Fig. 2
Fig. 2. Anatomical and injury characteristics hypothesized to be determinants of segmental muscle recovery.
Muscle identity may play a role due to variations in cortical representation and CST projections. Remaining spinal innervation after injury may be reflected in the muscle motor score (MMS), sensory scores in corresponding dermatomes (PP and LT), and electrophysiological assessments (MEP, SSEP). NCS may improve predictions by providing information about α-motoneuron damage. AIS grade and distance from injury further determine the capacity for neurorecovery. C = Cervical, T = Thoracic, SCI = Spinal Cord Injury, CST = Corticospinal Tract, AIS = American Spinal Cord Injury Association Impairment Scale, MEP = Motor Evoked Potential, SSEP = Somatosensory Evoked Potential, NCS = Nerve Conduction Studies, MMS = Muscle Motor Score, ZPP = Zone of Partial Preservation, DST = Distance from the motor level of injury, LT = Light Touch sensation, PP = Pin Prick sensation.
Fig. 3
Fig. 3. Strength recovery in upper limb muscles after cervical SCI.
a The median UEMS in AIS A-D indicates some recovery independent of the SCI severity. While UEMS at onset are similar in AIS A and AIS B at 1w–4w post-SCI the extent of recovery at 12w–48w is higher in AIS B. AIS C and D show different UEMS at onset and over time. b Statistical comparisons for the UEMS data in (a). c The distance between the motor level and the myotome (DST) was controlled in D–H. d–h In individuals classified as AIS A, the probability of the proximal muscles (i.e., elbow flexors, wrist extensors, and elbow extensors) achieving against gravity strength (MMS ≥ 3) was greater compared to hand muscles (i.e., finger flexors and abductors)—especially if the hand muscles are distant from the SCI (i.e., levels −3 and −4). Hand muscles also took longer to regain strength in individuals classified as AIS A. In participants classified as AIS D, the overall probability of upper limb muscles reaching MMS ≥ 3 was greater (≈97%) compared to AIS A ( ≈ 50.6%), with the lowest probabilities for hand muscles. The center line is the median in (a). In (b) the plotted p values are related to the sample sizes described in (a). Data are % of muscles with an MMS ≥ 3 in (d–h). The insets in (d–h) describe the motor level of injury (C1–C8). *p < 0.05, Multiple Mann–Whitney tests with multiple comparison adjustments using false discovery rate in (a, b) (two-sided), McNemar’s tests (two-sided) in (d–h). N = number of biologically independent samples, SCI = Spinal Cord Injury, AIS = American Spinal Cord Injury Association Impairment Scale, MMS = Muscle Motor Score, UEMS = Upper Extremity Motor Score.
Fig. 4
Fig. 4. Prediction of strength recovery after cervical SCI: the role of baseline MMS.
Baseline MMS is a good predictor of strength recovery at 1-year post-SCI for individuals with AIS D (high R2 values) but is in most cases a poor predictor for those with an AIS A/B/C. a Considering all AIS and muscles, the prediction of strength recovery using baseline MMS is poor (R2 = 0.148). b, c Individuals classified as AIS A or B show some degree of proportional recovery of upper limb muscles if the initial impairment is low, but strength recovery is constant or is inversely proportional if the initial impairment is high (especially for distal hand muscles). d In individuals classified as AIS C, proportional strength recovery is apparent for elbow flexors, wrist extensors, elbow extensors, and finger flexors. Proportional recovery is also evident for finger abductors if the initial impairment is low to mild (baseline MMS from 3 to 5) but is constant if the initial impairment is high (baseline MMS from 0 to 1). e Proportional strength recovery is evident for all muscles in individuals classified as AIS D. f Summary of the non-linear regression using random forest regressors indicates good prediction of strength recovery for all muscles of AIS D participants with a prediction error of ≈0.5 points. Although the prediction is fair to good for some of the proximal muscles in individuals with an AIS A/B/C, predicting late strength recovery solely based on the initial motor impairment is poor for distal hand muscles (R2 ≈ 0.1). Complex analysis using random forest regressor with 50% of the dataset for training and 50% for testing with 100 trees (estimators) in (a–e). Data are Mean ± SD in (f), bottom panel. In (f) the plotted R2 and prediction errors are related to the sample sizes described in (b–e). N = number of biological samples (please note that muscles from the left and right sides of the same individual are pooled in this analysis). SCI = Spinal Cord Injury, AIS = American Spinal Cord Injury Association Impairment Scale, MMS = Muscle Motor Score, ZPP = Zone of Partial Preservation.
Fig. 5
Fig. 5. Prediction of strength recovery after cervical SCI: the role of additional muscle-specific features.
The prediction of strength recovery displays a proximal-to-distal gradient in individuals with a sensorimotor complete lesion, where the strength recovery of distal hand muscles is hard to predict. a Supervised machine learning models: a three steps approach is utilized to understand the predictive factors for segmental strength recovery after cervical SCI. b We corroborate the importance of AIS and MMS in predicting recovery after SCI with a PR AUC of ≈0.87 and ROC AUC ≈ 0.69 (see Supplementary Table 3 for feature importance in each model). c AIS-specific models indicate it is harder to predict strength recovery in AIS A/B, compared to AIS C/D. d The addition of muscle identity as a feature does not increase the prediction performance of the AIS-specific models. e Muscle-specific models indicate a proximal to distal gradient, where the strength recovery of distal hand muscles is harder to predict compared to the proximal muscles. f In individuals classified as AIS A, the prediction of strength recovery displays a good performance for elbow flexors, a moderate performance is evident for wrist and elbow extensors, but the prediction of strength recovery is poor for hand muscles. The prediction of strength recovery is good for elbow flexors and wrist extensors but moderate for elbow extensors and poor for the hand muscles in participants classified as AIS B. In individuals classified as AIS C, the prediction is good for all muscles, except for finger abductors. Prediction of strength recovery in participants classified as AIS D shows good performance for all muscles. g, h Note that the muscle-specific models must be interpreted with caution because of the imbalanced datasets. AIS C/D and proximal muscles are trained with a predominance of muscles from the positive class (‘Recovery’ class), thus, performing poorly in classifying the negative class (‘No recovery’ class). Complex analysis using random forest classifier with leave-one-muscle-out cross-validation. AIS = American Spinal Cord Injury Association Impairment Scale, AUC = Area Under the Curve, MMS = Muscle Motor Score, DST = Distance from the motor level of injury, LT = Light Touch sensation, PP = Pin Prick sensation, PR = Precision-Recall, ROC = Receiver Operating Characteristic.
Fig. 6
Fig. 6. Prediction of strength recovery after cervical SCI: measures of spinal cord function (CST and LMN) integrity increase the classification performance of strength recovery of distal hand muscles in individuals with an AIS A/B/C.
a Supervised machine learning models: a fourth step is utilized to understand the predictive factors for strength recovery in finger abductor muscles in AIS A/B/C. b Electrophysiological multimodal assessments of MEP, SSEP, and NCS of the distal muscles of the upper limb (finger abductors: abductor digiti minimi). MEP amplitude and latency at the abductor digit minimi muscle was used to quantify the CST and LMN integrity (red line). SSEP was measured over the scalp after stimulation of the ulnar nerve using needle electrodes (blue lines). Ulnar nerve stimulation was also used during the NCS to measure F-waves and CMAP at the abductor digit minimi (green line). c–e PR and ROC curves indicate that the overall classification performance assessed by the AUC is increased for the MEP and SSEP subgroups. The most important electrophysiological features are MEP amplitude, SSEP amplitude, and CMAP amplitude (data not shown). f Only the addition of the MEP features afforded a significant increase in the accuracy of the classification (p = 0.015). Data are Mean ± SEM in (f) to improve visualization. Complex analysis with random forest classifier using leave-one-muscle-out cross-validation in (c–f). In (f) the plotted accuracies are related to the sample sizes described in (c–e). N = number of biological samples (please note that muscles from the left and right sides of the same individual are pooled in this analysis). *p < 0.05, McNemar’s test (two-sided) in (f). AIS = American Spinal Cord Injury Association Impairment Scale, AUC = Area Under the Curve, MMS = Muscle Motor Score, LT = Light Touch sensation, MEP = Motor Evoked Potential, CST = Corticospinal Tract, DST = Distance from the motor level of injury, SSEP = Somatosensory Evoked Potential, NCS = Nerve Conduction Studies, CMAP = Compound Muscle Action Potential, PR = Precision-Recall, ROC = Receiver Operating Characteristic.
Fig. 7
Fig. 7. Corticospinal tract (CST) and LMN integrity in the abductor digiti minimi muscle.
a In AIS A/B/C, finger abductor muscles with an MEP display limited motor recovery 1-year after SCI compared to (b) muscles with the presence of an MEP (MEP+) (yellow, above the hashed white line), including muscles with absent MMS at baseline (rightmost part of the heatmap). c The binary classification of MEP+ muscles that shows strength recovery or not was used to cluster the baseline MEP amplitude. This analysis indicates that higher MEP amplitudes were associated with increased strength recovery (p < 0.0001). d The strength recovery of finger abductors (Δ MMS) is accompanied by changes in MEP amplitude (Δ MEP amplitude) throughout the natural recovery process. e–h Conversely to MEP, the presence of CMAP at baseline is not strongly associated with motor recovery of the finger abductor muscles 1-year post-SCI in AIS A/B/C. i–k In a subgroup of individuals where both MEP and NCS studies were conducted, it is evident that muscles with an MEP+ at baseline and with strength recovery 1 year after SCI also show greater CMAP intensities at baseline. Data are Mean + SEM in (c, g, j, k) to improve visualization. In (c, g, j–k) the plotted amplitudes are related to the sample sizes described in (b, f, i) respectively. N = number of biological samples (please note that muscles from the left and right sides of the same individual are pooled in this analysis). *p < 0.05, Mann–Whitney tests (two-sided) in (c, g, j, k) Spearman correlations in (d, h). MMS = Muscle Motor Score, AIS = American Spinal Cord Injury Association Impairment Scale, CMAP = Compound Muscle Action Potential, MEP = Motor Evoked Potential. Outliers were left out of (d) (5 data points), (h) (2 data points) to improve visualization.
Fig. 8
Fig. 8. CST and LMN integrity (as assessed by MEP) indicates impairment and recovery after SCI: individuals classified as AIS A and impaired spinal cord function (CST and LMN integrity) display limited motor recovery.
a Cervical SCI (yellow) may damage spinal cord structures and affect the spinal cord functionality below the level of injury with respective weakness of the innervated muscles. Volitional strength and strength recovery are dependent on the residual spinal cord function (red), here quantified by the residual muscle strength and MEP amplitude. b Individuals with absent MEP (MEP) display greater damage to the descending pathway (evidenced by the greater initial impairment) and limited recovery of motor function of the spinal cord (p = 0.492). The presence of an MEP (MEP+) indicates variable levels of spinal cord or LMN damage and recovery (p < 0.0001). c Individuals with an MEP at baseline were predominantly classified as AIS A, and individuals with an MEP+ predominantly classified as AIS D. d Strength recovery from baseline (4 weeks) to 48 weeks after SCI is shown as change in the total motor score of the ISNCSCI. For individuals classified as AIS B/C/D (blue circles), recovery is proportional to the available improvement. In AIS D, the regression represents the relationship between available (x) and actual (y) improvement (y = 0·59x, p < 0.0001). No relationship exists between available and actual improvement for sensorimotor complete lesions (AIS A, p = 0.662; red circles). *p < 0.05 simple linear regression (slope is significantly non-zero). Two individuals were excluded from the total MEP sample (203) because of absent AIS classification at baseline in (b). Seven individuals were excluded from the total sample (748) because of absent AIS classification at baseline in (d). SCI = Spinal Cord Injury, CST = Corticospinal Tract, AIS = American Spinal Cord Injury Association Impairment Scale, MEP = Motor Evoked Potential.

References

    1. Ahuja CS, et al. Traumatic spinal cord injury. Nat. Rev. Dis. Prim. 2017;3:17018. - PubMed
    1. Snoek GJ, Ijzerman MJ, Hermens HJ, Maxwell D, Biering-Sorensen F. Survey of the needs of patients with spinal cord injury: Impact and priority for improvement in hand function in tetraplegics. Spinal Cord. 2004;42:526–532. - PubMed
    1. Fawcett JW, et al. Guidelines for the conduct of clinical trials for spinal cord injury as developed by the ICCP panel: Spontaneous recovery after spinal cord injury and statistical power needed for therapeutic clinical trials. Spinal Cord. 2007;45:190–205. - PubMed
    1. Hupp M, Pavese C, Bachmann LM, Koller R, Schubert M. Electrophysiological Multimodal Assessments Improve Outcome Prediction in Traumatic Cervical Spinal Cord Injury. J. Neurotrauma. 2018;35:2916–2923. - PubMed
    1. Khorasanizadeh MH, et al. Neurological recovery following traumatic spinal cord injury: A systematic review and meta-analysis. J. Neurosurg. Spine. 2019;30:683–699. - PubMed

Publication types