. 2023 Feb 9;14(1):709.
doi: 10.1038/s41467-023-36148-1.

Adipocyte-derived extracellular vesicles increase insulin secretion through transport of insulinotropic protein cargo

Affiliations

Adipocyte-derived extracellular vesicles increase insulin secretion through transport of insulinotropic protein cargo

Konxhe Kulaj et al. Nat Commun. .

Abstract

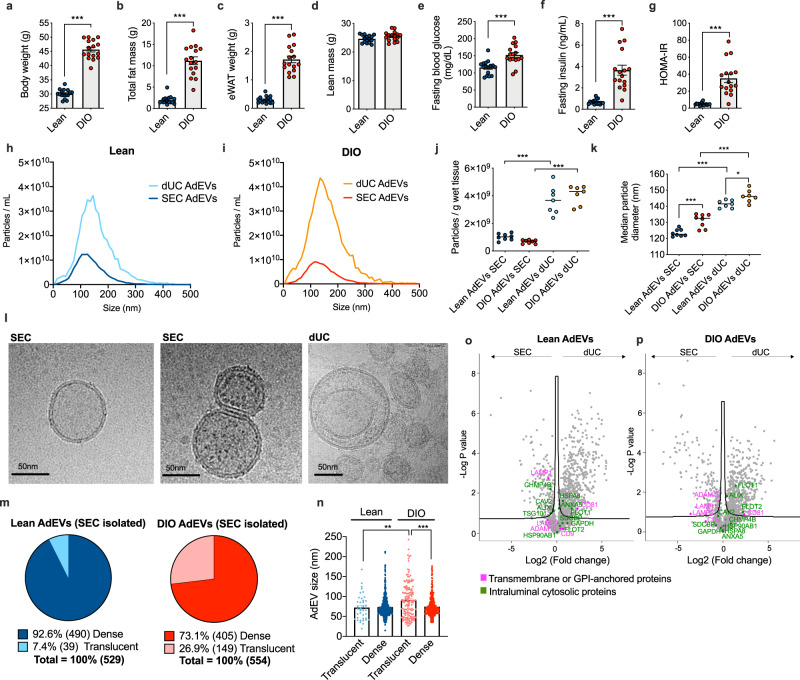
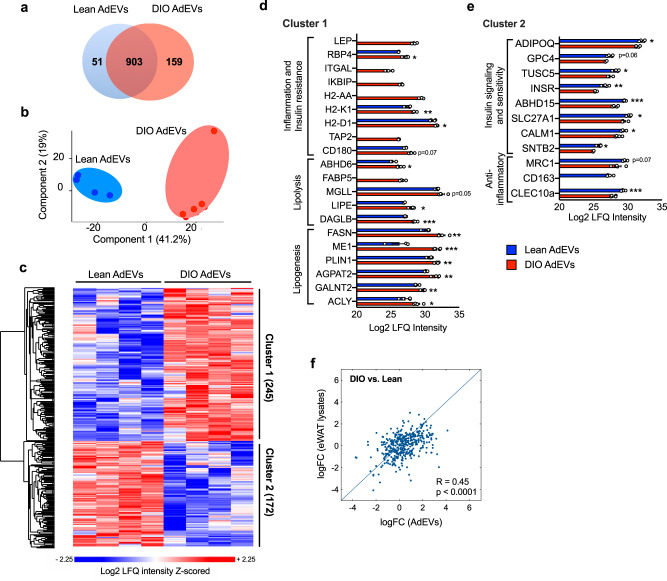
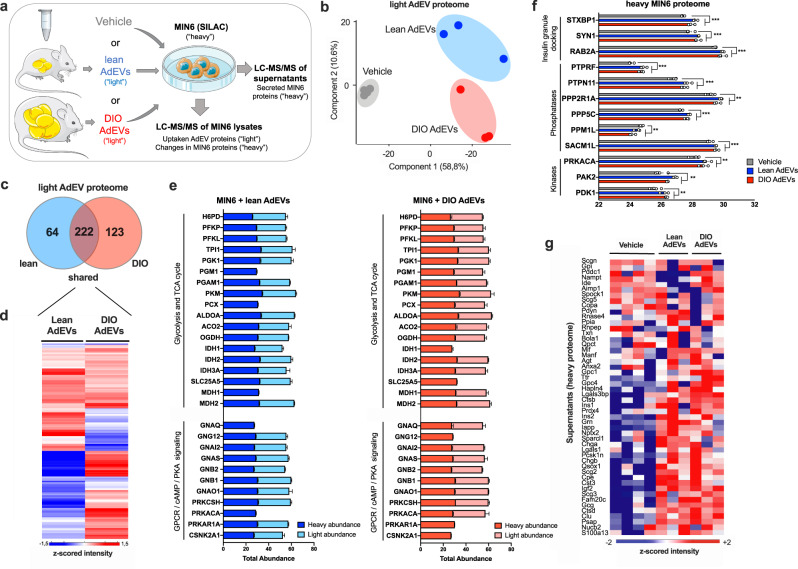
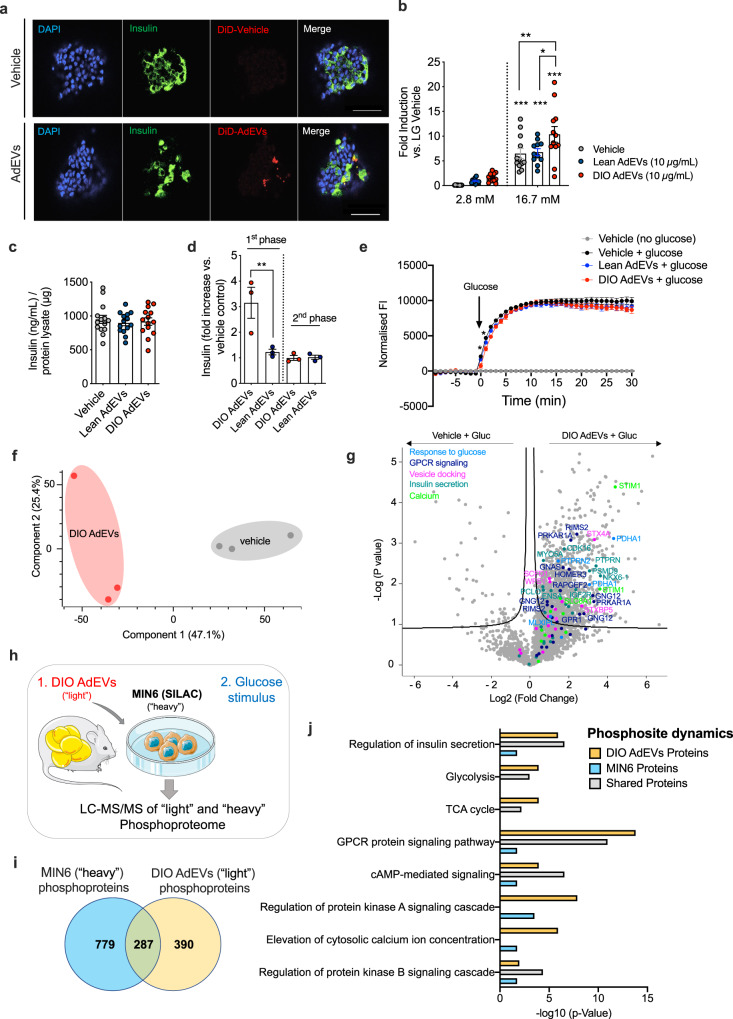
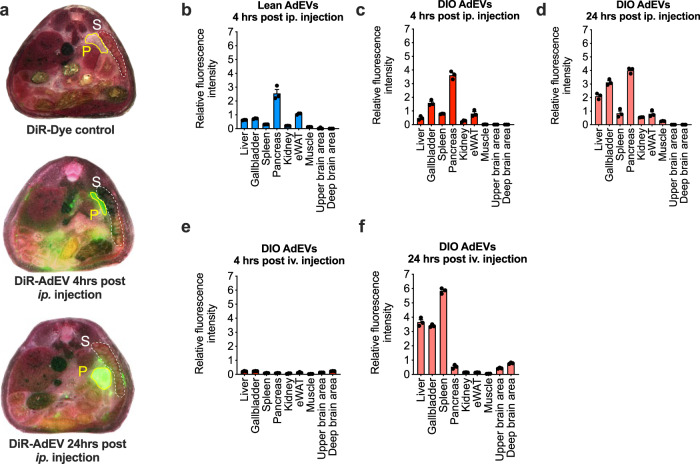
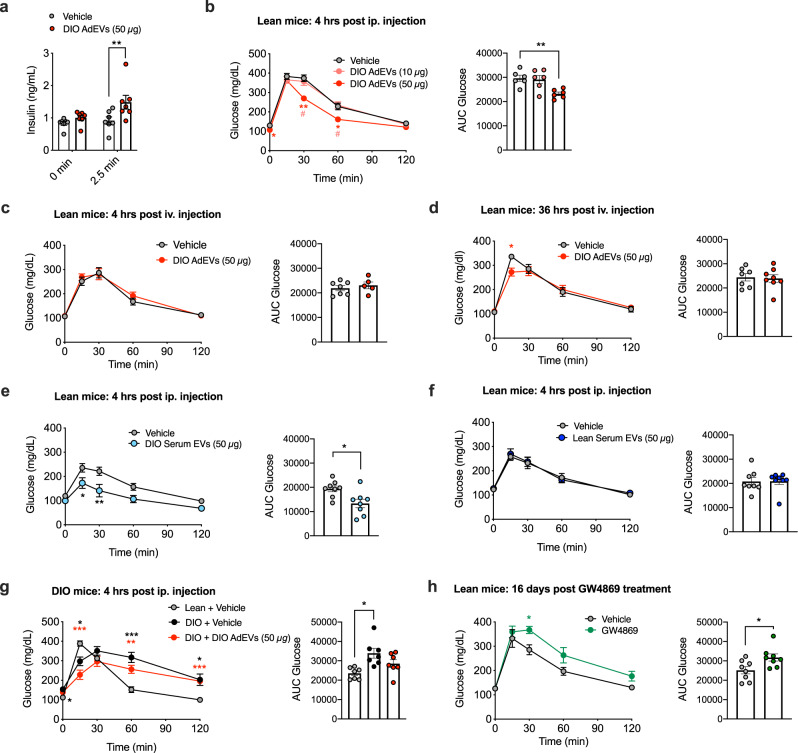
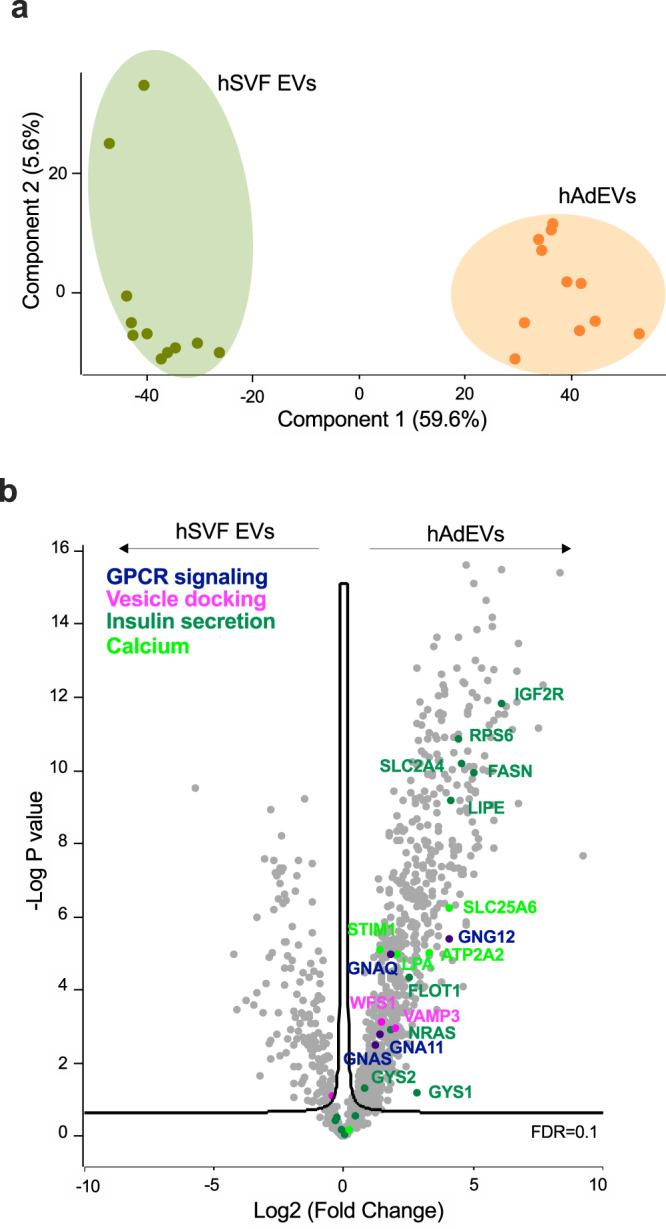
Adipocyte-derived extracellular vesicles (AdEVs) are membranous nanoparticles that convey communication from adipose tissue to other organs. Here, to delineate their role as messengers with glucoregulatory nature, we paired fluorescence AdEV-tracing and SILAC-labeling with (phospho)proteomics, and revealed that AdEVs transfer functional insulinotropic protein cargo into pancreatic β-cells. Upon transfer, AdEV proteins were subjects for phosphorylation, augmented insulinotropic GPCR/cAMP/PKA signaling by increasing total protein abundances and phosphosite dynamics, and ultimately enhanced 1st-phase glucose-stimulated insulin secretion (GSIS) in murine islets. Notably, insulinotropic effects were restricted to AdEVs isolated from obese and insulin resistant, but not lean mice, which was consistent with differential protein loads and AdEV luminal morphologies. Likewise, in vivo pre-treatment with AdEVs from obese but not lean mice amplified insulin secretion and glucose tolerance in mice. This data suggests that secreted AdEVs can inform pancreatic β-cells about insulin resistance in adipose tissue in order to amplify GSIS in times of increased insulin demand.


Conflict of interest statement

The authors declare no conflict of interest related to this study.

Figures

Fig. 1
Fig. 1. Comparative assessment of AdEVs isolated by dUC or SEC.
Male lean and diet-induced obese (DIO) C57BL/6 J mice (n = 16 mice, 24–26 weeks of age, 16 weeks of feeding) were assessed for a body weight, b fat mass, c epididymal white adipose tissue (eWAT) mass, d lean mass, e fasting glucose, f fasting insulin, and g HOMA-IR values. hk Nanoparticle Tracking Analysis (NTA) of adipocyte-derived extracellular vesicles (AdEVs, n = 7–8 biological replicates from two different EV isolation experiments) with size distributions of AdEVs from h lean and i DIO mice, j numbers of particles per gram wet tissue and k median particle diameters of the isolated EVs. l Representative cryo-TEM images from two independent AdEVs isolations using size exclusion chromatography (SEC) with translucent (left) and dense (middle) lumen or by differential ultracentrifugation (dUC) (right image). m Cryo-TEM-determined dense/translucent percentage, n median AdEV diameter of dense and translucent AdEVs. op LC-MS/MS analysis of the protein abundance of EV markers listed in the MISEV guideline. Comparison of EV markers in SEC- and dUC-isolated AdEVs from o lean and p DIO mice (n = 4 independent AdEV replicate samples. Each AdEV sample was isolated from visceral fat pads pooled from 5 DIO or 10 lean male 6–8 months old C57BL/6 J mice subjected to 4–6 months of HFD or chow). ap Data are presented as mean values ± SEM, asterisks indicate *P < 0.05, **P < 0.01, ***P < 0.001. ag Significance was determined by unpaired two-tailed t-tests, j, k, n One-Way ANOVA with Sidak’s post-test, or o, p One-Way ANOVA with a false discovery rate (FDR) of 0.1. Exact P values are (ab, f, g, dietary effects) P < 0.0001, e P = 0.0003, (j isolation methods) P < 0.0001, k P < 0.0001 for all comparisons except for P = 0.0004 for lean AdEVs SEC vs. DIO AdEVs SEC and P = 0.390 for lean AdEVs dUC vs. DIO AdEVs dUC. Exact P values for EV size and lumina morphology are n P = 0.0011 (AdEV size of lean translucent vs. DIO translucent) and P < 0.0001 (AdEV size of DIO translucent vs. DIO dense).
Fig. 2
Fig. 2. AdEV protein cargo in lean and DIO mice.
AdEVs from lean and DIO mice (n = 4 independent AdEV replicate samples. Each AdEV sample was isolated from pooled visceral fat pads of 5 DIO or 10 lean male 6-8 months old C57BL/6 J mice subjected to 4-6 months of HFD or chow) were subjected to LC–MS/MS-based proteomics. a Venn Diagram and b principal component analysis (PCA) of proteins identified in lean and/or DIO AdEVs. c Heatmap of z-scored protein intensities for all uncovered proteins (ANOVA, FDR < 0.01), and d, e average Log2 LFQ intensities (±SEM) of selected proteins with different abundance in lean and DIO AdEVs. d Cluster 1: proteins involved in inflammation, insulin resistance, lipolysis and lipogenesis; e Cluster 2: proteins involved in anti-inflammatory responses, insulin signaling and sensitivity. f Correlation of log Fold Change (logFC) as derived from the difference (DIO vs. lean) in the expression levels of 371 eWAT lysates and AdEV proteins (Pearson correlation coefficient is 0.4520). d, e Data are presented as mean values ± SEM, asterisks indicate *P < 0.05, **P < 0.01, ***P < 0.001. Significance was determined by two-sample t-tests with a permutation-based FDR set to 0.1 d, e. Exact P values for Log2 LFQ Intensity differences between lean AdEVs vs DIO AdEVs are d P = 0.015165 (RBP4), P = 0.00761 (H2-K1), P = 0.0405 (H2-D1), P = 0.0747 (CD180), P = 0.0247 (ABHD6), P = 0.0545 (MGLL), P = 0.0261 (LIPE), P = 0.000101 (DAGLB), P = 0.00279 (FASN), P = 0.000471 (ME1), P = 0.00485 (PLIN1), P = 0.00239 (AGPAT2), P = 0.00352 (GALNT2), P = 0.0139 (ACLY) and e P = 0.0365 (ADIPOQ), P = 0.0657 (GPC4), P = 0.04802 (TUSC5), P = 0.0015 (INSR), P = 0.000719 (ABHD15), P = 0.0331 (SLC27A1), P = 0.0383 (CALM1), P = 0.0179 (SNTB2), P = 0.0713 (MRC1), P = 0.000958 (CLEC10a). The exact P value for correlation of log (Fold Change) of AdEVs vs. log (Fold Change) of eWAT lysates is P < 0.0001.
Fig. 3
Fig. 3. AdEV-mediated protein transfer into MIN6 cells.
Proteomics of SILAC-labeled MIN6 cells treated with PBS (Vehicle) or AdEVs from lean or DIO mice (n = 3, biologically independent AdEV samples, each isolated from pooled visceral fat pads of 5 male C57BL/6 J DIO mice, 6–8 months of age subjected to 4–6 months of HFD or chow, n = 4 vehicle treated control samples). a Experimental setup. b PCA for “light” unlabeled proteins, and c Venn diagram representing the number of distinct vs. shared “light” unlabeled proteins transferred via lean or DIO AdEVs into MIN6 cells. d Heatmap for the median of z-scored protein intensities for all shared AdEV-derived “light” proteins in MIN6 cells following subtraction of the median intensities of the vehicle group (baseline subtraction). e Total abundances of “light” AdEV-derived proteins transferred into MIN6 cells via exposure to AdEVs from lean (light blue) or DIO (light red) mice (baseline-subtracted), or “heavy” proteins of the SILAC-treated host cells after treatment with lean (dark blue) or DIO (dark red) AdEVs. Proteins were clustering in different pathways, including glycolysis/TCA cycle and G-protein-coupled receptor (GPCR)/cyclic adenosine monophosphate (cAMP)/protein kinase A (PKA) signaling. f AdEV-induced changes of “heavy” cellular MIN6 proteins involved in insulin secretion. g Analysis of “heavy” MIN6 protein components of insulin granules secreted into the supernatant. d, e Data are presented as mean values ± SEM. Asterisks indicate *P < 0.05, **P < 0.01, ***P < 0.001. Significance was determined by two-sided t-tests with a permutation- based false discovery rate (FDR) of 0.1. Exact P values of AdEV treatment vs. vehicle are f P = 0.000348 (STXBP1), P = 0.001438 (SYN1), P = 0.00115 (RAB2A), P = 0.000102 (PTPRF), P = 0.000542 (PTPN11), P = 0.00616 (PPP2R1A), P = 0.000312 (PPP5C), P = 0.0133 (PPM1L), P = 0.000698 (SACM1L), P = 0.0105 (PRKACA), P = 0.00716 (PAK2) and P = 0.00353 (PDK1). The graphic in a was compiled using elements provided by Servier Medical Art (https://smart.servier.com).
Fig. 4
Fig. 4. AdEVs from DIO mice enhance GSIS in pancreatic β-cells.
Primary murine islets for experiments ad were isolated from male C57BL/6 mice (16–18 weeks of age). AdEVs were isolated from male C57BL/6 J DIO mice (aj: 4–6 months of HFD) or b from age and sex matched lean recipient C57BL/6 J mice. a Representative laser scanning confocal microscopy images of murine pancreatic islets after treatment with DiD-vehicle control (upper panel) or 10 µg of DiD-labeled AdEVs isolated from fat pads of DIO mice (lower panel). Scale bars: 50 µm. Nuclear staining via DAPI (blue), β-cell staining via anti-insulin antibody (green). b GSIS and c total insulin content in murine islets exposed to vehicle, lean or DIO AdEVs (10 µg/mL) followed by low glucose (LG) 2.8 mM and 16.7 mM glucose (n = 11–12 wells with primary murine islets treated with AdEVs from lean mice (n = 11 biologically independent samples), DIO mice (n = 12 biologically independent samples) from three independent isolations) or vehicle n = 12. d Dynamic islet perfusion assay in murine islets. Box plots represent the area under the curve of the first- and second phase of insulin secretion, expressed as fold increase vs. vehicle control (n = 3 biologically independent samples). e Real-time monitoring of glucose uptake into MIN6 cells expressing glucose sensitive Green Glifon600 and pretreated for 6 hrs with vehicle or AdEVs from lean or DIO mice (n = 4 biologically independent samples). Data represent baseline corrected fluorescence intensities (FI). f PCA and g Volcano Plot (ANOVA, FDR = 0.1) of MIN6 phosphoproteomes 15 min after switching from low to high glucose. Cells were pretreated with DIO AdEVs or vehicle for 6 hrs. hj Independent replication experiment with SILAC-labeled and DIO AdEV-pretreated MIN6 cells. h experimental setup, i Venn diagram of significant phosphosite changes for heavy MIN6, light AdEV-derived proteins, or both after a glucose stimulus (FDR = 0.05). j Bar diagram of enrichment analysis (two-sided Fisher’s Exact Test, FDR = 0.005) of MIN6 and AdEV-specific phosphosite changes related to pathways involved in insulin secretion. Significance levels for the different enrichment classes are displayed as -log10 p-values. be Data are presented as mean values ± SEM. Asterisks indicate *P < 0.05, **P < 0.01, ***P < 0.001. Significance was determined by b two-way ANOVA and Tukey’s multiple comparisons test or d ordinary one-way ANOVA and Sidak’s multiple comparisons test. Exact P values are b P = 0.0047 for DIO AdEV treatment vs. vehicle at the 16.7 mM glucose condition; c P = 0.011 for the comparison of lean AdEV vs. DIO AdEV treatment and d P = 0.0025. e For exact p-values at individual time points see the data source files. The graphic in h was compiled using elements provided by Servier Medical Art (https://smart.servier.com).
Fig. 5
Fig. 5. Biodistribution of AdEVs in mice.
a Representative cross-sections of multiscale and multispectral images of whole cryo-sliced male lean C57BL/6 J mice (11 to 16 weeks of age) after ip. injection with DiR vehicle control (upper panels) or DiR-labeled AdEVs DIO mice (middle and lower panel). Cross-sections show the pancreas (P) and spleen (S). bf Relative quantifications of fluorescence intensities in target organs of the recipient mice treated with DiR-labeled AdEVs isolated from b lean or cf DIO male C57BL/6 J mice, b, c 4 hrs or d 24 hrs, after intraperitoneal (ip.) injection, as well as e 4 hrs, or f 24 hrs after intravenous iv. injection. In each experimental setup, three representative slices from n = 2 independently AdEV-injected mice were analyzed. Data are presented as mean values ± SEM.
Fig. 6
Fig. 6. Glucoregulatory effects of AdEVs in mice.
DIO AdEVs were isolated from male C57BL/6 J DIO mice subjected to HFD for 4–6 months ad, g. All recipient mice ag were male C57BL/6 J mice. a Insulin secretion in mice (12 weeks of age, n = 7 mice) at baseline and 2.5 min after glucose stimulation following a 4 hrs pretreatment with vehicle or 50 μg DIO AdEVs. bh Glucose excursions (left panels) and corresponding area under curve (AUC, right panels) values following an b ipGTT in lean mice, 4 hrs after ip. pretreatment with vehicle vs. 10 or 50 μg of DIO AdEVs (n = 6 mice, 12 weeks of age), c, d ipGTT in lean mice, 4 hrs (c: n = 7 vehicle treated mice, n = 5 AdEV treated mice) or 36 hrs (d: n = 7 vehicle treated mice, n = 8 AdEV treated mice) after iv. pretreatment with vehicle vs. 50 μg of DIO AdEVs. e, f Glucose excursions and AUCs in lean mice 4 hrs after pre-treatment with vehicle or 50 μg of serum EVs isolated from 4-6 months old male C57BL/6 J DIO e or lean mice f (n = 8 mice in both experiments). g ipGTT in DIO recipient mice (3 months HFD, average body weight 45.5 g) and age-matched lean mice (average body weight 32.1 g), 4 hrs after ip. pretreatment with vehicle vs. 50 μg of DIO AdEVs (n = 7 mice). h ipGTT in lean 30-weeks-old male C57BL/6 J mice injected daily for 16 days with the small molecule exosome secretion inhibitor GW4869 (1 mg/kg), or vehicle (5% DMSO in 0.9% NaCl), n = 8 mice. d, Data are presented as mean values ± SEM. Asterisks indicate *P < 0.05, **P < 0.01, ***P < 0.001. Significance was determined by two-way ANOVA and Sidak’s multiple comparisons test or unpaired two-sided t-test for AUC values. Exact P values of treatment vs. control are a adjusted P = 0.01, b P = 0.0247 (vehicle vs. 50 μg DIO AdEVs, 0 min), P = 0.002 (vehicle vs. 50 μg DIO AdEVs, 30 min), P = 0.0144 (10 μg DIO AdEVs vs. 50 μg DIO AdEVs, 30 min), P = 0.0289 (vehicle vs. 50 μg DIO AdEVs, 60 min), P = 0.0193 (10 μg DIO AdEVs vs. 50 μg DIO AdEVs, 60 min) and P = 0.0071 (for AUC Glucose), d P = 0.0275, e P = 0.0272 (15 min), P = 0.0025 (30 min) and P = 0.0127 (for AUC Glucose), g P = 0.0348 (lean + vehicle vs. DIO + vehicle, 0 min), P = 0.0143 (lean + vehicle vs. DIO + vehicle, 15 min), P = 0.0005 (lean + vehicle vs. DIO + 50 μg DIO AdEVs, 15 min), P = 0.0009 (lean + vehicle vs. DIO + vehicle, 60 min), P = 0.0043 (lean + vehicle vs. DIO + 50 μg DIO AdEVs, 60 min), P = 0.0271 (lean + vehicle vs. DIO + vehicle, 120 min), P = 0.0001 (lean + vehicle vs. DIO + 50 μg DIO AdEVs, 120 min) and P = 0.017 (for AUC Glucose), h P = 0.032 and P = 0.0238 (for AUC Glucose).
Fig. 7
Fig. 7. Characterization of human AdEVs and stromal vesicular fraction (SVF) derived EV proteins.
EVs isolated from the stromal vascular fraction (SVF) and adipocyte fraction of liposuction samples from 11 self-reported female human subjects were analyzed by LC-MS/MS a PCA space differences and b Volcano plot displaying the significantly enriched expression of proteins involved in GPCR and calcium signaling, vesicle docking and insulin secretion in human adipocyte EVs (hAdEVs) compared to their expression in human SVF EVs. Significance was determined by two-samples t-test with 0.1 FDR.

References

    1. Thery C, et al. Minimal information for studies of extracellular vesicles 2018 (MISEV2018): a position statement of the International Society for Extracellular Vesicles and update of the MISEV2014 guidelines. J. Extracell. Vesicles. 2018;7:1535750. - PMC - PubMed
    1. Todkar K, et al. Selective packaging of mitochondrial proteins into extracellular vesicles prevents the release of mitochondrial DAMPs. Nat. Commun. 2021;12:1971. - PMC - PubMed
    1. D’Acunzo P, et al. Mitovesicles are a novel population of extracellular vesicles of mitochondrial origin altered in Down syndrome. Sci. Adv. 2021;7:eabe5085. - PMC - PubMed
    1. van Niel G, D’Angelo G, Raposo G. Shedding light on the cell biology of extracellular vesicles. Nat. Rev. Mol. Cell Biol. 2018;19:213–228. - PubMed
    1. Huang Z, Xu A. Adipose extracellular vesicles in intercellular and inter-organ crosstalk in metabolic health and diseases. Front Immunol. 2021;12:608680. - PMC - PubMed

Publication types