. 2023 Feb 9;14(1):732.
doi: 10.1038/s41467-023-36304-7.

A conformational switch in clathrin light chain regulates lattice structure and endocytosis at the plasma membrane of mammalian cells

Affiliations

A conformational switch in clathrin light chain regulates lattice structure and endocytosis at the plasma membrane of mammalian cells

Kazuki Obashi et al. Nat Commun. .

Abstract

Conformational changes in endocytic proteins are regulators of clathrin-mediated endocytosis. Three clathrin heavy chains associated with clathrin light chains (CLC) assemble into triskelia that link into a geometric lattice that curves to drive endocytosis. Structural changes in CLC have been shown to regulate triskelia assembly in solution, yet the nature of these changes, and their effects on lattice growth, curvature, and endocytosis in cells are unknown. Here, we develop a new correlative fluorescence resonance energy transfer (FRET) and platinum replica electron microscopy method, named FRET-CLEM. With FRET-CLEM, we measure conformational changes in clathrin at thousands of individual morphologically distinct clathrin-coated structures. We discover that the N-terminus of CLC repositions away from the plasma membrane and triskelia vertex as coats curve. Preventing this conformational switch with chemical tools increases lattice sizes and inhibits endocytosis. Thus, a specific conformational switch in the light chain regulates lattice curvature and endocytosis in mammalian cells.


Conflict of interest statement

The authors declare no competing interests.

Figures
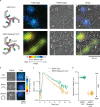
Fig. 1
Fig. 1. FRET-CLEM.
a Correlative FLIM-FRET and PREM images of unroofed membranes of HeLa cells expressing EGFP-CLC (top) or EGFP-ShadowY-CLC (bottom). FLIM images (left; photon counts are represented by brightness and fluorescence lifetimes are represented by pseudo color), PREM images (center), and merge images (right). n = 1 cell for each condition. Scale 500 nm. b PREM images of CCSs on an unroofed membrane of a HeLa cell expressing EGFP-CLC that were classified as flat, domed, or sphere and corresponding areas from a FLIM image. n = 1 cell. Scale 200 nm. c Fluorescence lifetime decays from single CCSs indicated by arrows in panel a. d Mean fluorescence lifetimes from single CCSs on an unroofed membrane of HeLa cells expressing EGFP-CLC or EGFP-ShadowY-CLC. n = 58 CCSs from 1 cell (EGFP-CLC) and 81 CCSs from 1 cell (EGFP-ShadowY-CLC). For box plots, box is interquartile range, center line is median, center circle is mean, whiskers are minimum and maximum data points with a coefficient value of 1.5. Source data are provided as a Source Data file.
Fig. 2
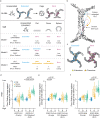
Fig. 2. CLC conformational changes in cells.
a Schematic models of CLC conformation at different assembly states in vitro or in living cells and their expected FRET efficiencies between the N- and C-terminus of CLCs. b A structural model with the assumption that either extended (light blue) or bent conformations (magenta) of CLCs assemble into the lattice. The model is based on PDB 3LVG and 6WCJ. 3LVG is overlaid with 6WCJ. c Schematic models of two assembled triskelia with extended (left) or bent CLCs (right). A CLC N-terminus position (yellow) and C-terminus positions of surrounding CLCs (orange) are shown. d FRET-CLEM was performed on HeLa cells expressing either EGFP-CLC, or EGFP-CLC and CLC-ShadowY. Mean fluorescence lifetimes from single CCSs were analyzed by categorizing them according to lattice structures (flat, domed and sphere) and they were compared to the average values of flat structures. n = 6 cells from 3 experiments (EGFP-CLC) and n = 6 cells from 4 experiments (EGFP-CLC and CLC-ShadowY). e FRET-CLEM on HeLa cells expressing either EGFP-CLCΔN, or EGFP-CLCΔN and CLC-ShadowY. n = 6 cells from 5 experiments (EGFP-CLCΔN) and n = 6 cells from 4 experiments (EGFP-CLCΔN and CLC-ShadowY). f FRET-CLEM on HeLa cells expressing either EGFP-QQN (QQN mutant of CLC), or EGFP-QQN and CLC-ShadowY. n = 6 cells from 3 experiments for each condition. One-way ANOVA, then Tukey’s test. Each dot is from one cell experiment and errors are SE. For box plots, box is interquartile range, center line is median, center circle is mean, whiskers are minimum and maximum data points with a coefficient value of 1.5. Source data are provided as a Source Data file.
Fig. 3
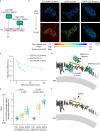
Fig. 3. CLC N-terminal position perpendicular to the plane of the plasma membrane.
a Dipicrylamine (DPA) is a nonfluorescent hydrophobic anion that incorporates into membranes. DPA quenches EGFP in a distance dependent manner by FRET. PM is the plasma membrane. b FLIM images of unroofed membranes of HeLa cells expressing CLC-EGFP (left), EGFP-CLCΔN (center), or EGFP-CLC (right) without (top) or with 20 μM DPA (bottom). Scale 10 μm. c Mean fluorescence lifetimes with different DPA concentrations. n = 16 (EGFP-CLC), 17 (EGFP-CLCΔN), and 15 cells (CLC-EGFP) from 3 experiments. Errors are SE. d A structural model of EGFP positions of CLC probes predicted from the EGFP-DPA FRET experiments. The model is based on PDB 4KW4 and 3LVG. e FRET-CLEM on HeLa cells expressing either CLC-EGFP or EGFP-CLC with DPA. DPA concentrations were 3 μM for CLC-EGFP and 80 μM for EGFP-CLC to obtain ~50% FRET efficiencies to make the degree of fluorescence lifetime changes similar. Mean fluorescence lifetimes from single CCSs were analyzed by categorizing them according to lattice structures and compared to average values of flat structures. n = 6 cells from 4 experiments for each condition. Each dot is from one cell experiment and errors are SE. One-way ANOVA, then Tukey’s test. For box plots, box is interquartile range, center line is median, center circle is mean, whiskers are minimum and maximum data points with a coefficient value of 1.5. f A proposed structural model of CLC conformational changes predicted from both FRET-CLEM with EGFP-ShadowY and EGFP-DPA. The N-terminus of CLC moves away from both the CLC C-terminus (triskelion vertex) and the plane of the plasma membrane as clathrin lattices curve. The structural model is based on PDB 3LVG. Source data are provided as a Source Data file.
Fig. 4
Fig. 4. Manipulation of CLC N-terminal position using a chemically inducible dimerization system.
a Schematic models of the chemically inducible FKBP/FRB dimerization system. FKBP is attached to the N-terminus of CLC, and two FRBs (FRB×2) are attached to the C-terminus of PH domain from PLCδ1. A rapamycin analog, AP21967, induces heterodimerization between FKBP and the T2098L mutant of FRB. b Potential FRET pairs without or with AP21967 treatment either absence or presence with DPA. c Fluorescence lifetime measurements were performed on unroofed membranes of HeLa cells expressing FKBP-EGFP-CLC either with PH-miRFP-FRB, or PH-miRFP-FRB×2 without or with 20 μM DPA. Cells were unroofed after 15 min incubation with AP21967 or ethanol (control). n = 20 (PH-miRFP-FRB, control), 19 (PH-miRFP-FRB, AP21967), 20 (PH-miRFP-FRB×2, control), and 19 cells (PH-miRFP-FRB×2, AP21967) from 3 experiments. d Differences in fluorescence lifetimes (shown in panel c) without and with DPA. For box plots, box is interquartile range, center line is median, center circle is mean, whiskers are minimum and maximum data points with a coefficient value of 1.5. Source data are provided as a Source Data file.
Fig. 5
Fig. 5. Manipulation of CLC conformation changed lattice structures, dynamics, and endocytosis.
ac Unroofed membranes from cells expressing FKBP-EGFP-CLC and PH-miRFP-FRB×2 treated with AP21967 (AP) or ethanol (control) were imaged with PREM. Two-dimension area of single CCS were manually segmented and measured. Membrane area occupation against the total analyzed membrane area (a), two-dimension projection area (b), and density (c) of flat, domed, and sphere CCSs were compared. Each dot is from one cell experiment, and errors are SE. n = 6 cells from 3 experiments for each condition. The average measured area / cell (mean ± SE) = 213 ± 34 (control) and 165 ± 10 μm2 (AP21967). d Live cell time lapse TIRF imaging on HeLa cells expressing FKBP-EGFP-CLC and PH-miRFP-FRB×2 without or with AP21967 treatment. Tracks with over 20 s were analyzed and residence times were compared. n = 206 spots from 5 cells from 3 experiments (no treatment) and 234 spots from 5 cells from 4 experiments (AP21967). A two-sided unpaired t test was used. e Histogram of residence times. f Confocal projection images of Alexa Fluor 647 conjugated transferrin (Tf-AF647) uptake in HeLa cells expressing FKBP-EGFP-CLC and PH-mCherry-FRB×2 treated with AP21967 or ethanol (control). Fluorescence intensity of Tf-AF647 (arbitrary units) is represented by pseudo color. n = 3 experiments. Scale 50 μm. g Transferrin uptake in HeLa cells expressing FKBP and FRB probes treated with AP21967. Fluorescence intensities of incorporated Tf-AF647 normalized by non-transfected cells in the same sample were compared between non-transfected and transfected cells. n = 116–198 cells from 3 experiments for each conditions. For box plots, box is interquartile range, center line is median, center circle is mean, whiskers are minimum and maximum data points with a coefficient value of 1.5. A two-sided unpaired t test was used. Source data are provided as a Source Data file.
Fig. 6
Fig. 6. Models of conformational switch in CLC in living cells.
Schematic models of conformational switch in CLC at the plasma membrane in cells. CLC assumes an extended conformation in unassembled triskelia in the cytoplasm similar to that seen in x-ray crystal structures. Next, when CLC assembles at the membrane as a flat lattice, CLC changes conformations from the extended to a new folded conformation. The N-terminus is then displaced deeper into the cytosol as clathrin lattices curve into vesicles. The extended and bent models are based on PDB 3LVG.

References

    1. McMahon HT, Boucrot E. Molecular mechanism and physiological functions of clathrin-mediated endocytosis. Nat. Rev. Mol. Cell Biol. 2011;12:517–533. - PubMed
    1. Kaksonen M, Roux A. Mechanisms of clathrin-mediated endocytosis. Nat. Rev. Mol. Cell Biol. 2018;19:313–326. - PubMed
    1. Mettlen M, Chen PH, Srinivasan S, Danuser G, Schmid SL. Regulation of clathrin-mediated endocytosis. Annu Rev. Biochem. 2018;87:871–896. - PMC - PubMed
    1. Sochacki KA, Dickey AM, Strub MP, Taraska JW. Endocytic proteins are partitioned at the edge of the clathrin lattice in mammalian cells. Nat. Cell Biol. 2017;19:352–361. - PMC - PubMed
    1. Mund M, et al. Systematic nanoscale analysis of endocytosis links efficient vesicle formation to patterned actin nucleation. Cell. 2018;174:884–896.e817. - PMC - PubMed

Publication types