. 2023 Feb;4(2):240-256.
doi: 10.1038/s43018-022-00508-5. Epub 2023 Feb 9.

A reversible SRC-relayed COX2 inflammatory program drives resistance to BRAF and EGFR inhibition in BRAFV600E colorectal tumors

Affiliations

A reversible SRC-relayed COX2 inflammatory program drives resistance to BRAF and EGFR inhibition in BRAFV600E colorectal tumors

Ana Ruiz-Saenz et al. Nat Cancer. 2023 Feb.

Abstract

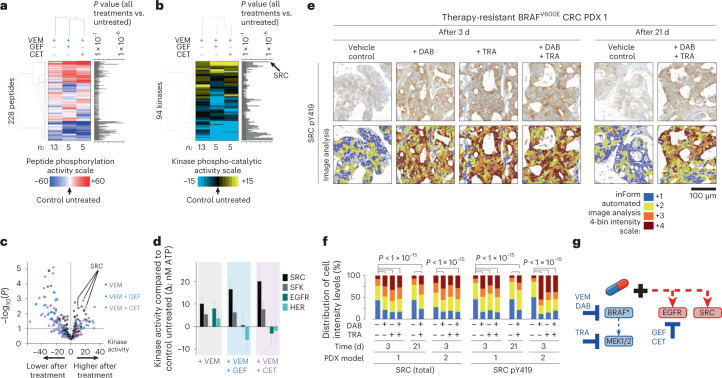
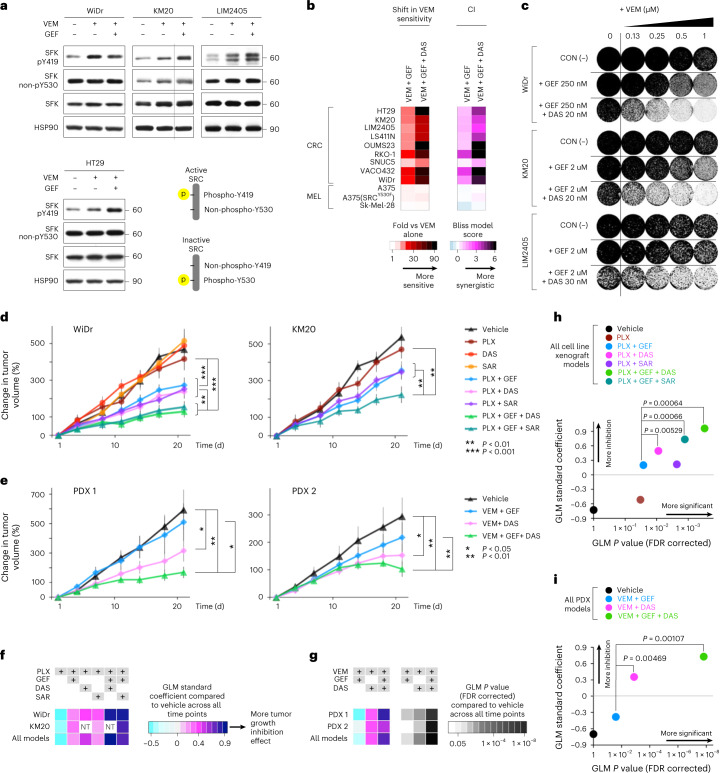
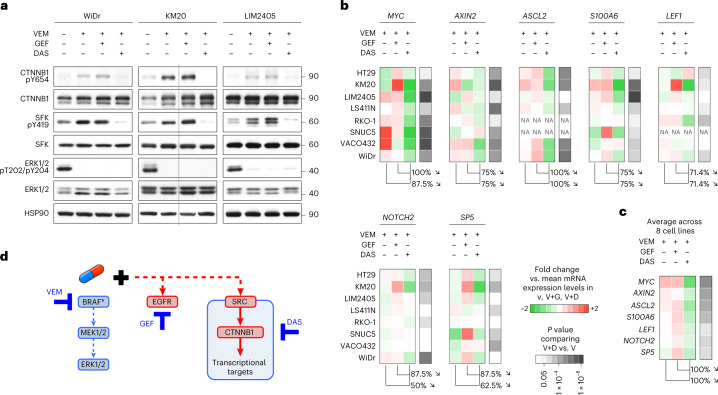
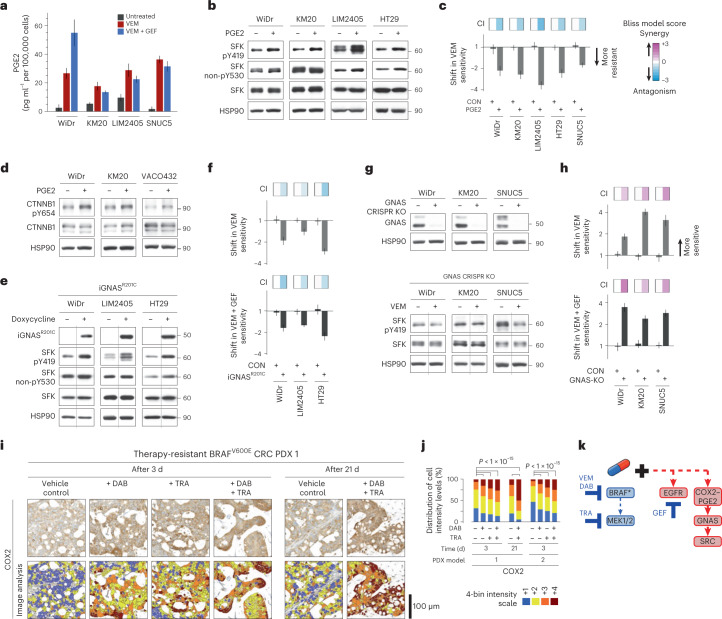
BRAFV600E mutation confers a poor prognosis in metastatic colorectal cancer (CRC) despite combinatorial targeted therapies based on the latest understanding of signaling circuitry. To identify parallel resistance mechanisms induced by BRAF-MEK-EGFR co-targeting, we used a high-throughput kinase activity mapping platform. Here we show that SRC kinases are systematically activated in BRAFV600E CRC following targeted inhibition of BRAF ± EGFR and that coordinated targeting of SRC with BRAF ± EGFR increases treatment efficacy in vitro and in vivo. SRC drives resistance to BRAF ± EGFR targeted therapy independently of ERK signaling by inducing transcriptional reprogramming through β-catenin (CTNNB1). The EGFR-independent compensatory activation of SRC kinases is mediated by an autocrine prostaglandin E2 loop that can be blocked with cyclooxygenase-2 (COX2) inhibitors. Co-targeting of COX2 with BRAF + EGFR promotes durable suppression of tumor growth in patient-derived tumor xenograft models. COX2 inhibition represents a drug-repurposing strategy to overcome therapeutic resistance in BRAFV600E CRC.


Conflict of interest statement

C.E.A. served on the scientific advisory boards of Array Biopharma, Pfizer and Pionyr Immunotherapeutics and has received research funding (institutional) from Bristol Meyers Squibb, Erasca, Guardant Health, Kura Oncology, Merck and Novartis. The remaining authors declare no competing interests.

Figures

Fig. 1
Fig. 1. SRC is activated following BRAF/MEK/EGFR inhibition in BRAFV600E CRC.
a,b, Unsupervised hierarchical clustering of the phospho-catalytic activity signatures of WiDr cells treated with vemurafenib (VEM; n = 13 independent experiments) ± gefitinib (GEF; n = 5 independent experiments) or cetuximab (CET; n = 5 independent experiments) as compared to their untreated control counterparts (n = 23 independent experiments). a, ATP consumption in cell extracts using 228 peptide sensors. b, Kinase signatures deconvoluted from the peptide phosphorylation profiles in a. Bar graphs next to the heatmaps show the P values (two-sided Student’s t test) for each of the peptides (a) or kinases (b) comparing all treated samples to controls. c, Volcano plot of the data in b displaying the change in kinase activity versus P value for each treatment arm (same as b: VEM, n = 13; VEM + GEF, n = 5; VEM + CET, n = 5; as compared to their untreated control counterparts (n = 23), where n is the number of independent experiments). d, Bar graphs of the data in b representing the shift in activity of SRC, SFK, EGFR and HER family kinases when cells were treated with vemurafenib alone or in combination with gefitinib or cetuximab. Kinase activity is compared to that in untreated control cells, and data are displayed as the average ± standard error in nM of ATP. Same as in b,c: VEM, n = 13; VEM + GEF, n = 5; VEM + CET, n = 5; as compared to their untreated control counterparts (n = 23), where n is the number of independent experiments. e, Representative IHC images showing staining intensity for active SFK (phosphorylated Y419 epitope in the SRC activation site) following treatment of a BRAFV600E CRC PDX model with vehicle control, dabrafenib (DAB) and/or trametinib (TRA) for 3 or 21 d. The color-coded bottom panel highlights differences in bin intensities from automated image analysis (see Methods for details). IHC images and intensity quantifications are representative of n = 2 independent PDX tumors per treatment condition and n = 20 independent tissue areas per tumor and per condition. f, Quantification of IHC staining intensity for total and activated SFK in two PDX models treated for 3 or 21 d with dabrafenib ± trametinib versus vehicle control (two-sided Student’s t test, P < 1 × 10–15). Using batch processing and automated analysis of IHC images, protein expression was measured at the single-cell level (that is, n ≥ 10,000 individual cancer cells per treatment condition and tumor). g, Proposed parallel mechanism of SRC activation in response to BRAF/MEK/EGFR therapies in BRAFV600E CRC. BRAF*, BRAFV600E. Source data
Fig. 2
Fig. 2. SRC kinase inhibition sensitizes BRAFV600E CRC cell lines to vemurafenib.
a, Cell viability assays evaluating WiDr cells treated with vemurafenib plus a panel of kinase inhibitors selected on the basis of the results in Fig. 1b. The size of each bubble indicates the magnitude of the change in kinase activity induced by vemurafenib treatment (Fig. 1b), with color signifying increased (yellow) or decreased (blue) activity; (y axis, log2 scale). rs is the Spearman’s rho correlation, and the P value is from a two-tailed t test. Drug combinations were tested in n = 89 independent experiments. b, Shift in vemurafenib sensitivity, measured by cell viability assay (left) and calculation of the CI (right), upon treatment of BRAFV600E CRC or melanoma (MEL) cell lines with vemurafenib together with a SRC inhibitor (dasatinib (DAS), saracatinib (SAR) or bosutinib (BOS)) or an EGFR inhibitor (gefitinib) for 3 d. CI scores are averaged from individual experimental CIs calculated at 1×GI50, 2×GI50 and 0.5×GI50 concentrations of each drug (n ≥ 3 independent experiments). c, Colony formation assays in which BRAFV600E CRC or melanoma (Mel888) cells were treated with an increasing concentration of vemurafenib alone (control, CON) or with a fixed dose of dasatinib. Data are representative of n = 2 independent repeats. d, Western blots showing knockdown of SRC in BRAFV600E CRC cell lines stably transfected with a control shRNA (shCON) or two different SRC-targeting shRNAs (shSRC). HSP90 serves as a loading control. Molecular weight/size markers are indicated on the right (kDa). The experiment was repeated three independent times with similar results. e, Bar graphs representing the fold change (log2 scale) ± standard error for change in sensitivity to vemurafenib with knockdown of SRC in 3-day cell viability assays. Top, CI, Bliss model score; colors as in b (n = 3 independent experiments per cell line). f, Colony formation in BRAFV600E CRC cells treated with an increasing concentration of vemurafenib with or without SRC knockdown. Data are representative of n = 2 independent repeats. Source data
Fig. 3
Fig. 3. Coordinated targeting of SRC with BRAF + EGFR increases efficacy in BRAFV600E CRC cell lines and xenografts.
a, BRAFV600E CRC cell lines treated with vemurafenib ± gefitinib were lysed and immunoblotted with the indicated antibodies. SFK activation is reflected by increased phosphorylation of the SRC activation site Y419 (pY419) and lack of phosphorylation of the inhibitory site Y530 (non-pY530). Active SRC can be deactivated by rephosphorylation of Y530 by CSK. HSP90 serves as a loading control. Molecular weight/size markers are indicated on the right (kDa). The experiment was repeated three times with similar results. b, Shift in vemurafenib sensitivity measured by cell viability assay (left) and calculation of the CI (right) upon treatment of BRAFV600E CRC or melanoma cell lines with vemurafenib + gefitinib ± a SRC inhibitor, dasatinib, for 3 d (n = 4 independent experiments per cell line). c, Colony formation assays in which BRAFV600E CRC cells were treated with an increasing concentration of vemurafenib alone (control) or with a fixed dose of gefitinib ± dasatinib. Data are representative of n = 2 independent repeats. d, Treatment of cell line-derived xenograft mouse models with a vemurafenib progenitor, PLX4720 (PLX); dasatinib; saracatinib; and/or gefitinib for 21 d (n = 7 mice per group). Plotted is the percent change in tumor volume relative to baseline (day 1). Data are displayed as the average for all mice in a specified treatment group ± standard error. e, Treatment of PDX models with vemurafenib ± gefitinib ± dasatinib for 21 d, with data plotted as in d (n = 8 mice per group). All raw and relative tumor volumes and exact P values shown in d,e are available as Source Data; P values are from a two-sided Student’s t test. f,g, GLMs testing the association of change in tumor volume between treatment arms and vehicle over time shown in d,e. Effect size is measured as the GLM standard coefficient. A GLM was applied to each tumor model separately or combined. Results for cell line xenografts and PDXs are shown in f and g, respectively. GLM P values corrected for FDR are shown in g. NT, not tested. h,i, Comparison of the effect sizes and FDR-corrected P values of treatment arms with and without a SRC inhibitor. The same number of mice per group shown in d,e was used for the analyses in fi (that is, n = 7 mice per treatment group for WiDr and KM20 cell line xenografts and n = 8 mice per treatment group for PDX models 1 and 2). Source data
Fig. 4
Fig. 4. SRC regulates the phosphorylation of β-catenin.
a, Western blots of BRAFV600E CRC cell lines treated with vemurafenib ± gefitinib or dasatinib. The Y654 residue of CTNNB1 is a reported phospho-target site of SRC kinases. ERK1/ERK2 phospho-T202/Y204 serves as a control for the effect of BRAF inhibition (with vemurafenib). SFK pY419 serves as a control for the effect of SFK inhibition (with dasatinib). Molecular weight/size markers are indicated on the right (kDa). The experiment was repeated three independent times with similar results. b, Color-coded expression levels of β-catenin target genes (MYC, AXIN2, ASCL2, S100A6, LEF1, NOTCH2, SP5) measured using qRT–PCR in BRAFV600E CRC cell lines treated with vemurafenib ± gefitinib or dasatinib. Expression profiles are shown as fold change against the mean mRNA expression level with vemurafenib, vemurafenib + gefitinib, vemurafenib + dasatinib. Percentages indicate the proportion of measurements across eight cell lines where the expression of the indicated gene (top) was lower with vemurafenib + dasatinib than with vemurafenib + gefitinib or vemurafenib alone. The right-most columns indicate P values (Student’s t test) comparing gene expression for vemurafenib + dasatinib versus vemurafenib alone. NA, not available due to expression levels that were too low. n ≥ 3 independent experiments. c, The expression profiles in b averaged across all eight cell lines (n = 4 independent experiments). Exact P values for b,c are available as Source Data. d, Proposed mechanism regulated by SRC that drives resistance to BRAF/MEK/EGFR therapies in BRAFV600E CRC. Source data
Fig. 5
Fig. 5. COX2–PGE2 upregulation mediates SRC activation in BRAFV600E CRC cell lines and PDXs.
a, Levels of secreted PGE2 were measured by ELISA in the conditioned medium of BRAFV600E CRC cell lines treated with vemurafenib ± gefitinib. Data are displayed as the average PGE2 secretion in pg ml–1 per 100,000 cells ± s.d. (n = 3 independent experiments per cell line). b, BRAFV600E CRC cell lines were treated with exogenous PGE2. Cell lysates were assayed by western blot as indicated. Y419 phosphorylation and lack of phosphorylation of Y530 (non-pY530) are used as readouts of SFK activation. HSP90 serves as a loading control. The experiment was repeated two independent times per cell line with similar results. c, Bar graphs representing fold change (log2 scale) ± standard error for change in sensitivity to vemurafenib upon further treatment with PGE2 or untreated control in 3-day cell viability assays. Top, CI, Bliss model. Same methods as in Fig. 2b (n = 3 independent experiments per cell line). d, Western blots to detect pY654 of CTNNB1 in BRAFV600E CRC cell lines treated with exogenous PGE2. The experiment was repeated two independent times per cell line with similar results. e, Three BRAFV600E CRC cell lines engineered with a doxycycline-inducible constitutively active GNAS construct, iGNASR201C, were treated with doxycycline. Cell lysates were assayed by western blot as indicated. The experiment was repeated three times with similar results. f, Bar graphs representing fold change (log2 scale) ± standard error for change in sensitivity to vemurafenib or vemurafenib + gefitinib after iGNASR201C induction in 3-day cell viability assays. Top, CI, as in c (n = 3 independent experiments per cell line). g, GNAS was knocked out in BRAFV600E CRC cells using CRISPR (GNAS-KO). GNAS knockout was validated by western blot (top). GNAS-KO cells were treated with vemurafenib, and cell lysates were assayed by western blot with the indicated antibodies (bottom). The experiment was repeated ≥2 times with similar results. In b,d,e,g, molecular weight/size markers are indicated on the right (kDa). h, Bar graphs representing fold change (log2 scale) ± standard error for change in sensitivity to vemurafenib or vemurafenib + gefitinib with GNAS knockout in 3-day cell viability assays. Top, CI, as in c (n = 3 independent experiments per cell line). i, Representative IHC images showing COX2 staining intensity following treatment of a BRAFV600E CRC PDX model with vehicle control, dabrafenib and/or trametinib for 3 or 21 d (where n is the same as defined in Fig. 1e). The color-coded bottom panel highlights differences in bin intensities from automated image analysis (see Methods for details). j, Quantification of COX2 staining intensity by IHC for two PDX models treated for 3 or 21 d with dabrafenib ± trametinib versus vehicle control (two-sided Student’s t test, P < 1 × 10–15; n is the same as defined in Fig. 1f). k, Proposed mechanism of COX2–PGE2-mediated SRC-driven resistance to BRAF/MEK/EGFR therapies in BRAFV600E CRC. Source data
Fig. 6
Fig. 6. Coordinated targeting of COX2 with BRAF/MEK/EGFR improves efficacy in BRAFV600E CRC cell lines and PDXs.
a, Shift in vemurafenib sensitivity measured by cell viability assay (left) and calculation of CI (right) upon treatment of BRAFV600E CRC or melanoma cell lines with vemurafenib together with a COX2 inhibitor (celecoxib (CEL) or valdecoxib (VAL)) for 3 d. CI is averaged from experimentally measured CIs at 1×GI50, 2×GI50 and 0.5×GI50 concentrations of each drug (n ≥ 2 independent experiments). b, Treatment of BRAFV600E CRC or melanoma cell lines with up to four inhibitors, including trametinib, gefitinib and celecoxib at GI10. Cell growth inhibition across treatment permutations, normalized to vemurafenib monotherapy (left), was used to calculate CI relative to all other treatment arms and subjected to unsupervised hierarchical clustering comparing cell lines and treatment arms (right) (n = 24 independent experiments). c, Mouse weight as a surrogate for toxicity following treatment of BRAFV600E CRC PDXs (23 mice per treatment arm) with vehicle control, dabrafenib, trametinib, celecoxib and/or panitumumab (PAN). Data are displayed as the average weight in grams ± s.d. d, Tumor growth inhibition in BRAFV600E CRC PDX models following treatment with dabrafenib + trametinib ± celecoxib ± panitumumab or vehicle (control). Waterfall plots show the relative change in tumor volume: each bar represents one tumor, and the height of the bar compares the final volume at day 21 (D21) to the starting volume at day 1 (D1). Volume changes are capped at twofold the starting volume (that is, 200%). Tumors that regressed by day 21 are shown in red (compared to the volume at day 1) and purple (compared to the volume at mid-treatment, that is, day 10). Average final tumor volumes per treatment group are indicated underneath the graphs (black font). P values are indicated from two-sided Student’s t tests when P < 0.05. All raw and relative tumor volumes are available as Source Data. e, Semisupervised hierarchical clustering of the percentages of regressing tumors per treatment arm, comparing day 21 versus day 1 and day 21 versus day 10, from the data shown in d (that is, same number (n) of mice per treatment group and per PDX as in d). f, GLMs to test the association of change in tumor volume between treatment arms and vehicle over time. A GLM was applied to each PDX model, and all PDXs were combined. Left, effect size measured as the GLM standard coefficient; semi-unsupervised hierarchical clustering further compares the efficacy of the treatment arms. Right, ranking by GLM P values corrected for FDR. g, Comparison of effect size and FDR-corrected P values for treatment arms with and without the addition of celecoxib. Analyses in f,g used the same number (n) of mice per group as in d. Source data
Fig. 7
Fig. 7. Coordinated targeting of COX2 with BRAF + EGFR improves long-term efficacy in BRAFV600E CRC PDXs.
a,b, Tumor growth profiles in BRAFV600E CRC PDX models 1 and 2 treated with encorafenib (ENC) ± panitumumab ± celecoxib or vehicle (VEH; control). Changes in tumor volume relative to starting volume at day 1 (average ± standard error) are plotted over time. P values from two-sided Student’s t tests across all time points comparing treatment arms are shown as a grayscale underneath each graph. NS, not significant; X, not available. All raw and relative tumor volumes are available as Source Data. In a, n = 11 mice per treatment group; in b: VEH, n = 5 mice; ENC, n = 6 mice; ENC + PAN, n = 9 mice; ENC + PAN + CEL, n = 9 mice. c, GLMs to test the association of change in tumor volume over time, either between treatment arms and vehicle (left) or between combination therapy and encorafenib alone (right). A GLM was applied to each individual PDX model and to both PDXs combined. Top, effect size measured as the GLM standard coefficient comparing the efficacy of the treatment arms. Bottom, GLM FDR-corrected P values. d, Comparison of effect sizes and FDR-corrected P values of treatment arms with and without celecoxib, using vehicle or encorafenib treatment as the baseline (left and right, respectively). The same number of mice per group shown in a,b was used for the analyses in c,d. e, Mouse weight as a surrogate for treatment toxicity. Data are displayed as the average weight in grams ± s.d. All weights from the results shown in a,b were used: VEH, n = 16 mice; ENC, n = 17 mice; ENC + PAN, n = 20 mice; ENC + PAN + CEL, n = 20 mice. f, Schematic summary of the states of signaling pathways depending on treatment: (1) untreated tumors, with BRAF–MEK–ERK as the main driver of progression (red) and baseline activity of the EGFR and COX2–SRC signaling pathways (gray), and (2–4) tumors treated with drugs (listed on top) inhibiting the activity (blue) of the three distinct signaling axes: BRAF–MEK, EGFR and COX2–SRC–β-catenin In scenario (4), triple treatment collectively blocks the cooperative dependencies that drive resistance and progression. Source data
Extended Data Fig. 1
Extended Data Fig. 1. SRC is activated consequent to BRAF/MEK/EGFR inhibition in BRAFV600E CRC specifically.
a, BRAFV600E CRC cell lines were treated with vemurafenib (VEM) for 7 to 8 hours. Vemurafenib was used at 1.75 uM in HT29, 2 uM in KM20, 0.15 uM in LIM2405, 2.25 uM in SNUC5, and 1.5 uM in WiDr (details of treatment conditions (concentration and time) are available in spreadsheets Supplementary Table 2 and 3 of the Supplementary Tables document). Cell lysates were assayed by western blot with the indicated antibodies. Upper panels: SFK activation is reflected by increased phosphorylation of the SRC activation site, Y419 (pY419). HSP90 is used as loading control. Bottom panel: reduction in ERK 1/2 phosphorylation as control of BRAF inhibition. Molecular weight/size markers are indicated on the right (kDa). The experiment was repeated ≥3 times with similar results. b, Representative IHC images showing total SRC staining intensity following treatment of a BRAFV600E CRC PDX model with vehicle control, dabrafenib (DAB) and/or trametinib (TRA) for 3 or 21 days. The color-coded bottom panel highlights differences in bin intensities resulting from automated image analysis (see Methods for details). A scale bar is provided (100 micrometers). As in main Fig. 1e, IHC images and intensity quantifications are representative of n = 2 independent PDX tumors per treatment condition, and n = 20 independent tissue areas per tumor and per condition. c, Quantification of IHC staining intensity for total and activated SFK in two PDX models treated for 3 or 21 days with DAB ± TRA vs. vehicle control. As in main Fig. 1f, we used batch processing and automated analysis of IHC images to quantify protein expression at the single cell level (that is, n ≥ 10,000 individual cancer cells per treatment condition and tumor). d, SRC staining score by IHC in untreated patient CRC tumor specimens with or without a BRAFV600E mutation, from primary (prim.) or metastatic (met.) sites. Source data
Extended Data Fig. 2
Extended Data Fig. 2. SRC kinase activity is inversely correlated with sensitivity to vemurafenib in BRAFV600E CRC cell lines.
a, Shift in vemurafenib (VEM) sensitivity (mean fold-change ± standard error) measured via cell viability assays and calculation of the combination index (CI score; top panel) upon treatment of BRAFV600E or KRAS mutated or MAP3K8 amplified CRC, or melanoma (MEL) cell lines with VEM together with: a SRC inhibitor, dasatinib (DAS), saracatinib (SAR) or bosutinib (BOS), or an EGFR inhibitor, gefitinib (GEF), for three days. Same methods as in Fig. 2b (n = 3 independent experiments per cell line and per drug combination). b, BRAFV600E CRC cell lines were transfected with a siRNA against CSK, a negative regulator of SFKs, and siRNA Control. Cell lysates were assayed by western blot with the indicated antibodies, showing the effect of CSK depletion on SFK activation. Molecular weight/size markers are indicated on the right (kDa). Experiment repeated 3 independent times with similar results. c, Bar graphs representing fold-change (log scale) ± standard error for change in sensitivity to VEM with knockdown of CSK in 3-day cell viability assays. Top panel: combination index, Bliss model score; colors as in Fig. 2b (n = 4 independent experiments). Source data
Extended Data Fig. 3
Extended Data Fig. 3. Coordinated targeting of SRC with BRAF ± EGFR improves efficacy in BRAFV600E CRC cell lines and xenografts without increasing toxicity.
a, Levels of pY419, non-pY530, and total SFK measured by western blot in BRAFV600E CRC cell lines treated with vemurafenib (VEM) ± gefitinib (GEF) were quantitated. Data are normalized to control untreated per cell line and displayed as average ± standard deviation measured across HT29, KM20, LIM2405, WiDr (data available in spreadsheet ‘Fig. 3a’ of the Source Data document; n = 12 independent experiments). b, Shift in vemurafenib (VEM) sensitivity, measured via cell viability assays and calculation of the combination index (CI score; top panel) upon treatment of BRAFV600E CRC or melanoma (MEL) cell lines with VEM + gefitinib (GEF) ± dasatinib (DAS) and VEM + DAS ± GEF, for three days. The addition of DAS to VEM + GEF increases sensitivity to VEM to a greater extent than the addition of GEF to VEM + DAS, highlighting the contribution of SFK and supporting that SFK activation upon VEM treatment is EGFR-independent. Same methods as in Fig. 2b and Extended Data Fig. 2a (n = 4 independent experiments per cell line). c and d, Mouse weight as a surrogate for toxicity following treatment of BRAFV600E CRC cell line xenografts (c) (n = 14 mice per group), or patent-derived xenografts (d) (n = 16 mice per group), with vehicle control or the inhibitors listed. Data is displayed as the average weight in grams ± standard deviation. e, Tumor growth inhibition in BRAFV600E CRC PDX models following treatment with VEM ± GEF ± DAS or vehicle (control). Waterfall plots show the relative change in tumor volume: each bar represents one tumor; and the height of the bar compares the final volume at day 21 to the starting volume at day 1. Volume changes are capped at 5-fold of the starting volume (that is 500%). Average final tumor volumes per treatment group are indicated underneath the graph (black font). Student t-test, two-sided, p-values are indicated when p < 0.05. Tumors that regressed by day 21 compared to volume at mid-treatment (that is, day 10) are shown in purple; percentages of regressing tumors per group are indicated underneath the graph. f, The GLM p-values corrected for false discovery rate (FDR) corresponding to the main Fig. 3f, are shown (n = 8 mice per treatment group per PDX model).
Extended Data Fig. 4
Extended Data Fig. 4. Mechanisms underlying the synergistic effects of co-targeting SRC and the BRAF ± EGFR pathways.
a, Western blots to detect phospho-T202/Y204 ERK1/2 and total ERK1/2 in BRAFV600E CRC cell lines treated with vemurafenib (VEM) ± gefitinib (GEF) or dasatinib (DAS) collected after 8 h, 24 h, 48 h or 72 h. HSP90 is used as a loading control. The experiment was repeated 2 independent times with similar results. b, Quantification of western blots shown in panel (a). The bar plot (averages and standard deviations per treatment condition across cell lines) was overlaid with a dot plot displaying individual measurements per cell line and condition. Data are normalized to p-ERK levels after 8 h treatment with VEM alone. See table below for detailed values and color codes; n = 8 cell lines. c, Western blots to detect total and phospho-Y654 beta-catenin (CTNNB1) in BRAFV600E CRC cell lines treated with VEM, or GEF, or DAS, or combinations of VEM + GEF, or VEM + DAS, or VEM + GEF + DAS. The detection of phospho-Y419 and total SFK serves as a control for the effect of SFK-inhibition (with DAS). The experiment was repeated 3 independent times with similar results. In panels a, c, molecular weight/size markers are indicated on the right (kDa). Source data
Extended Data Fig. 5
Extended Data Fig. 5. GNAS signaling in BRAFV600E CRC cell lines and tumors.
a-b, Western blots to detect phospho-T202/Y204 ERK1/2, total ERK1/2, phospho-S217/S221 MEK1/2, total MEK1/2 in BRAFV600E CRC cell lines modified for GNAS expression, and treated with vemurafenib (VEM). The experiment was repeated 2 independent times per cell line with similar results. a, BRAFV600E CRC cell lines engineered with a doxycycline-inducible constitutively active GNAS construct, iGNASR201C with or without doxycycline treatment (+ or – at the bottom of each panel). b, BRAFV600E CRC cell lines knocked out for GNAS using CRISPR (GNAS-KO or CRIPSR control; indicated as + or – at the bottom of each panel). In panels a-b, molecular weight/size markers are indicated on the right (kDa). c, COX2 staining score by IHC in untreated patient CRC tumor specimens with or without a BRAFV600E mutation, from primary (prim.) or metastatic (met.) sites. Source data

References

    1. Venderbosch S, et al. Mismatch repair status and BRAF mutation status in metastatic colorectal cancer patients: a pooled analysis of the CAIRO, CAIRO2, COIN, and FOCUS studies. Clin. Cancer Res. 2014;20:5322–5330. doi: 10.1158/1078-0432.CCR-14-0332. - DOI - PMC - PubMed
    1. Morris V, et al. Progression-free survival remains poor over sequential lines of systemic therapy in patients with BRAF-mutated colorectal cancer. Clin. Colorectal Cancer. 2014;13:164–171. doi: 10.1016/j.clcc.2014.06.001. - DOI - PMC - PubMed
    1. Kopetz S, et al. Phase II pilot study of vemurafenib in patients with metastatic BRAF-mutated colorectal cancer. J. Clin. Oncol. 2015;33:4032–4038. doi: 10.1200/JCO.2015.63.2497. - DOI - PMC - PubMed
    1. Corcoran RB, et al. Combined BRAF and MEK inhibition with dabrafenib and trametinib in BRAFV600-mutant colorectal cancer. J. Clin. Oncol. 2015;33:4023–4031. doi: 10.1200/JCO.2015.63.2471. - DOI - PMC - PubMed
    1. Kopetz S, et al. Encorafenib, binimetinib, and cetuximab in BRAFV600E-mutated colorectal cancer. N. Engl. J. Med. 2019;381:1632–1643. doi: 10.1056/NEJMoa1908075. - DOI - PubMed

Publication types

MeSH terms