. 2023 Jun;19(6):731-739.
doi: 10.1038/s41589-023-01265-x. Epub 2023 Feb 9.

An optimized bioluminescent substrate for non-invasive imaging in the brain

Affiliations

An optimized bioluminescent substrate for non-invasive imaging in the brain

Yichi Su et al. Nat Chem Biol. 2023 Jun.

Abstract

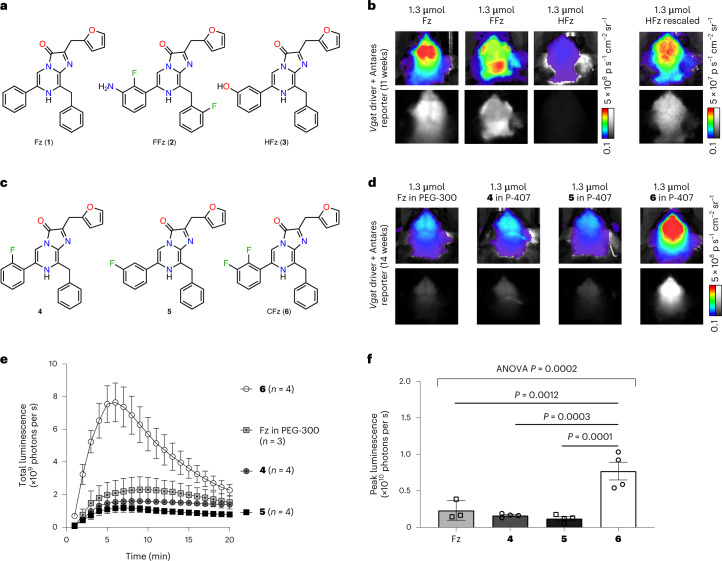
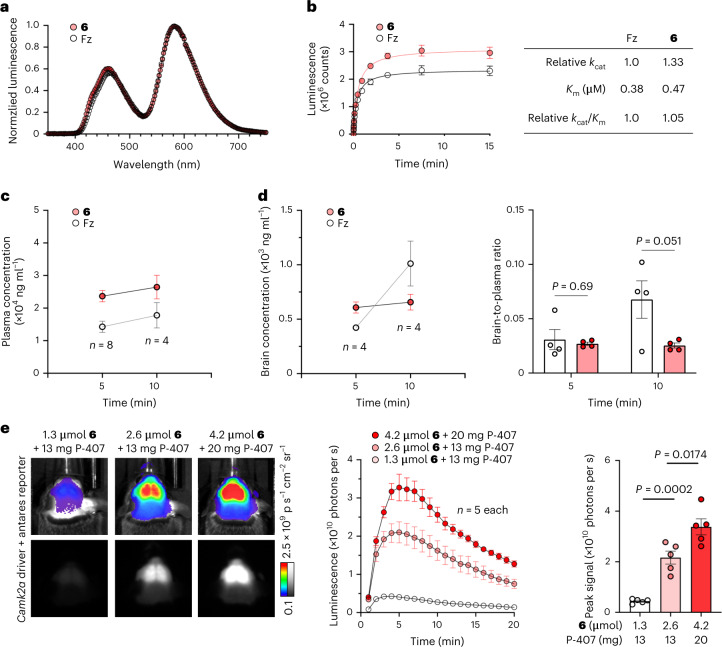
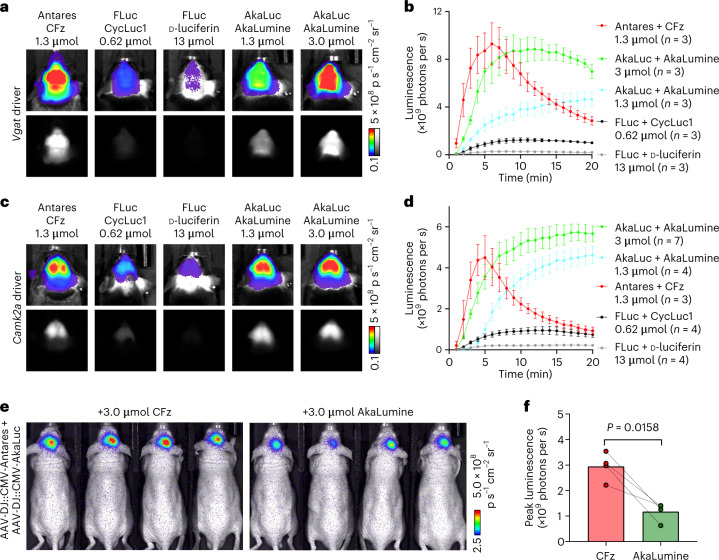
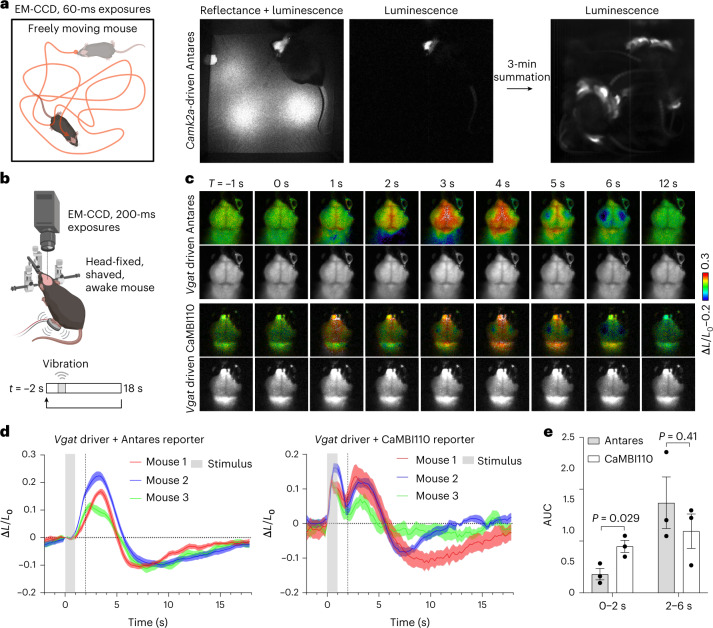
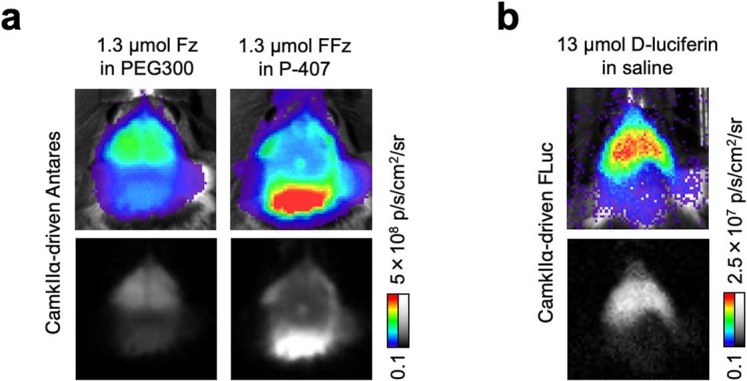
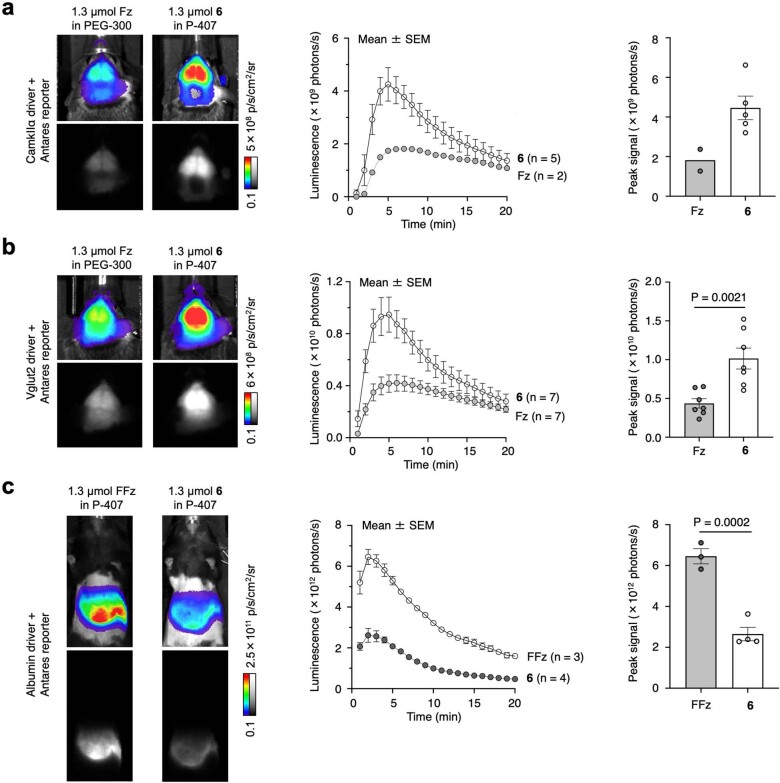
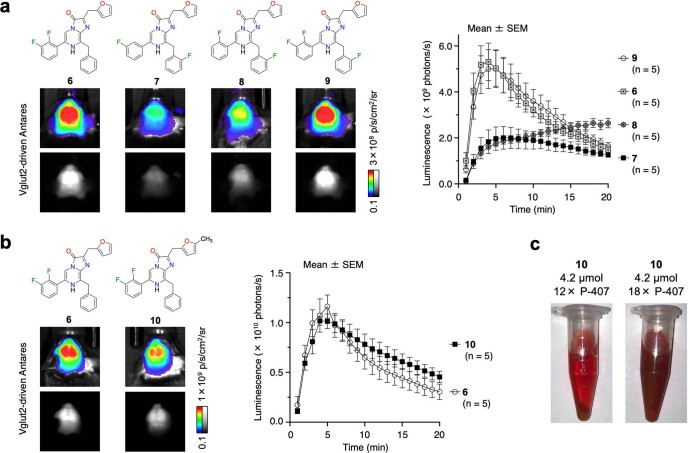
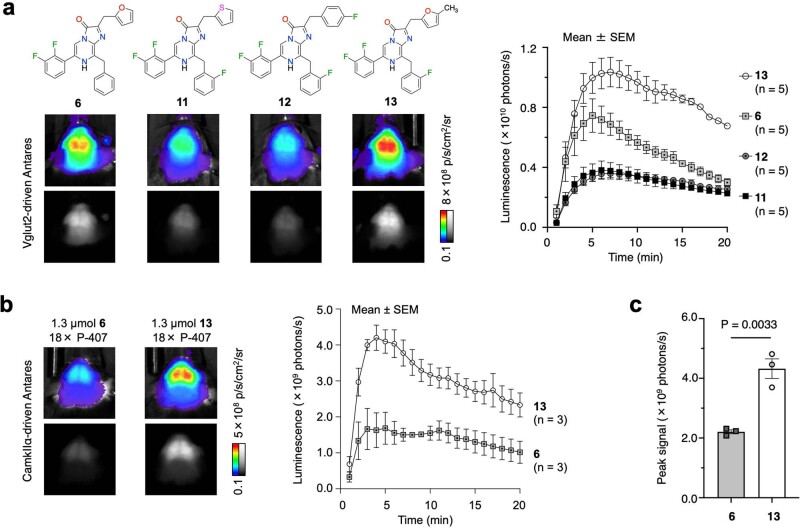
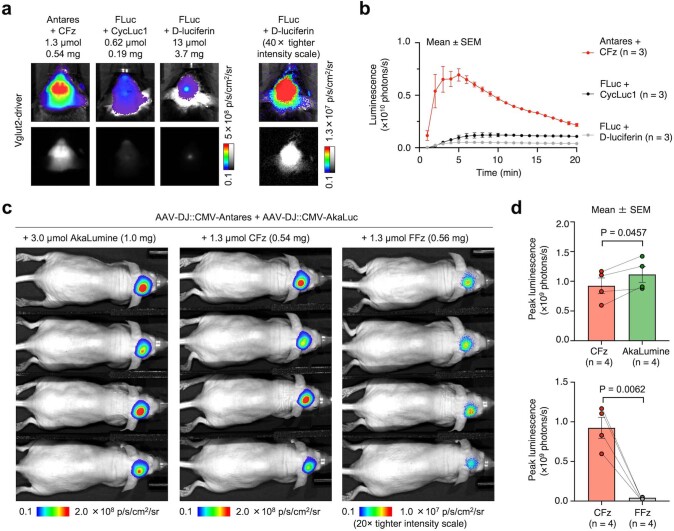
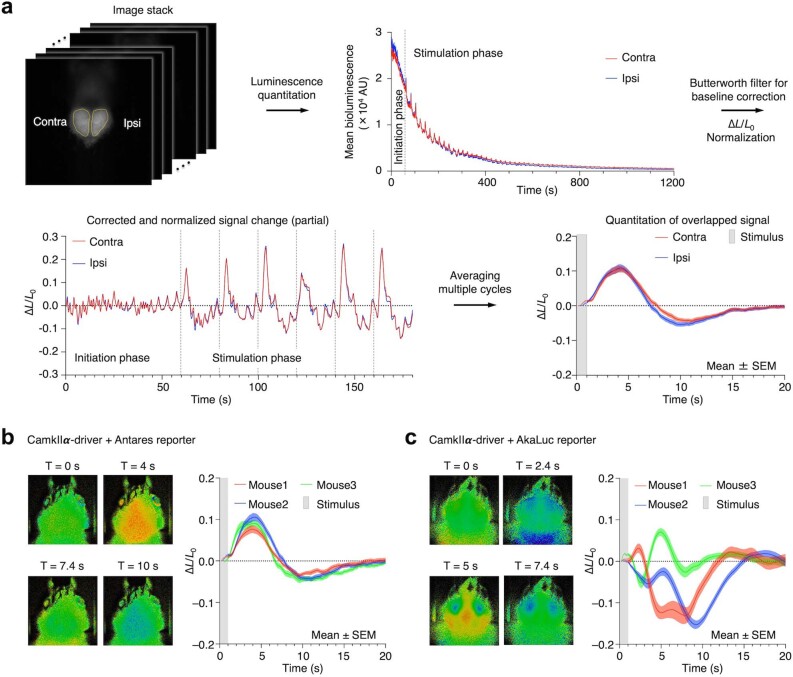
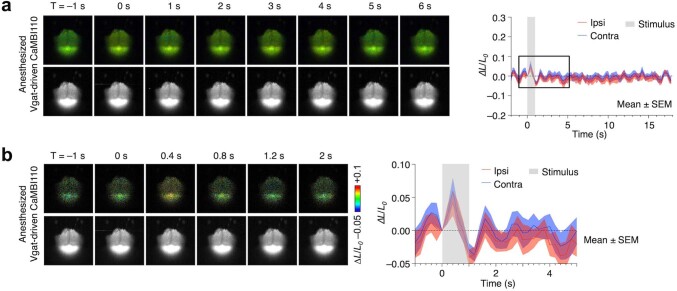
Bioluminescence imaging (BLI) allows non-invasive visualization of cells and biochemical events in vivo and thus has become an indispensable technique in biomedical research. However, BLI in the central nervous system remains challenging because luciferases show relatively poor performance in the brain with existing substrates. Here, we report the discovery of a NanoLuc substrate with improved brain performance, cephalofurimazine (CFz). CFz paired with Antares luciferase produces greater than 20-fold more signal from the brain than the standard combination of D-luciferin with firefly luciferase. At standard doses, Antares-CFz matches AkaLuc-AkaLumine/TokeOni in brightness, while occasional higher dosing of CFz can be performed to obtain threefold more signal. CFz should allow the growing number of NanoLuc-based indicators to be applied to the brain with high sensitivity. Using CFz, we achieve video-rate non-invasive imaging of Antares in brains of freely moving mice and demonstrate non-invasive calcium imaging of sensory-evoked activity in genetically defined neurons.


Conflict of interest statement

J.R.W., M.A.K., M.P.H., L.P.E. and T.A.K. are employees of Promega Corporation and inventors on a patent describing Fz and Fz derivatives. Y.S., L.X.L., X.W., K.M.C., G.H., and M.Z.L. declare no competing interests.

Figures

Fig. 1
Fig. 1. New fluorinated Fz analog with improved brain performance.
a, Structures of established NanoLuc substrates. b, Comparison between NanoLuc substrates in mice doubly hemizygous for Vgat-IRES-cre and CAG-LSL-Antares transgenes; top, linear pseudocolored; bottom, raw grayscale formats. cf, Comparison between Fz and its fluorinated analogs in mice doubly hemizygous for Vgat-IRES-cre and CAG-LSL-Antares transgenes. Substrates were administered i.p. in a PEG-300-based solution. c, Chemical structures of Fz and its fluorinated analogs. d, Representative images with peak bioluminescence. e, Bioluminescence intensity in the brain over time. Data are presented as mean values ± s.e.m.; n = 4 animals for each compound or 3 animals for Fz. f, Statistical analysis of peak signal intensities from e. P values were determined by one-way analysis of variance (ANOVA) followed by Tukey’s post hoc tests. Data are presented as mean values ± s.e.m.
Fig. 2
Fig. 2. Compound 6 enzymology, PK measurements and formulations.
a, Emission spectra of Antares when using Fz or compound 6 as substrate. b, Determination of kinetic parameters of relative kcat and absolute Km for Antares with each substrate. Data are presented as mean values ± s.d.; n = 3 technical replicates. Standard deviation was calculated to provide a measurement of the technical reliability of each measurement and not for the purposes of statistical comparison. c, Mouse plasma levels of Fz and compound 6 after i.p. administration of 1.3 µmol of either substrate. Data are presented as mean values ± s.e.m.; n = 8 animals for each compound at 5 min and n = 4 animals for each compound at 10 min. d, Brain concentration (left) and brain-to-plasma ratios (right) of each substrate. Data are presented as mean values ± s.e.m.; n = 4 animals for each compound at each time point. P values were determined by two-tailed Student’s unpaired t-test. e, Dose and vehicle optimization for compound 6 in mice doubly hemizygous for Camk2a-cre and CAG-LSL-Antares genes. Representative images at peak bioluminescence (left) and bioluminescence intensity over time (center) are shown. Data are presented as mean values ± s.e.m.; n = 4 animals in each condition. Statistical analysis of peak signals by two-tailed Student’s unpaired t-test is shown on the right; P = 0.0002 between 1.3 and 2.6 µmol, and P = 0.0174 between 2.6 and 4.2 µmol. Compound 6 is hereafter named CFz.
Fig. 3
Fig. 3. Comparison of CFz–Antares to other bioluminescent reporter systems.
ad, Comparison between Antares–CFz and other luciferase reporters in transgenic mice. a, Representative images of peak bioluminescence of reporters expressed in VGAT+ neurons. b, Bioluminescence intensity over time. Data are presented as mean values ± s.e.m.; n = 3 independent animals in each condition. c, Representative images of peak bioluminescence of reporters expressed in CaMKIIα+ neurons. d, Bioluminescence intensity over time. Data are presented as mean values ± s.e.m.; n = 7, 4, 3, 4 and 4 animals for AkaLuc with 3 µmol of AkaLumine, AkaLuc with 1.3 µmol of AkaLumine, Antares with 1.3 µmol of CFz, FLuc with 0.62 µmol of CycLuc or FLuc with 13 µmol of d-luciferin, respectively. e, Representative bioluminescence images of Antares–CFz and AkaLuc–AkaLumine in the hippocampus of J:NU mice co-infected with Antares- and AkaLuc-encoded AAV. f, Comparison of peak signal intensities. Data are presented as mean values ± s.e.m.; n = 4 animals, each of which was measured for both Antares–CFz and AkaLuc–AkaLumine signals. P values were determined by two-tailed Student’s paired t-test.
Fig. 4
Fig. 4. In vivo applications of CFz.
a, Video-rate imaging of a mouse doubly hemizygous for Camk2a-cre and CAG-LSL-Antares transgenes. After i.p. injection of CFz, the freely moving mouse was monitored using an EM-CCD camera. Brightfield and luminescent images (60-ms exposure time for each) were alternately acquired, and a representative frame is shown. An integrated luminescent image spanning 3 min is shown. b, Scheme of bioluminescent brain imaging in head-fixed awake mice with foot vibrational stimulation. ce, Comparison of stimulation-dependent brain bioluminescence responses between mice doubly hemizygous for Vgat-cre driver and CAG-LSL-Antares transgenes (Vgat-Antares) or CAG-LSL-CaMBI110 transgenes (Vgat-CaMBI110). c, Representative frames of an image sequence averaged and normalized from repeated 20-s periods of BLI in Vgat-Antares (top) or Vgat-CaMBI110 (bottom) transgenic mice. For each set of images, pseudocolored images (top) and grayscale images (bottom) are shown. d, Quantitation of timelapse, averaged and normalized cortical bioluminescence in c. Each line represents a mean value of n = 3 animals; the shaded area around each line represents s.e.m. The gray box indicates time of the vibrational stimulus applied to the mouse’s hind paw. Traces are averages of 20 stimulation cycles. e, Comparison of the area under the curve (AUC) values before and after the 2-s time point of each mouse in d. Data are presented as mean values ± s.e.m. P values were determined by two-tailed Student’s unpaired t-test.
Extended Data Fig. 1
Extended Data Fig. 1. Fluorofurimazine fails to enter the forebrain.
a, FFz and Fz produce different patterns of light emission in mice doubly hemizygous for CaMKIIα-cre and CAG-LSL-Antares. b, Light emission after D-luciferin injection in mice doubly hemizygous for CaMKIIα-cre and CAG-LSL-FLuc transgenes.
Extended Data Fig. 2
Extended Data Fig. 2. Comparing compound 6 and earlier substrates with additional Cre drivers.
Mice doubly hemizygous for CAG-LSL-Antares reporter and a cre driver gene were injected i.p. with 1.3 µmol 6, Fz, or FFz. In each set: Left, representative images with peak bioluminescence; center, bioluminescence signals over time; right, comparison of peak signals; data are presented as mean values ± SEM. a, CaMKIIα-cre driver; n = 5 animals for compound 6 and 2 animals for Fz. b, Vglut2-IRES-cre driver; n = 7 animals each for 6 and Fz. Compound 6 was brighter in the brain, with P = 0.0021 by two-tailed Student’s unpaired t-test. c, Alb-cre driver; n = 4 animals for compound 6 and 3 animals for FFz. FFz was brighter in the liver, with P = 0.0002 by two-tailed Student’s unpaired t-test.
Extended Data Fig. 3
Extended Data Fig. 3. Additional SAR on compound 6.
Mice doubly hemizygous for CAG-LSL-Antares reporter and Vglut2-IRES-cre driver were injected i.p. with 1.3 µmol substrate with 10 mg P-407. a, Comparison between 6 and Fz analogues with fluorination on C6 and C8 ring rings. b, Comparison between 6 and 10, a Fz analogue with a methylated furan ring. In a and b: Left, representative images with peak bioluminescence; right, bioluminescence intensity in the brain over time; data are presented as mean values ± SEM with n = 5 mice in each group. c, Representative photos of 4.2 µmol 10 suspended in a formulation with P-407 indicating incomplete solubilization. The experiment was performed twice with similar results.
Extended Data Fig. 4
Extended Data Fig. 4. Compound 13 improves brightness.
Reporter mice were injected i.p. with 1.3 µmol substrate with 10 mg P-407. a, Comparison between 6 and Fz analogues with fluorination on the 2-position of the C8 ring and different groups in place of the furan ring, in mice doubly hemizygous for CAG-LSL-Antares reporter and Vglut2-IRES-cre driver; n = 5 animals in each group. b, Comparison between 6 and 13, in mice doubly hemizygous for CAG-LSL-Antares reporter and CaMKIIα-cre driver; n = 3 animals in each group. In a and b: Left, representative images with peak bioluminescence; right, bioluminescence intensity in the brain over time; data are presented as mean values ± SEM. c, Comparison of peak signal intensities for the results in b. Compound 13 was brighter, with P = 0.0033 by two-tailed Student’s unpaired t-test.
Extended Data Fig. 5
Extended Data Fig. 5. Substrate 13 is more toxic than 6 in vivo.
For kidney: asterisks, renal tubular dilation; arrows, renal tubular degeneration and luminal sloughing. For heart: asterisks, myocardial necrosis and hemorrhage. No lesions were noted in the lungs across any groups. The selected images were representative dissection images with the most severe damage of three biological replicates for illustration purposes. Scale bars, 50 μm in kidney, liver, and lung, and 500 μm in heart. Detailed scores of histology analysis of all biological replicates are summarized in Supplementary Table 1.
Extended Data Fig. 6
Extended Data Fig. 6. Minimal toxicity of repeated low-dose administration of CFz.
Renal lesions were minimal to absent in mice receiving 3 or 5 daily i.p. injections of CFz (1.3 µmol). For kidney: asterisks, renal tubular dilation. For heart: asterisk, myocardial necrosis, and hemorrhage. No lesions were noted in the lungs across any groups. The selected images were representative dissection images with the most severe damage of three biological replicates for illustration purposes. Scale bars, 50 μm in kidney, liver, and lung, and 500 μm in heart. Detailed scores of histology analysis of all biological replicates were summarized in Supplementary Table 1.
Extended Data Fig. 7
Extended Data Fig. 7. Limits of CFz dosing.
a, Histology of organs after three daily i.p. injections of 4.2 µmol CFz with 20 mg P-407 or P-407 alone, or five injections of P-407 alone. For kidney: asterisks, renal tubular dilation; arrows, renal tubular degeneration and luminal sloughing. For liver: arrows, hepatic necrosis. For heart: asterisks, myocardial necrosis and hemorrhage. No lesions were noted in the lungs across any groups. Scale bars, 50 μm in kidney, liver, and lung, and 500 μm in heart. b, Representative photos of CFz injectable solution at various concentrations and P-407 vehicle ratios. Red arrows indicate the small fraction of precipitates after being separated by centrifuge. The experiment was repeated independently two times with similar results. c, Dose-dependent bioluminescence for CFz in mice doubly hemizygous for Vgat-IRES-cre and CAG-LSL-Antares.
Extended Data Fig. 8
Extended Data Fig. 8. Additional comparisons between luciferase systems in the brain.
a-b, Comparison between Antares-CFz and FLuc-D-luciferin/CycLuc1 in Vglut2-driven luciferase-expressing reporter mice. a, Representative images with peak bioluminescence from each substrate injection. b, Bioluminescence intensity in the brain over time. Data are presented as mean values ± SEM. n = 3 animals in each group. c–e, Comparison between Antares-CFz/FFz and AkaLuc-AkaLumine pairs in the hippocampus of J:NU mice co-infected with AAV expressing Antares and AAV expressing AkaLuc. c, Representative images with peak bioluminescence from each substrate injection. d, Mean peak signal intensities. Data are presented as mean values ± SEM. P = 0.0457 between Antares-CFz and AkaLuc-AkaLumine and P = 0.0062 between Antares-CFz and Antares-FFz by two-tailed Student’s paired t-test. n = 4 animals in each group.
Extended Data Fig. 9
Extended Data Fig. 9. Effects of stimulation on bioluminescence from constitutive luciferases in awake mice.
a. Example of data processing pipeline for the stimulation and imaging on head-fixed awake mice. b, Stimulation-dependent brain bioluminescence responses of mice doubly hemizygous for a CaMKIIα-cre driver and CAG-LSL-Antares reporter. c, Stimulation-dependent brain bioluminescence responses of mice doubly hemizygous for a CaMKIIα-cre driver and CAG-LSL-AkaLuc reporter. For b and c: Left, representative frames of an image sequence averaged and normalized from repeated 20-s periods of BLI; right, averaged and normalized cortical bioluminescence. Traces in a–c are averages of 57 stimulation cycles.
Extended Data Fig. 10
Extended Data Fig. 10. Orange CaMBI110 responses to vibrational stimulation in anesthesized mice.
a, Left, Representative frames of an image sequence averaged and normalized from 20 cycles of BLI after vibrational stimulus in anesthetized mouse doubly hemizygous for Vgat-cre and CAG-LSL-CaMBI110 transgenes. Top, pseudo-colored images; bottom, grayscale images. Right, normalized mean cortical bioluminescence. Gray box, the vibrational stimulus applied to the mouse’s hind paw. Shaded area, error bars showing s.e.m. b, Left, expanded time series within a shorter time interval surrounding the stimulus. Right, normalized mean traces from the boxed region in a. Traces in a–b are averages of 20 stimulation cycles.

References

    1. Liu S, Su Y, Lin MZ, Ronald JA. Brightening up biology: advances in luciferase systems for in vivo imaging. ACS Chem. Biol. 2021;16:2707–2718. doi: 10.1021/acschembio.1c00549. - DOI - PMC - PubMed
    1. Mezzanotte L, et al. In vivo molecular bioluminescence imaging: new tools and applications. Trends Biotechnol. 2017;35:640–652. doi: 10.1016/j.tibtech.2017.03.012. - DOI - PubMed
    1. Prescher JA, Contag CH. Guided by the light: visualizing biomolecular processes in living animals with bioluminescence. Curr. Opin. Chem. Biol. 2010;14:80–89. doi: 10.1016/j.cbpa.2009.11.001. - DOI - PubMed
    1. Levin RA, et al. An optimized triple modality reporter for quantitative in vivo tumor imaging and therapy evaluation. PLoS ONE. 2014;9:e97415. doi: 10.1371/journal.pone.0097415. - DOI - PMC - PubMed
    1. Ullah I, et al. Live imaging of SARS-CoV-2 infection in mice reveals that neutralizing antibodies require Fc function for optimal efficacy. Immunity. 2021;54:2143–2158. doi: 10.1016/j.immuni.2021.08.015. - DOI - PMC - PubMed

Publication types